Connect TikTok Ads to Power BI
Connect TikTok Ads to Power BI through Coupler.io's no-code integration to automate and schedule data imports. Quickly extract data, organize it according to your preferences, and transform it into reports that reveal your advertising performance.


Connect TikTok Ads to Power BI with Coupler.io to simplify reporting
Get and prepare data effortlessly
Export TikTok Ads to Power BI even if you've got no experience coding. With a single Coupler.io web application, you can query data in multiple ways, have your reports updated at the preferred frequency, and bring together records from different sources.
Automate reporting tasks
Cut down on the time you spend copying and pasting – speed up data imports from TikTok Ads to Power BI thanks to Coupler.io's automation. To improve your analytics further, you can turn data into dynamic interactive dashboards using our free templates.
Stand out as a data-driven expert
Raise your credibility in the eyes of clients and stakeholders by presenting reports that are almost live and packed with data-driven insights. Leverage Coupler.io for data imports and reporting to put greater effort into strategic activities instead.
Export data from TikTok Ads to alternative destinations


Quick start with PPC dashboard templates

Google Analytics PPC dashboard


 +4
+4

Shopify marketing funnel dashboard


 +5
+5

PPC multi-channel dashboard
+2
No such template is available yet.
No worries. Our team will create a template that fits your needs, just tell us more
about your case. It doesn't cost you a penny 😉
Request a custom report
about your case. It doesn't cost you a penny 😉
Export TikTok Ads to Power BI automatically with just a few clicks.
Connect similar PPC apps and get data in minutes


What to export from TikTok Ads to Power BI

Auction ads: Basic campaign report
TikTok auction ad campaign data gives you a clear view of performance metrics like impressions, clicks, and conversions. This report enables strategic campaign optimization as you can identify top-performing campaigns, evaluate ROI, and refine targeting strategies for enhanced audience engagement and conversion rates.
Auction ads: Basic ad report
You can also connect TikTok Ads to Power BI to export data on individual ads. Thanks to metrics such as click-through rates, cost per click, and engagement rates, you can optimize creative elements and allocate budgets effectively. This report provides insights into ad performance across different demographics, placements, and periods.
Auction ads: Basic advertiser report
This data lets you analyze advertiser-level performance metrics and trends. Track key performance indicators such as total spend, impressions, and conversions. This way, you can identify the most effective advertisers, evaluate their contributions to overall campaign success, and refine targeting strategies to improve advertising performance.
Auction ads: Basic ad group report
Here, you can look into ad group performance metrics and trends. Analyze the impact of different ad group strategies, identify the most successful ad groups, optimize targeting parameters, and adjust budget distribution accordingly. This report takes audience segmentation to the next level and helps you improve relevance of your ads.
Auction ads: Audience campaign report
It offers details on campaign performance segmented by audience demographics or interests, which makes it easier for you to optimize campaign messaging. By understanding audience-specific performance metrics, you can customize campaigns to resonate with different segments, maximize audience reach, and drive conversions.
Auction ads: Audience advertiser report
Export TikTok Ads to Power BI for advertiser-level data segmented by audience attributes. This report allows you to evaluate the performance of targeting strategies across different audience segments, optimize ad content, improve audience segmentation, enhance audience targeting precision, and elevate campaign relevance.
Auction ads: Audience ad report
Use this kind of report to monitor metrics such as impressions, clicks, CTR, and conversion rates for each ad variant within different audience segments. Assess the effectiveness of ad creative and messaging for specific audience demographics, identify audience preferences, and optimize your advertising based on this information.
Auction ads: Audience ad group report
Import TikTok Ads to Power BI to get an audience ad group report. It empowers you to evaluate the performance of ad groups targeting specific audience demographics and identify opportunities for optimization. Understand audience behavior and preferences, ensure personalized ad creation, and achieve associated advertising objectives.
How do you connect TikTok Ads to Power BI?
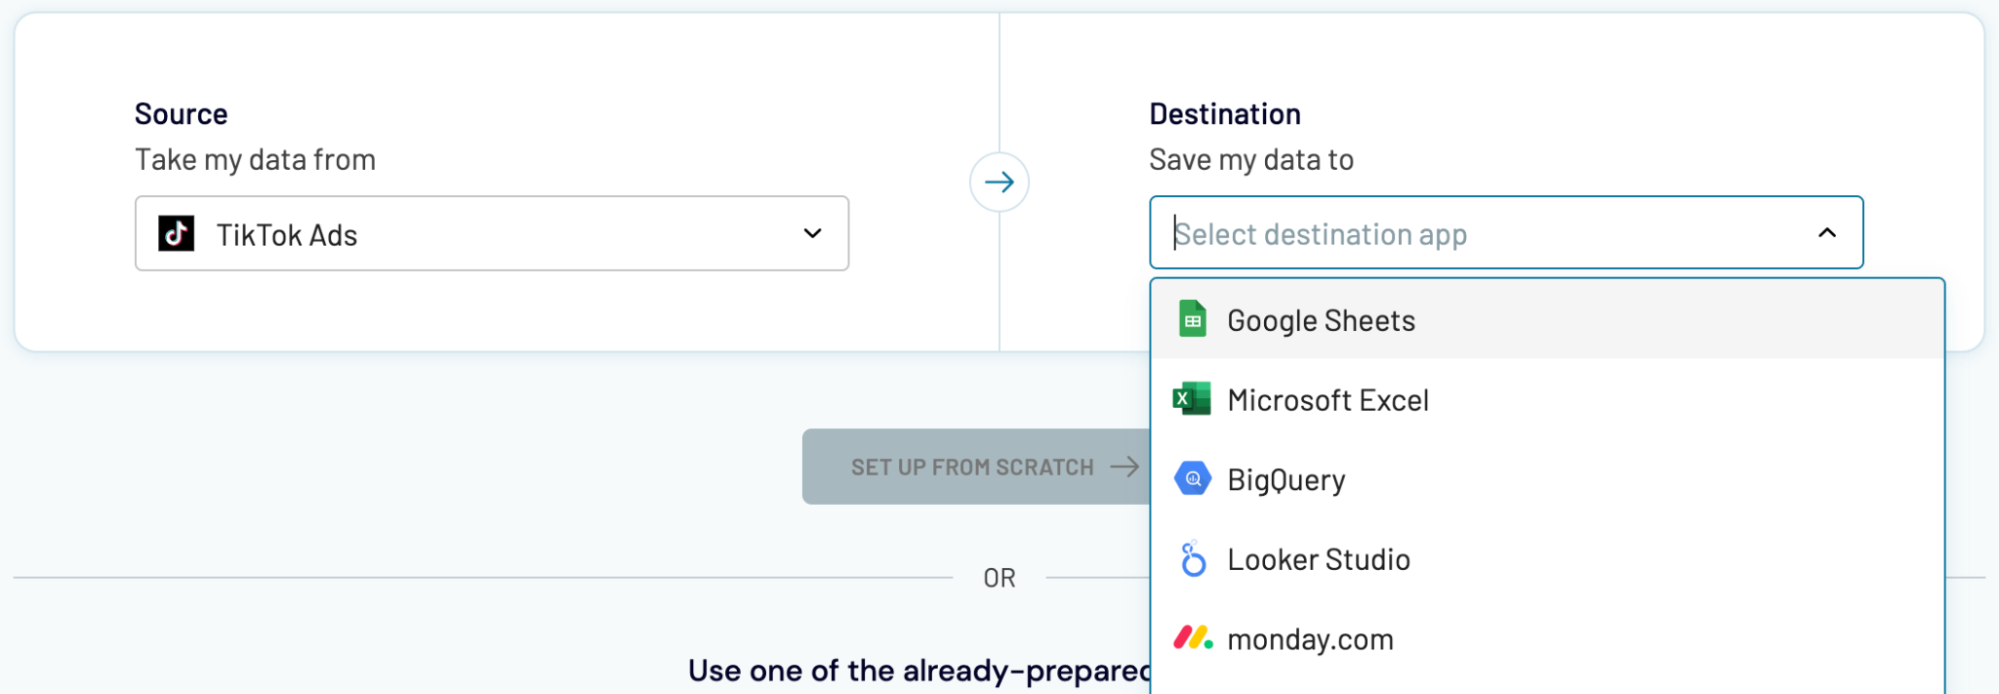
Step 1. Connect your TikTok Ads account and choose the report to export
Step 2. Organize and transform data before loading it to Power BI
Step 3. Connect the Power BI account and copy the integration URL to the desktop app
Step 4. Schedule auto-refreshes to export TikTok Ads to Power BI at desired intervals
Pricing plans
- Monthly
- Annual (save 25%)
Your data is secured by industry standards
 Google Cloud
Certified
 SOC 2 Type II
Certified
 GDPR
GDPRCompliant
 HIPAA
HIPAACompliant
Don’t just take our word for it


How to connect TikTok Ads to Power BI (detailed guide)
Connect TikTok Ads to Power BI by following three simple steps:
Step 1: Collect data
First, connect your TikTok Ads account. Next, select the type of report you wish to export.
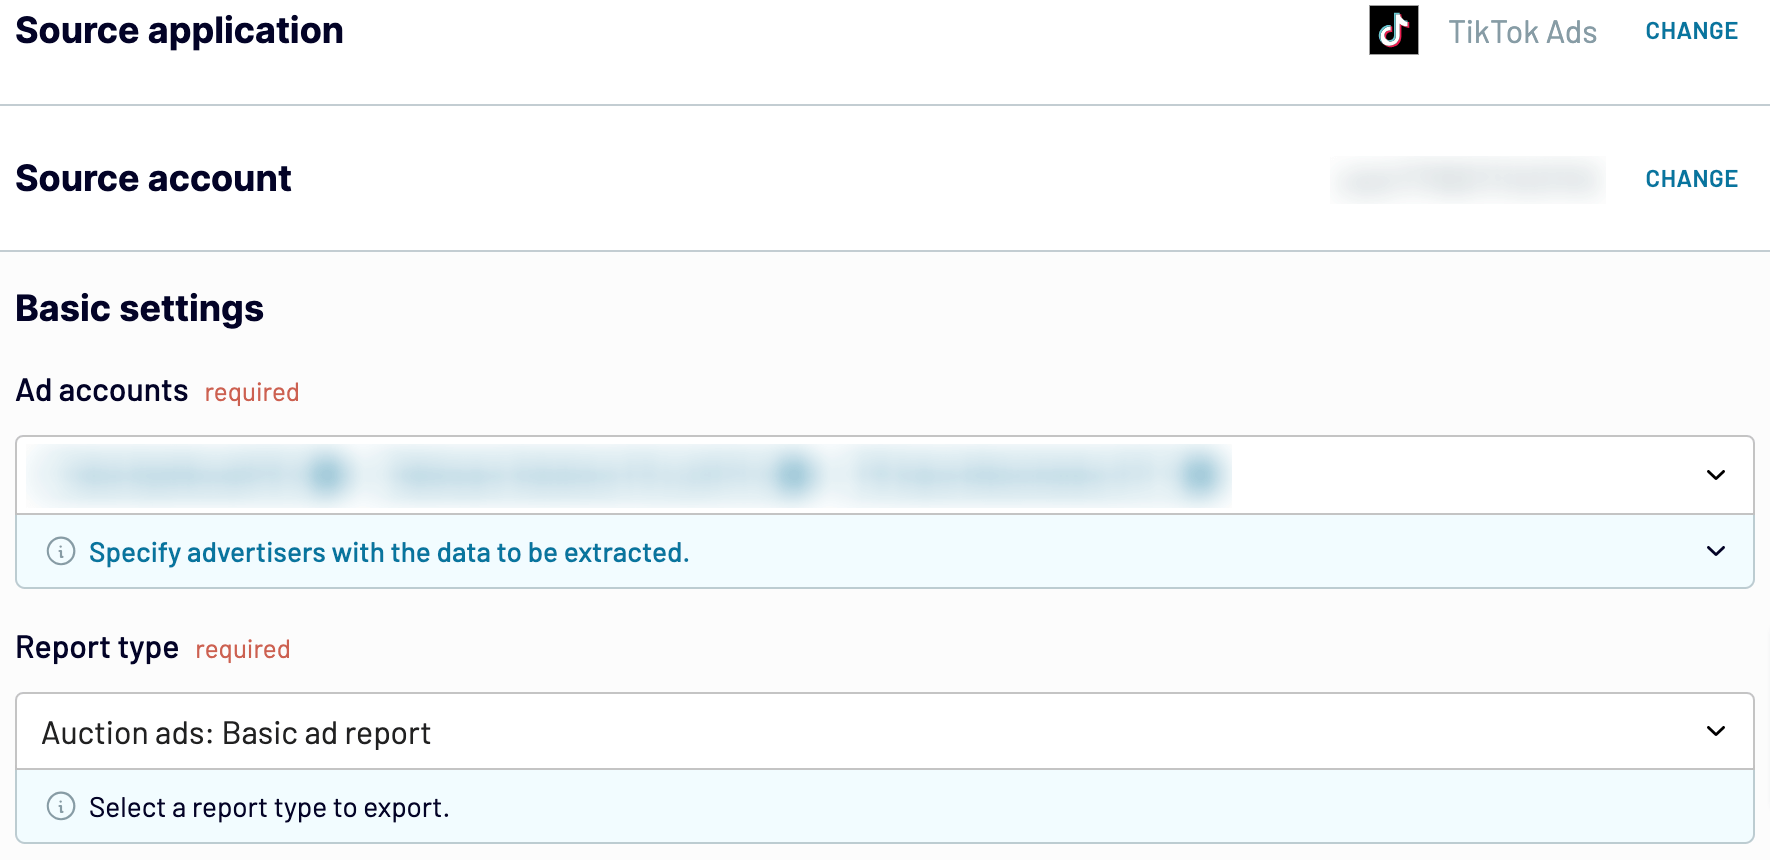
After that, proceed to the next step.
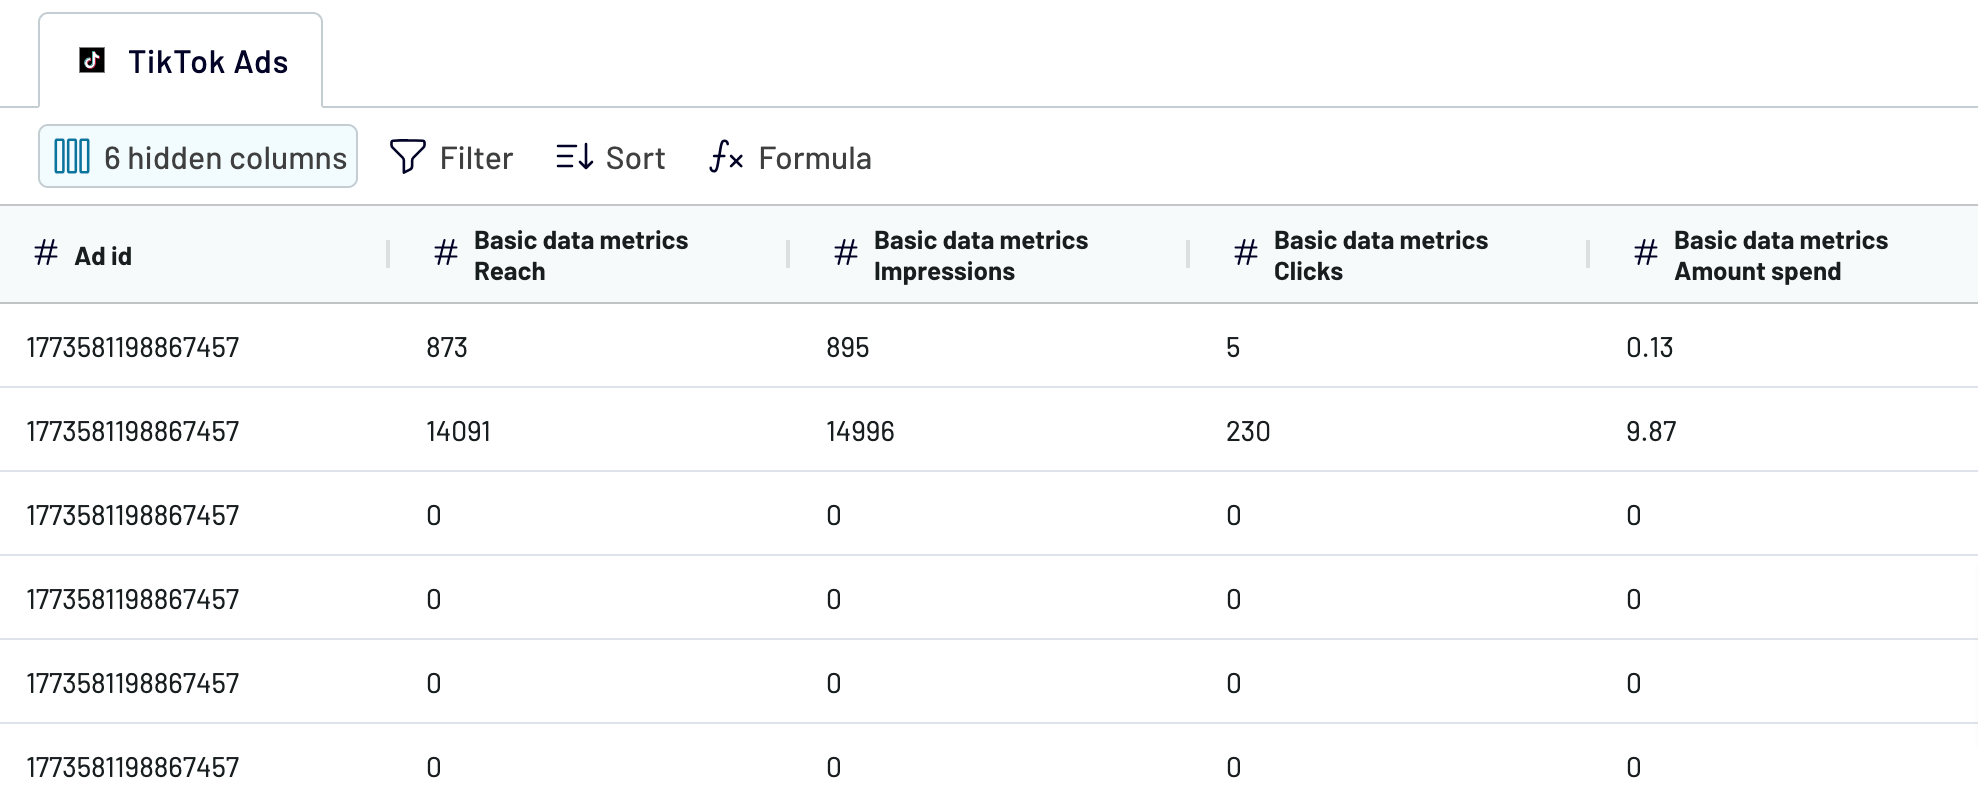
Step 2: Organize and transform
Before you load TikTok Ads to Power BI, check whether your data is accurate. If you need to adjust it, there's a variety of transformations you can make:
This way, you ensure you won't have to modify your data after importing but move to analytics right away.
As soon as you finish this, go next to set up your destination.
Step 3: Load and automate
To transfer data from TikTok Ads to Power BI, follow the in-app instructions to generate the integration URL and paste it into the Power BI desktop application.
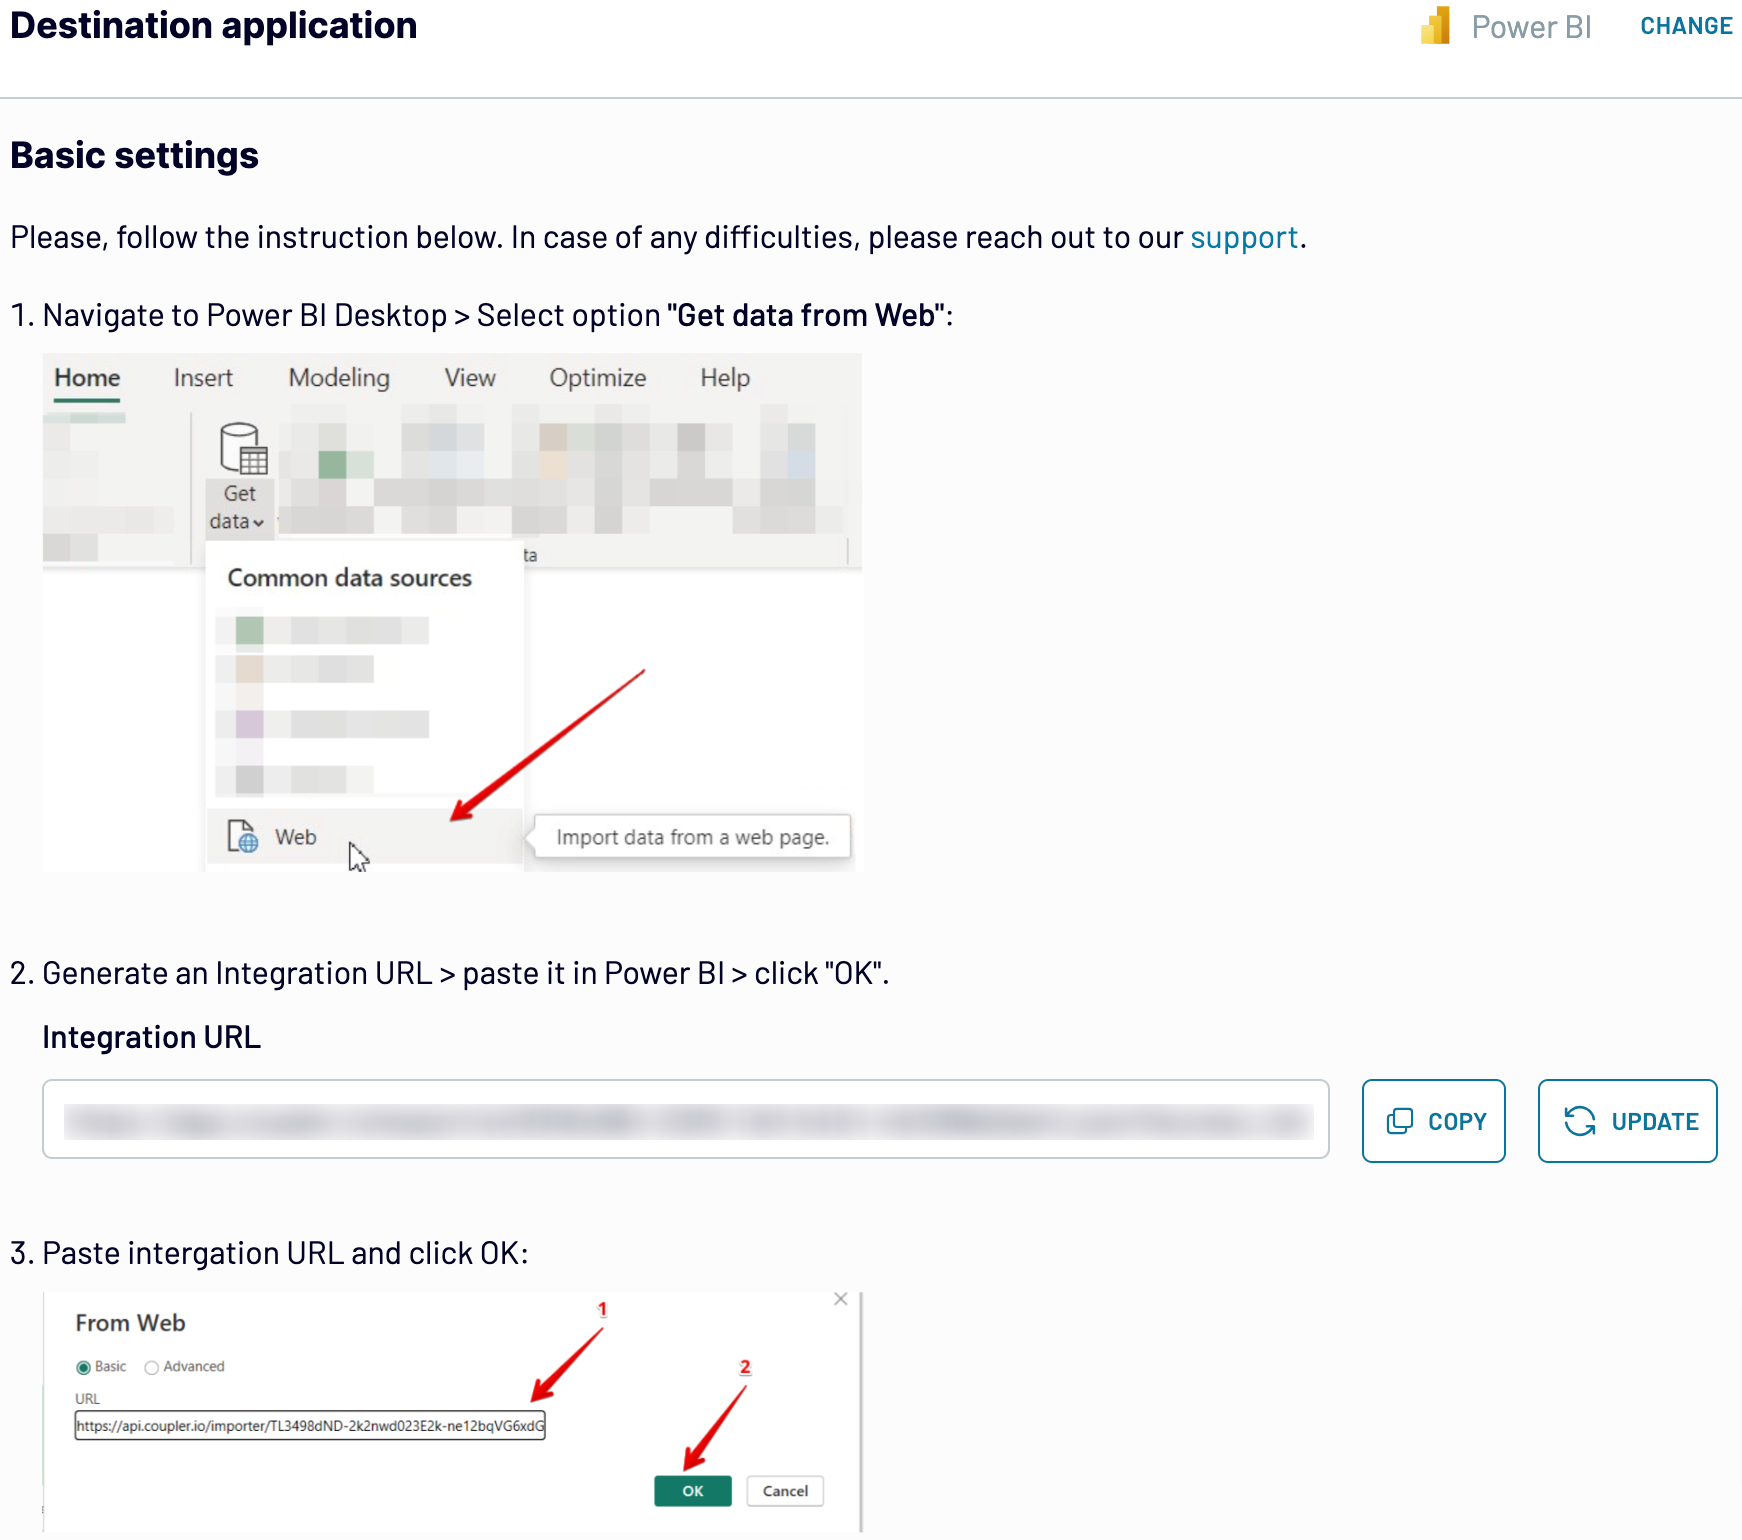
After that, proceed to configure automated data refresh. The last action you'll take is to save and run the importer.
Step 1: Collect data
First, connect your TikTok Ads account. Next, select the type of report you wish to export.
After that, proceed to the next step.
Step 2: Organize and transform
Before you load TikTok Ads to Power BI, check whether your data is accurate. If you need to adjust it, there's a variety of transformations you can make:
- Edit, rearrange, hide, or add columns.
- Apply various filters and sort your data.
- Create new columns with custom formulas.
- Combine data from multiple accounts or apps.
This way, you ensure you won't have to modify your data after importing but move to analytics right away.
As soon as you finish this, go next to set up your destination.
Step 3: Load and automate
To transfer data from TikTok Ads to Power BI, follow the in-app instructions to generate the integration URL and paste it into the Power BI desktop application.
After that, proceed to configure automated data refresh. The last action you'll take is to save and run the importer.
Export TikTok Ads to Power BI and automate it on schedule
Activate automated refreshes to ensure your imported data stays continuously updated. Then, specify frequency according to your preferences, ranging from monthly, daily, or hourly to every 30 or 15 minutes. Additionally, you can select the days of the week, the time slot, and the time zone.
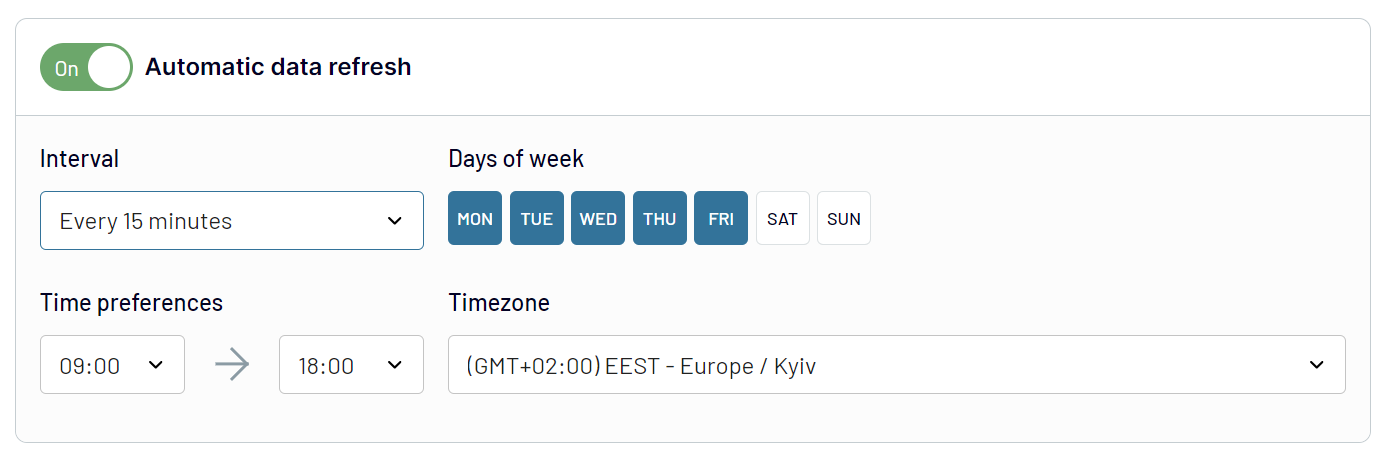
This feature synchronizes your report with the dynamic source data. So you can be sure you always have time-relevant data at your fingertips.
This feature synchronizes your report with the dynamic source data. So you can be sure you always have time-relevant data at your fingertips.
What key metrics can you export from TikTok Ads to Power BI?
Clicks (destination)
Description: Clicks (destination) refer to the number of clicks on your ads that direct users to advertiser-specified destinations such as websites, apps, or the app store.
How to calculate: Simply count the total number of clicks generated by your ads that led users to specified destinations.
Conversions
Description: Conversions represent the number of times your ad achieved a desired outcome based on the objectives and settings you selected.
How to calculate: Count the total number of times desired outcomes, such as purchases, sign-ups, or downloads, are completed as a result of interactions with your ads.
Cost per 1,000 unique user accounts reached
Description: This metric is the average cost required to reach 1,000 unique user accounts with your ads.
How to calculate: Divide the total cost of your advertising campaign by the number of unique user accounts reached, then multiply by 1,000.
CPA
Description: CPA, or cost per acquisition, represents the average amount of money spent on each conversion or installation.
How to calculate: Divide the total cost of your advertising campaign by the number of conversions or installs.
CPC
Description: CPC or cost per click denotes the average amount spent on each click that directs users to a specified destination.
How to calculate: Divide the total cost of your advertising campaign by the number of clicks leading to specified destinations.
CPM
Description: CPM, or cost per mille, is the average cost per 1,000 impressions generated by your ads.
How to calculate: Divide the total cost of your advertising campaign by the number of impressions, then multiply by 1,000.
CTR (destination)
Description: CTR (destination) represents the percentage of times your ad was seen and clicked on, leading users to an advertiser-specified destination.
How to calculate: Divide the total number of clicks leading to specified destinations by the total number of ad impressions, then multiply by 100.
CVR (impressions)
Description: CVR (impressions) indicates the percentage of desired outcomes achieved out of all impressions generated by your ads.
How to calculate: Divide the number of conversions by the total number of impressions, then multiply by 100.
CVR (clicks)
Description: CVR (clicks) represents the percentage of desired outcomes achieved out of all clicks generated by your ads.
How to calculate: Divide the number of conversions by the total number of clicks, then multiply by 100.
Export TikTok Ads to Power BI or another destination
Coupler.io doesn't only connect TikTok Ads to Power BI but also enables you to replicate importers to load data into other destinations:
Whether you're bringing in data to Power BI or other tools, the process remains similar to what we've described previously.
- Spreadsheet applications: Microsoft Excel and Google Sheets.
- Data warehouses: BigQuery, PostgreSQL, and Redshift.
- Other business intelligence (BI) tools: Looker Studio, Tableau, and Qlik Sense.
Whether you're bringing in data to Power BI or other tools, the process remains similar to what we've described previously.