Connect YouTube Analytics to Power BI
Connect YouTube analytics to Power BI with Coupler.io to import data automatically. Within a few minutes, you can extract, arrange, and transform data to suit your requirements. Gain valuable insights from thorough reports that highlight your performance.


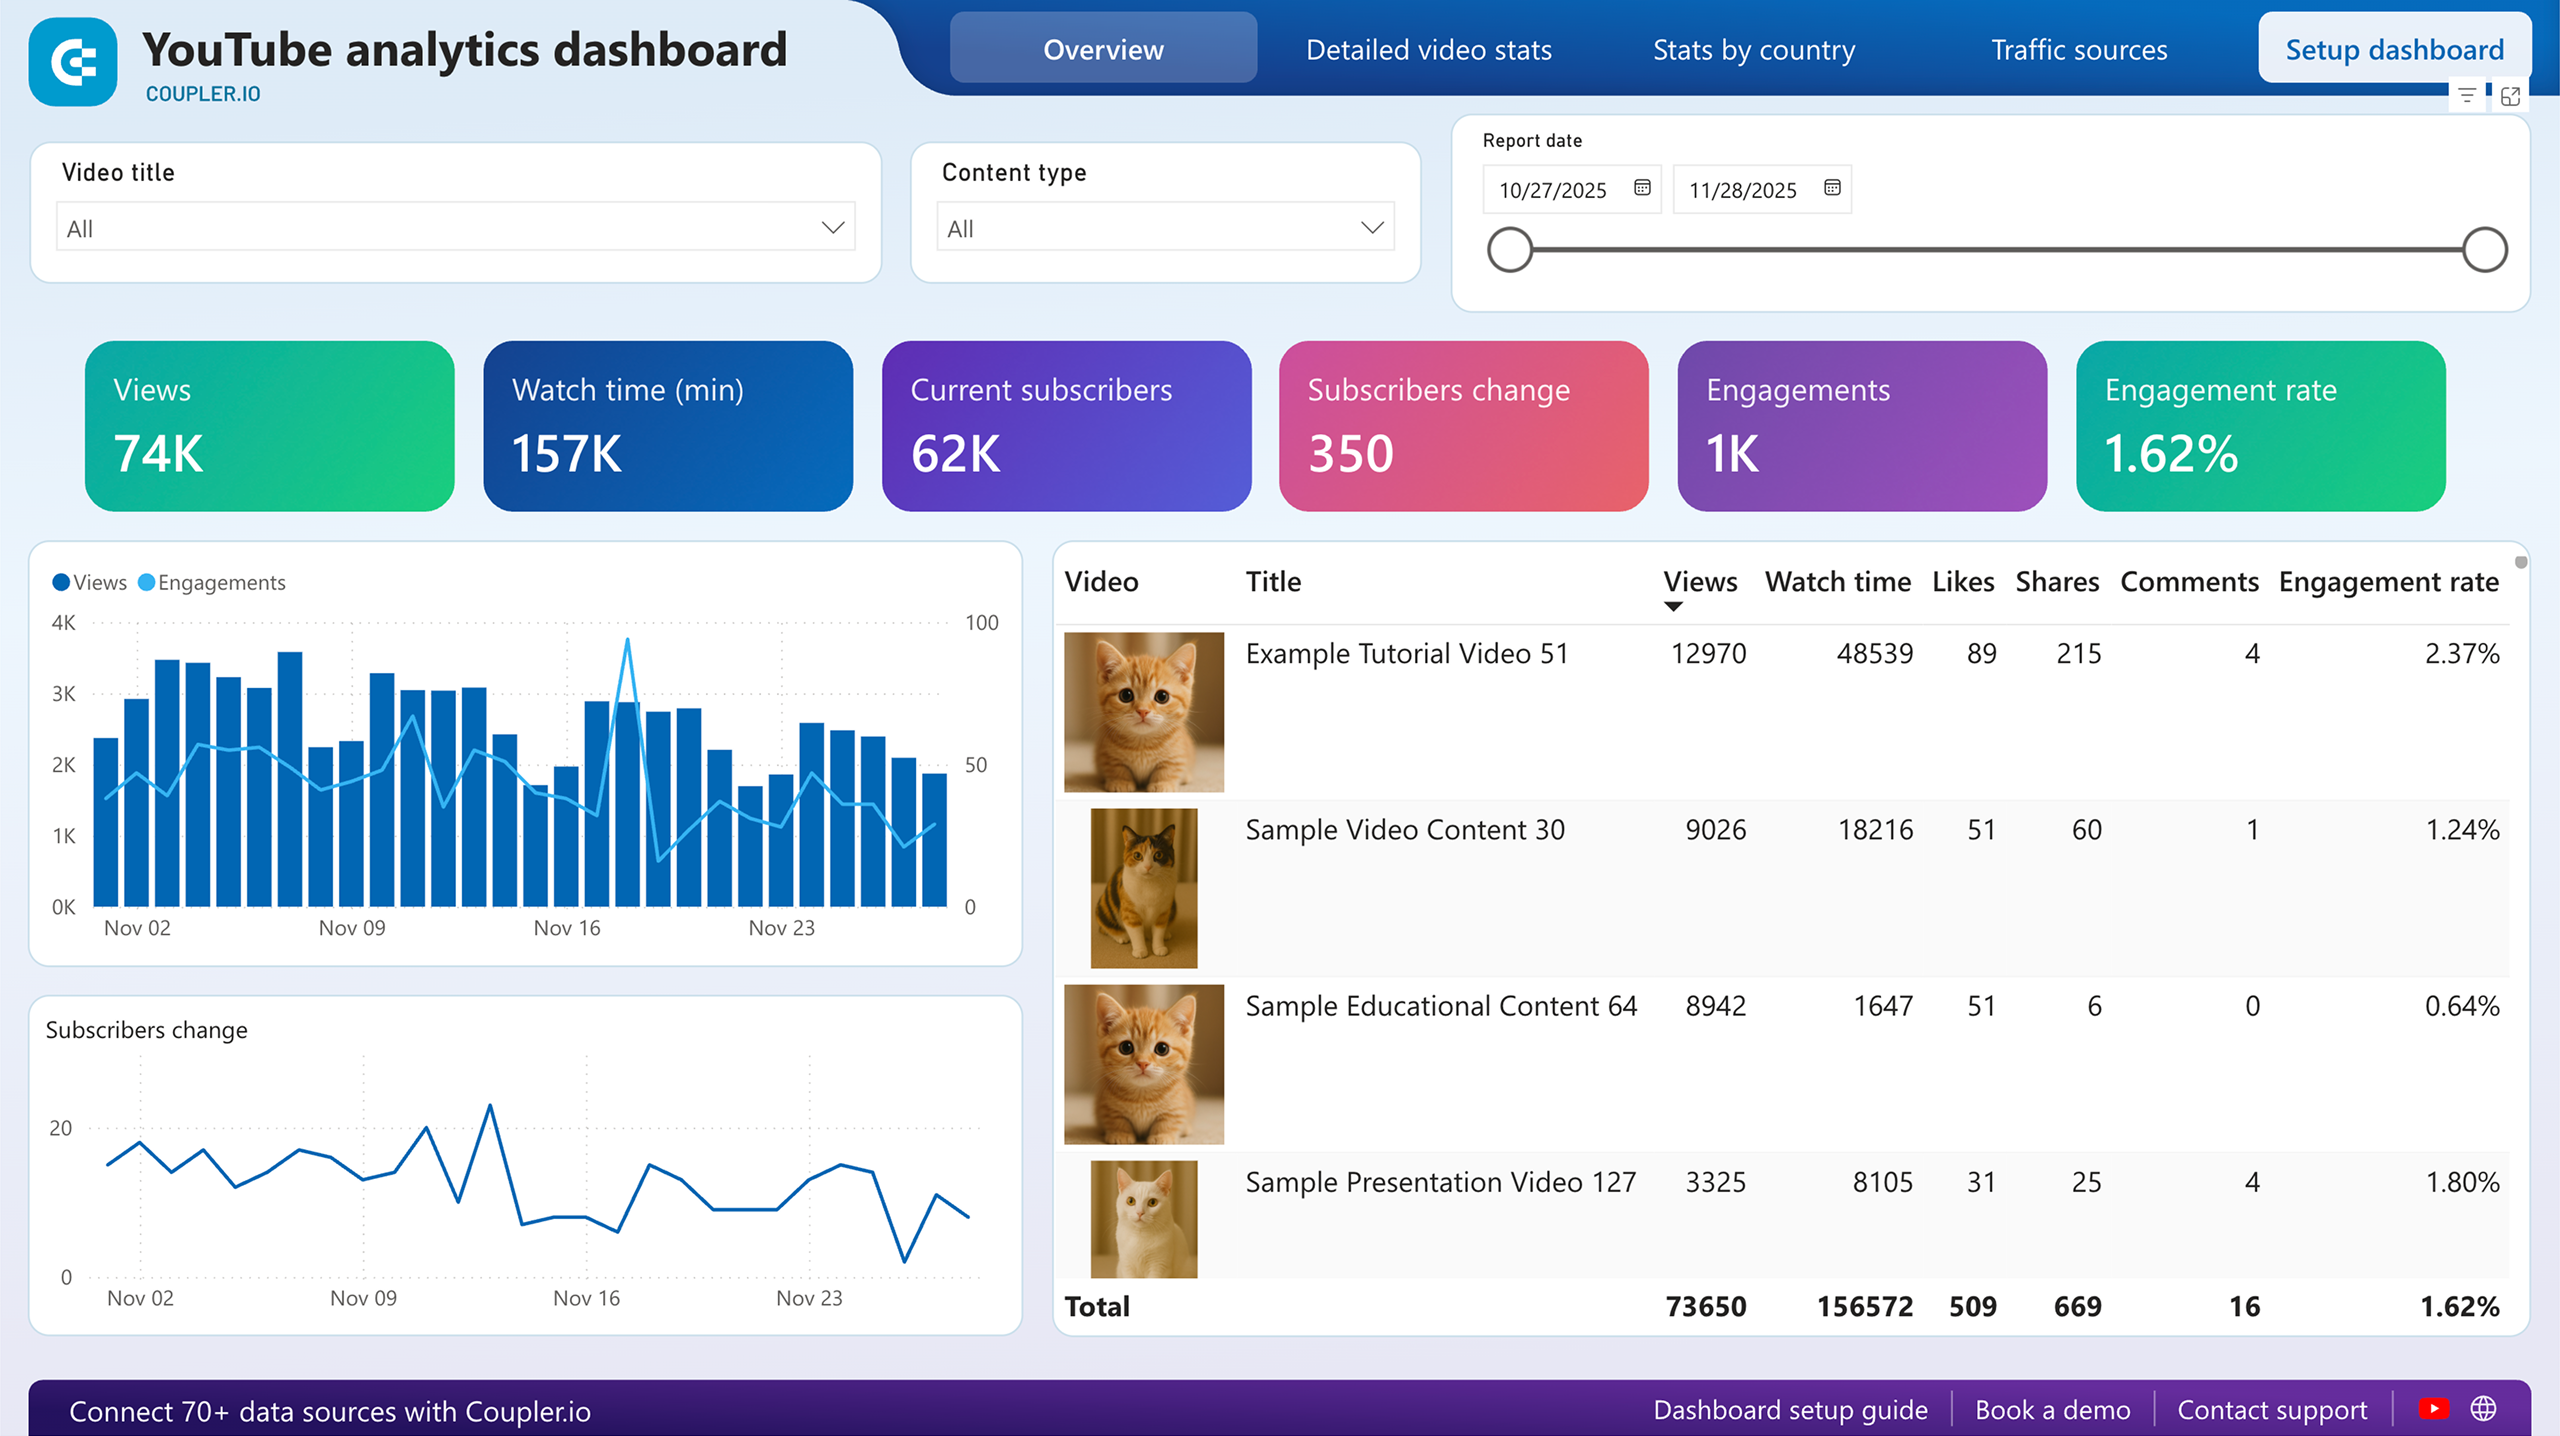
Connect YouTube analytics to Power BI with Coupler.io to simplify reporting
Get and prepare data effortlessly
Coupler.io makes it easy to export YouTube analytics to Power BI without the need for coding. You can modify your data in numerous ways, fine-tune schedules for an automatic refresh, and generate reports based on information from multiple sources.
Automate reporting tasks
Say goodbye to tedious manual reporting with Coupler.io, which allows you to automate data imports from YouTube analytics to Power BI. Moreover, our free templates let you turn your data into visually appealing, informative, and self-updating dashboards.
Stand out as a data-driven expert
Inspire clients' and stakeholders' confidence in you as an expert – deliver near-real-time reports that provide the most recent YouTube analytics data. Let Coupler.io handle data import and reporting so you can prioritize strategic, forward-looking responsibilities.
How to connect YouTube analytics to Power BI (detailed guide)
Connect YouTube analytics to Power BI by following three simple steps:
Step 1: Collect data
First, connect your YouTube account. Next, specify the channel you wish to export data from, the reporting period, and the metrics required.
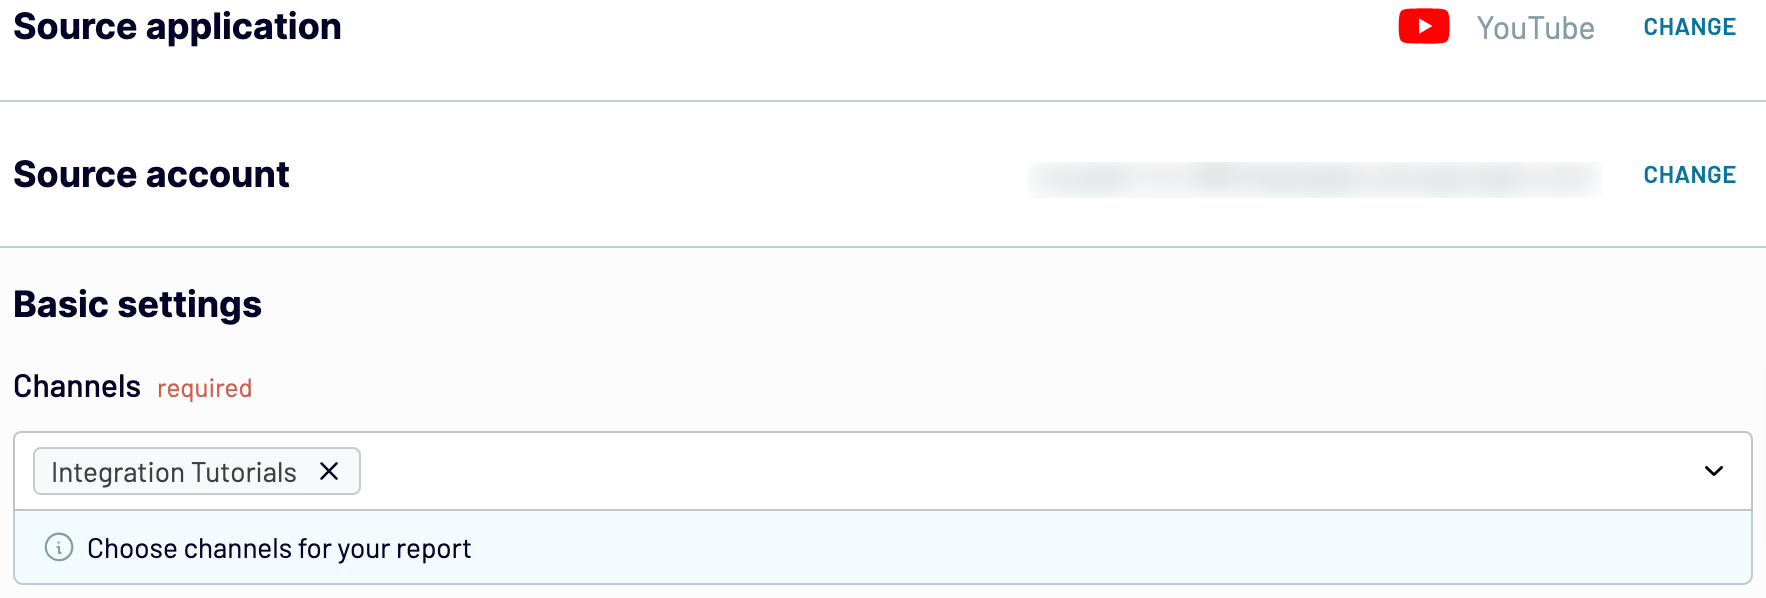
After that, proceed to the next step.
Step 2: Organize and transform
Before you load YouTube analytics to Power BI, preview your data to confirm that it's accurate. If some transformations are needed, here's what you can do:
When you finish that, go next to configure the destination settings.
Step 3: Load and automate
To finish data import from YouTube analytics to Power BI, follow the in-app instructions to generate the integration URL and paste it into the Power BI desktop application.
Afterward, activate automatic data updates and choose the interval that suits you. Lastly, save and run the importer.
Step 1: Collect data
First, connect your YouTube account. Next, specify the channel you wish to export data from, the reporting period, and the metrics required.
After that, proceed to the next step.
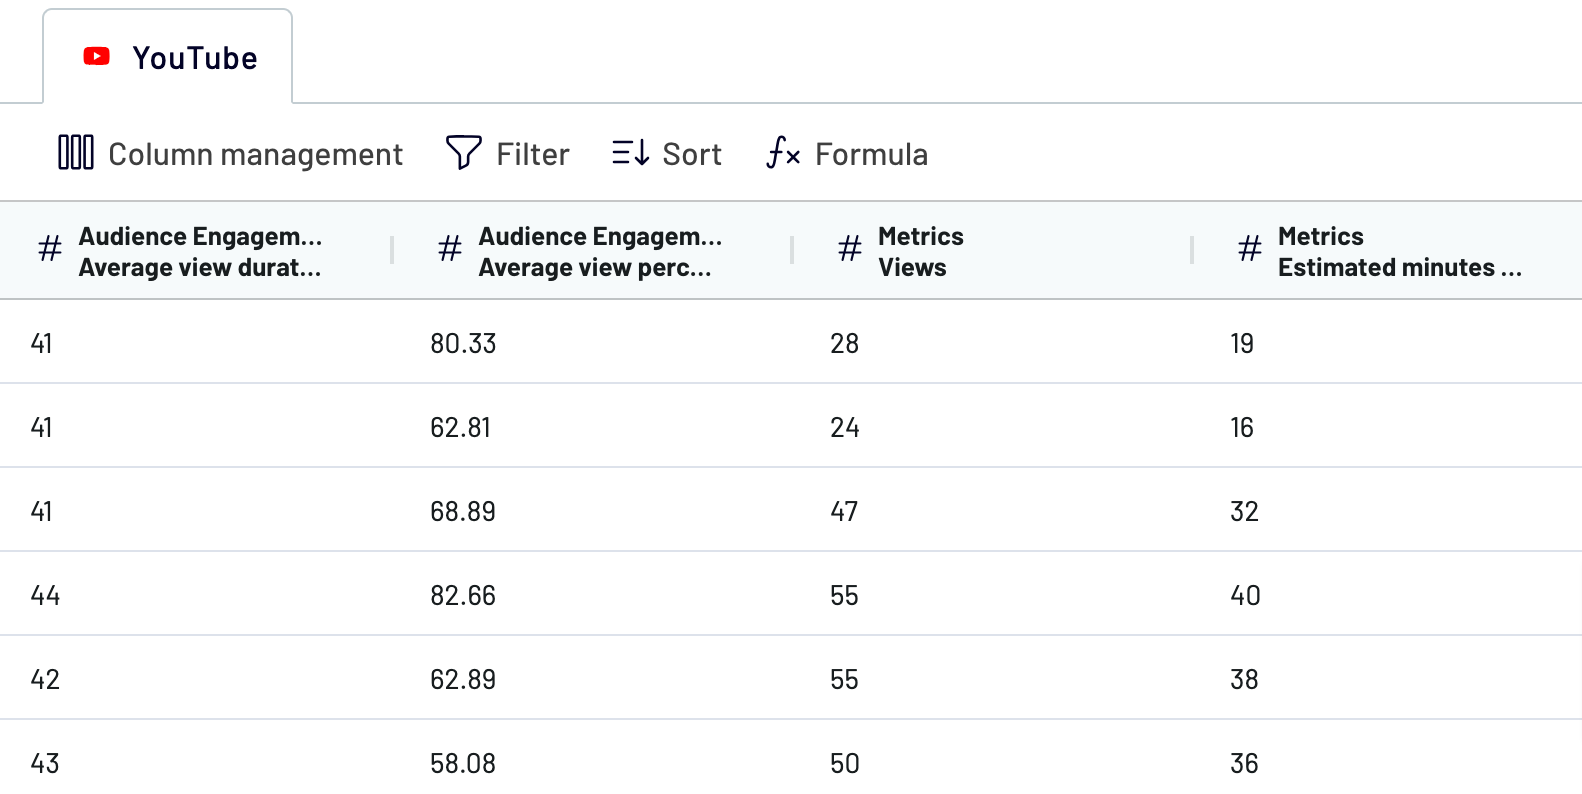
Step 2: Organize and transform
Before you load YouTube analytics to Power BI, preview your data to confirm that it's accurate. If some transformations are needed, here's what you can do:
- Edit, rearrange, hide, or add columns.
- Apply various filters and sort your data.
- Create new columns with custom formulas.
- Combine data from multiple accounts or apps.
When you finish that, go next to configure the destination settings.
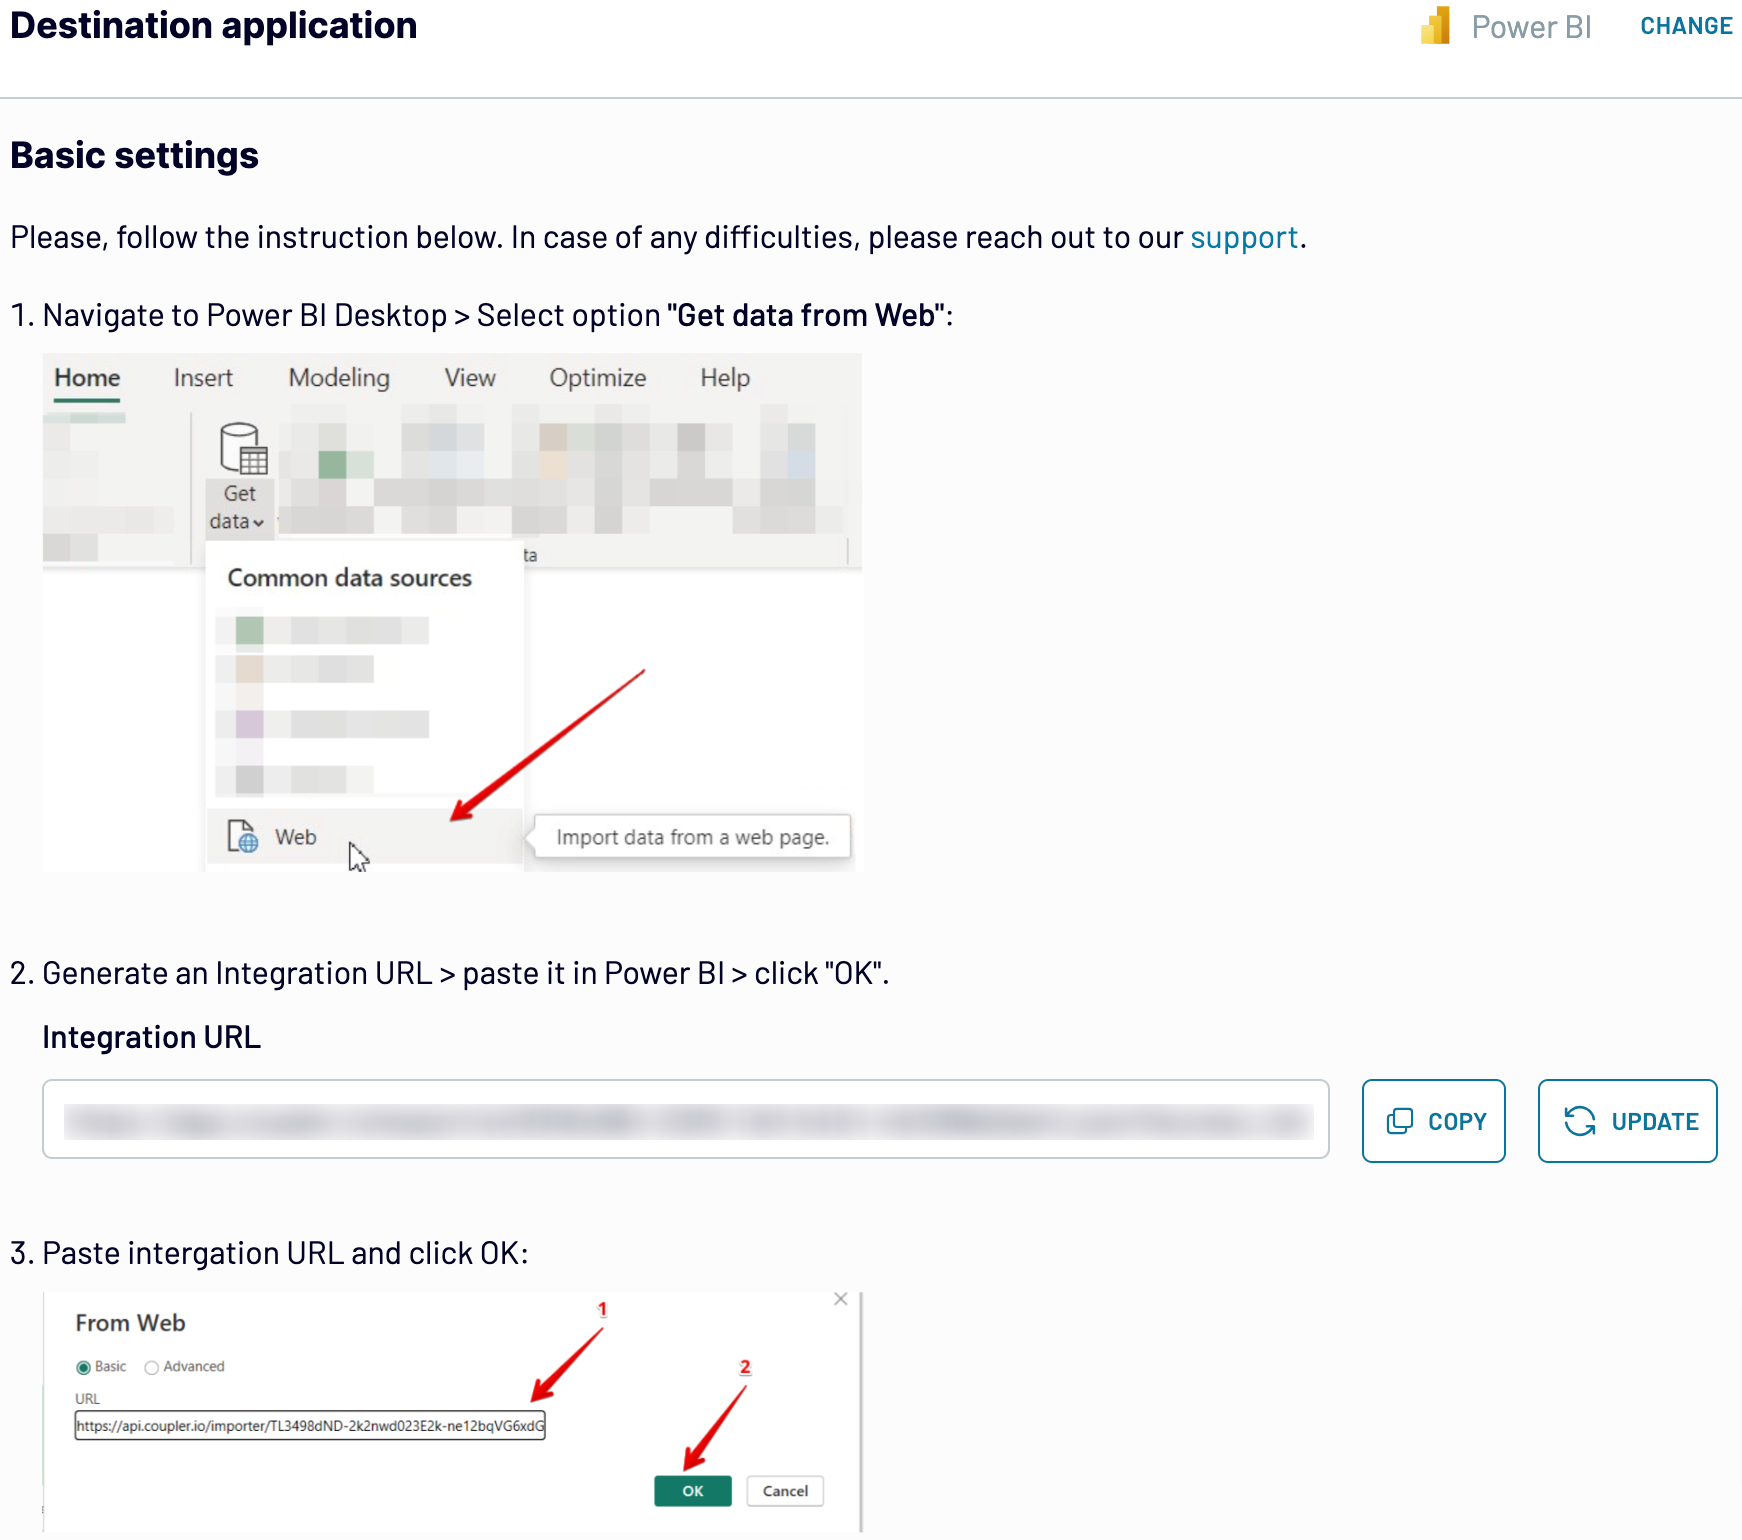
Step 3: Load and automate
To finish data import from YouTube analytics to Power BI, follow the in-app instructions to generate the integration URL and paste it into the Power BI desktop application.
Afterward, activate automatic data updates and choose the interval that suits you. Lastly, save and run the importer.
Export YouTube analytics to Power BI and schedule this process
Turn on automated refresh to ensure your imported data stays time-relevant. The main thing to do is to select how often you want updates – choices range from monthly to even every 30 or 15 minutes. To customize your data refresh even more, specify days, times, and your preferred time zone.
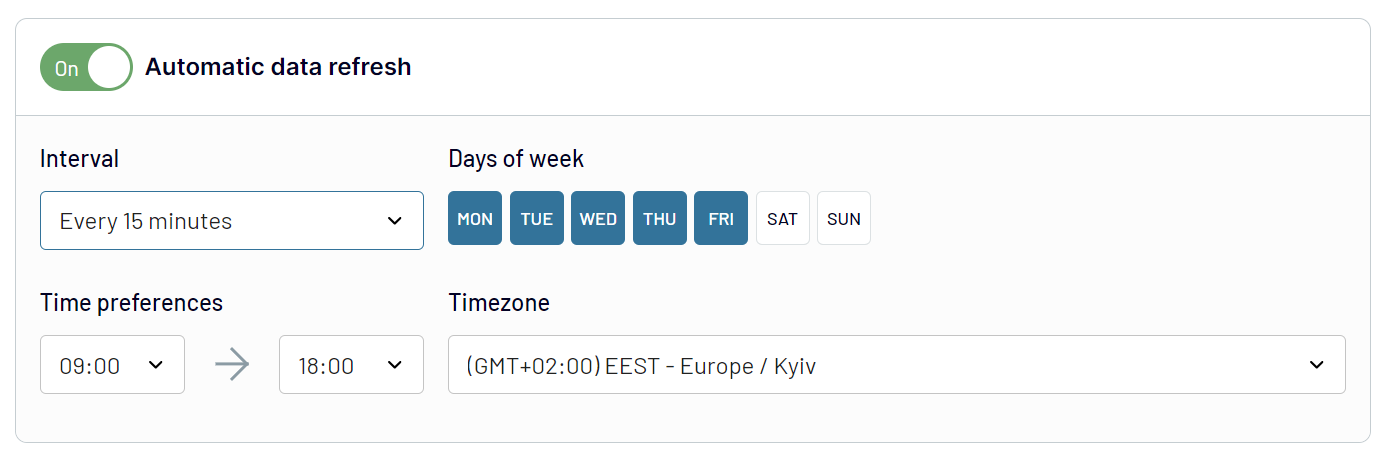
This Coupler.io functionality allows your report to stay consistently aligned with the ever-changing source data.
This Coupler.io functionality allows your report to stay consistently aligned with the ever-changing source data.
Export data from YouTube to alternative destinations


Quick start with Marketing dashboard templates


No such template is available yet.
No worries. Our team will create a template that fits your needs, just tell us more
about your case. It doesn't cost you a penny 😉
Request a custom report
about your case. It doesn't cost you a penny 😉
Export YouTube analytics to Power BI automatically with just a few clicks.
Connect similar Marketing apps and get data in minutes


What to export from YouTube analytics to Power BI

Channel Performance
Export this report from YouTube analytics to explore channel growth and audience demographics. It tracks metrics such as views, watch time, subscriber growth, and audience retention. By understanding these insights, you can refine content strategies, identify popular formats, and optimize publishing schedules. This fosters viewer engagement and subscriber retention.
Video Performance
You can also connect YouTube analytics to Power BI to load the video performance report. Here, you get detailed metrics on video views, likes, dislikes, comments, and shares. Analyze them to identify top-performing videos, understand viewer preferences, and optimize content and metadata for better discoverability and engagement. So you can improve content relevance and viewer interaction.
Audience Demographics
This data is about age, gender, geographic location, and device type used to watch videos. If you understand these details, you can tailor content to specific viewer segments, optimize advertising targeting, and craft personalized marketing strategies. Demographic data analysis helps enhance viewer engagement, increase subscriber loyalty, and reach the target audience with relevant content and campaigns.
Playback Locations
Examine metrics such as views by embedded players, YouTube watch page views, and views from external websites. Use this knowledge to optimize distribution strategies, evaluate the impact of embedded videos, and identify high-traffic sources for viewer acquisition. This way, it'll be easier to maximize reach, optimize content distribution channels, and improve overall video performance.
Traffic Sources Report
Receive data on how viewers discover videos, including metrics on views from YouTube searches, suggested videos, external websites, and YouTube advertising campaigns. This way, you can understand viewer acquisition channels, optimize SEO and advertising strategies, and identify effective promotion channels for video content. As a result, it will help you increase video discoverability and attract more organic traffic.
Revenue
Export YouTube analytics to Power BI to look at monetization performance. This report includes metrics such as estimated revenue, ad revenue, transaction revenue, and revenue sources. Track earnings, optimize monetization strategies, and understand the financial impact of different content types and viewer behaviors. Using this data, you can optimize ad placements and develop content that resonates with viewers.
Playlists Performance
The playlist performance report includes metrics such as playlist views, watch time, average view duration, and playlist engagement. Identify popular sequences, optimize playlist organization, and improve viewer retention through curated content experiences. It's useful if you aim to boost viewer satisfaction, increase video consumption, and drive longer sessions on your channel.
Device Report
Import data from YouTube analytics to Power BI to see how viewers access and watch videos across different devices, such as desktops, mobile devices, tablets, and connected TVs. Optimize video formatting, user interface design, and ad placement for different viewing experiences. If you have a clear idea of device preferences, you can tailor content delivery and enhance user experience across platforms.
How do you connect YouTube analytics to Power BI?
Step 1. Connect your YouTube account and choose the channel you'd like to export data from
Step 2. Organize and transform data before loading it into Power BI
Step 3. Connect the Power BI account and copy the integration URL to the desktop app
Step 4. Schedule auto-refreshes to export YouTube analytics to Power BI at desired intervals
Pricing plans
- Monthly
- Annual (save 25%)
Your data is secured by industry standards
 Google Cloud
Certified
 SOC 2 Type II
Certified
 GDPR
GDPRCompliant
 HIPAA
HIPAACompliant
Don’t just take our word for it


