Instagram Insights to Power BI Integration
Automate exports of Instagram Insights to Power BI with Coupler.io which requires no coding or API research. Organize and transform data on the go to turn it into impactful dashboards that will let you make smart decisions.


Export Instagram Insights to Power BI with Coupler.io to simplify reporting
Get and prepare data effortlessly
Load Instagram Insights to Power BI and organize your data for analysis without coding. Use the Coupler.io connector to prepare your data in the form of dynamic reports or dashboards. Join data from Instagram with information from other sources in one intuitive interface.
Automate reporting tasks
Automate your reporting by scheduling data refresh from Instagram Insights to Power BI with a few clicks. Eliminate manual data entry and copy-pasting. Create comprehensive multi-channel reports or start with Coupler.io's ready-to-use dashboard templates.
Stand out as a data-driven expert
Elevate your decision-making with self-updating dashboards by integrating Instagram Insights to Power BI. Gain better insights from data analysis and save time for more valuable tasks. Create superior reports that impress clients and stakeholders.
How to integrate Instagram Insights to Power BI (detailed guide)
Coupler.io lets you turn raw data from your data source into actionable reports and dashboards. Setting up a data integration and automating data refresh only takes a couple of minutes. Follow these three steps to integrate Instagram Insights to Power BI.
Step 1: Collect data
Begin by connecting your Instagram account. This process involves authorizing Coupler.io to access your Instagram data. Once connected, you will select the data type you wish to export. This can include different reports on Comments, Profiles, and Stories.
You can also specify the time frame for the data you want to export. This ensures you collect the most relevant and up-to-date information for your reporting needs.
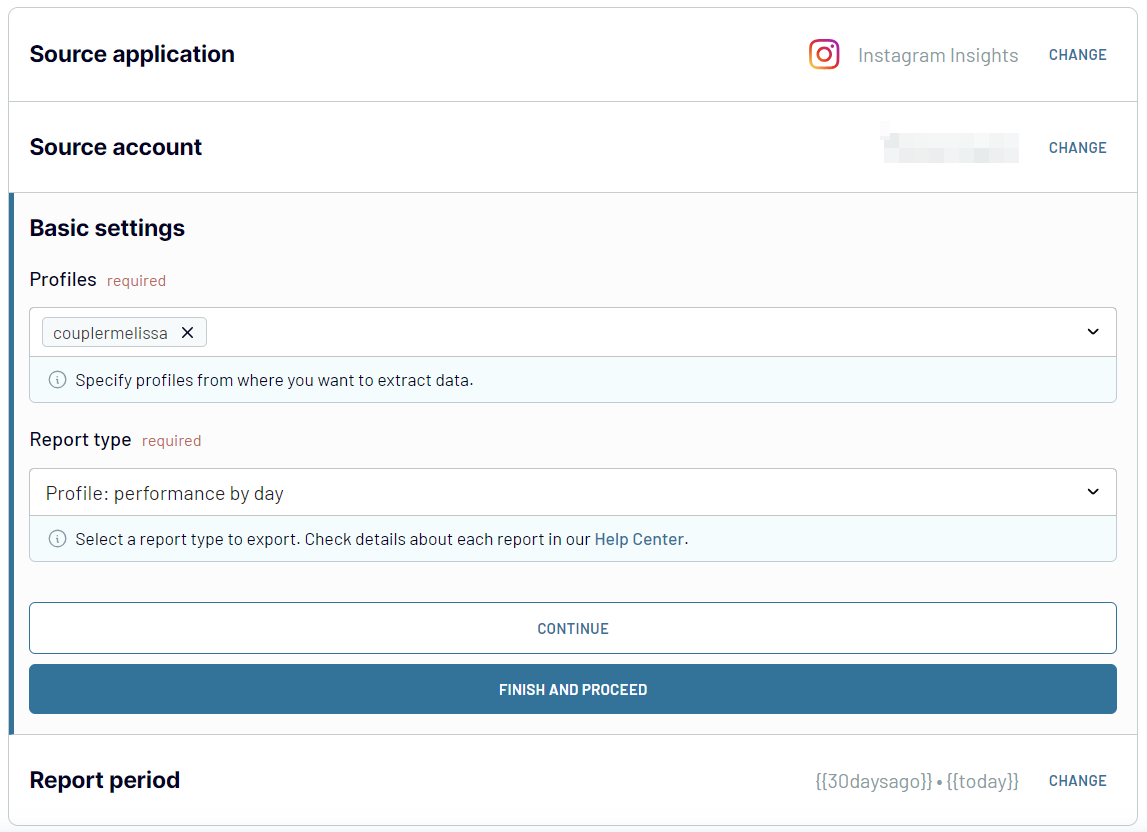
Once you have selected the report and its period, proceed to the next step.
Step 2: Organize and transform
This step involves organizing and refining your data before it is imported into Power BI. Coupler.io offers the following options to transform your data:
Step 3: Load and automate
The final step involves loading the organized report to Power BI. Follow these in-app instructions:
After loading the data, you can automate this process by setting up a refresh schedule. This feature allows you to keep your Power BI reports up-to-date. Coupler.io does not refresh data in real-time but you can configure the refresh interval every day, every hour, every 30, or even 15 minutes.
The workflow automation saves valuable time and ensures your data is always ready for analysis. This allows you to focus on deriving insights and making data-driven decisions.
Step 1: Collect data
Begin by connecting your Instagram account. This process involves authorizing Coupler.io to access your Instagram data. Once connected, you will select the data type you wish to export. This can include different reports on Comments, Profiles, and Stories.
You can also specify the time frame for the data you want to export. This ensures you collect the most relevant and up-to-date information for your reporting needs.
Once you have selected the report and its period, proceed to the next step.
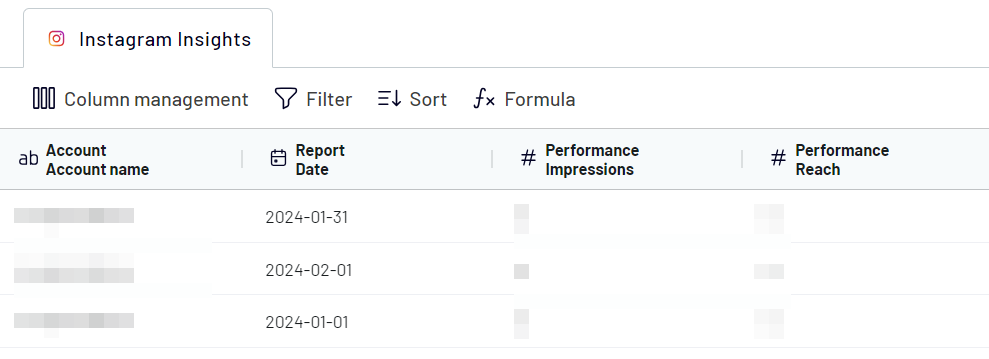
Step 2: Organize and transform
This step involves organizing and refining your data before it is imported into Power BI. Coupler.io offers the following options to transform your data:
- Preview Your Collected Data: Before making any changes, you can preview the data to understand its structure and content.
- Apply Filters: Use filters to hone in on specific information, allowing you to focus on the most relevant data points.
- Sort Data: Organize the data by sorting it in ascending or descending order.
- Rename Columns: Adjust the column names to make them more intuitive and relevant to your analysis.
- Reorder Columns: Change the sequence of columns to match your reporting layout better.
- Add Custom Columns: Create new columns using custom formulas to derive additional insights from your data.
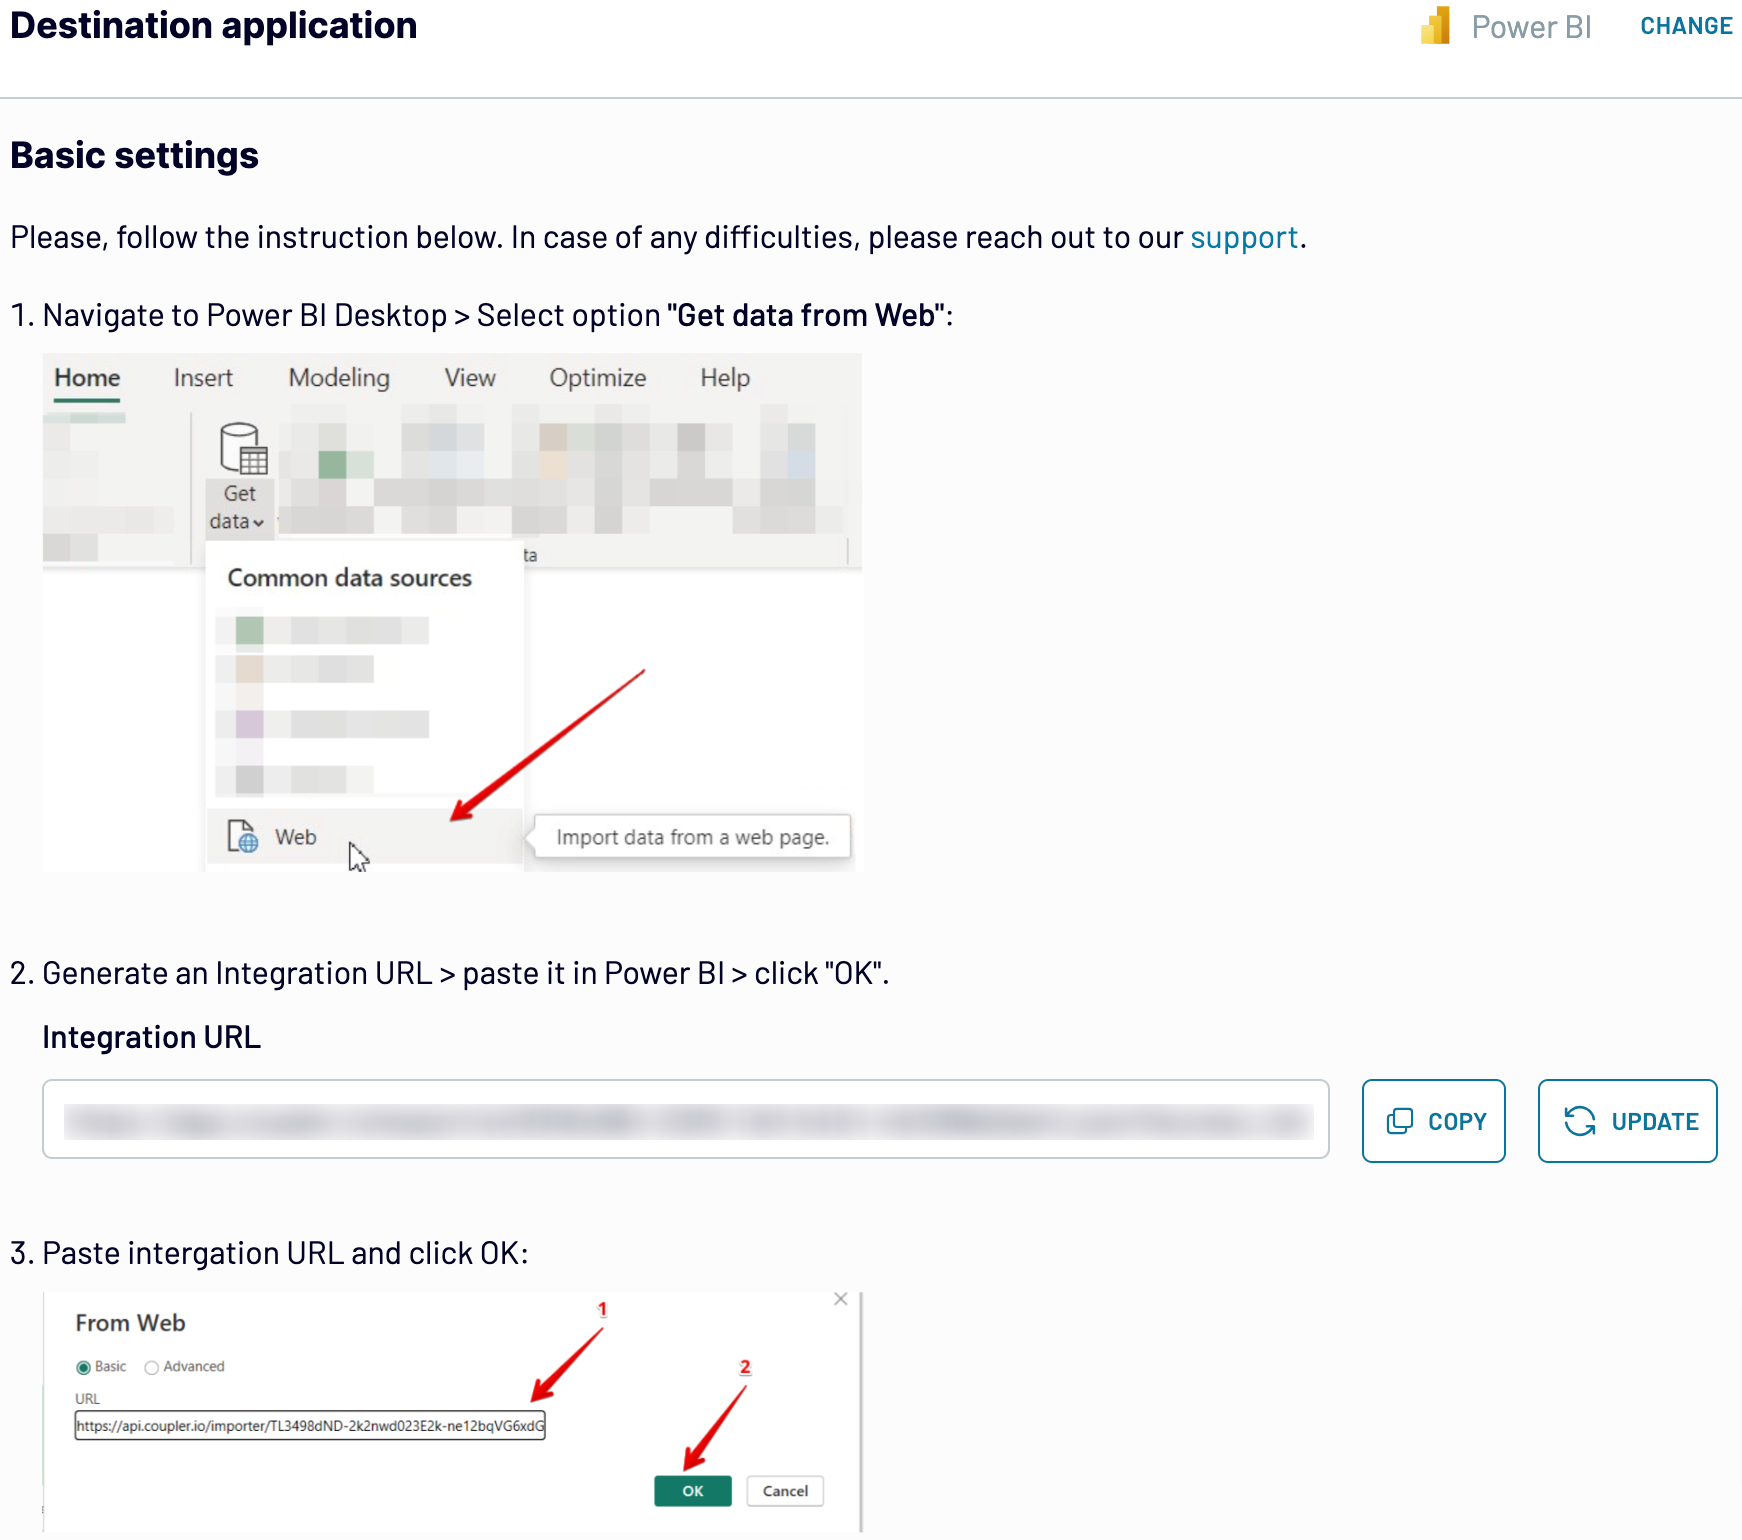
Step 3: Load and automate
The final step involves loading the organized report to Power BI. Follow these in-app instructions:
- Generate the integration URL.
- Copy it and paste it into the Power BI desktop app.
- Load data to the Power BI dataset
After loading the data, you can automate this process by setting up a refresh schedule. This feature allows you to keep your Power BI reports up-to-date. Coupler.io does not refresh data in real-time but you can configure the refresh interval every day, every hour, every 30, or even 15 minutes.
The workflow automation saves valuable time and ensures your data is always ready for analysis. This allows you to focus on deriving insights and making data-driven decisions.
Export data from Instagram Insights to alternative destinations


Quick start with Social Media dashboard templates
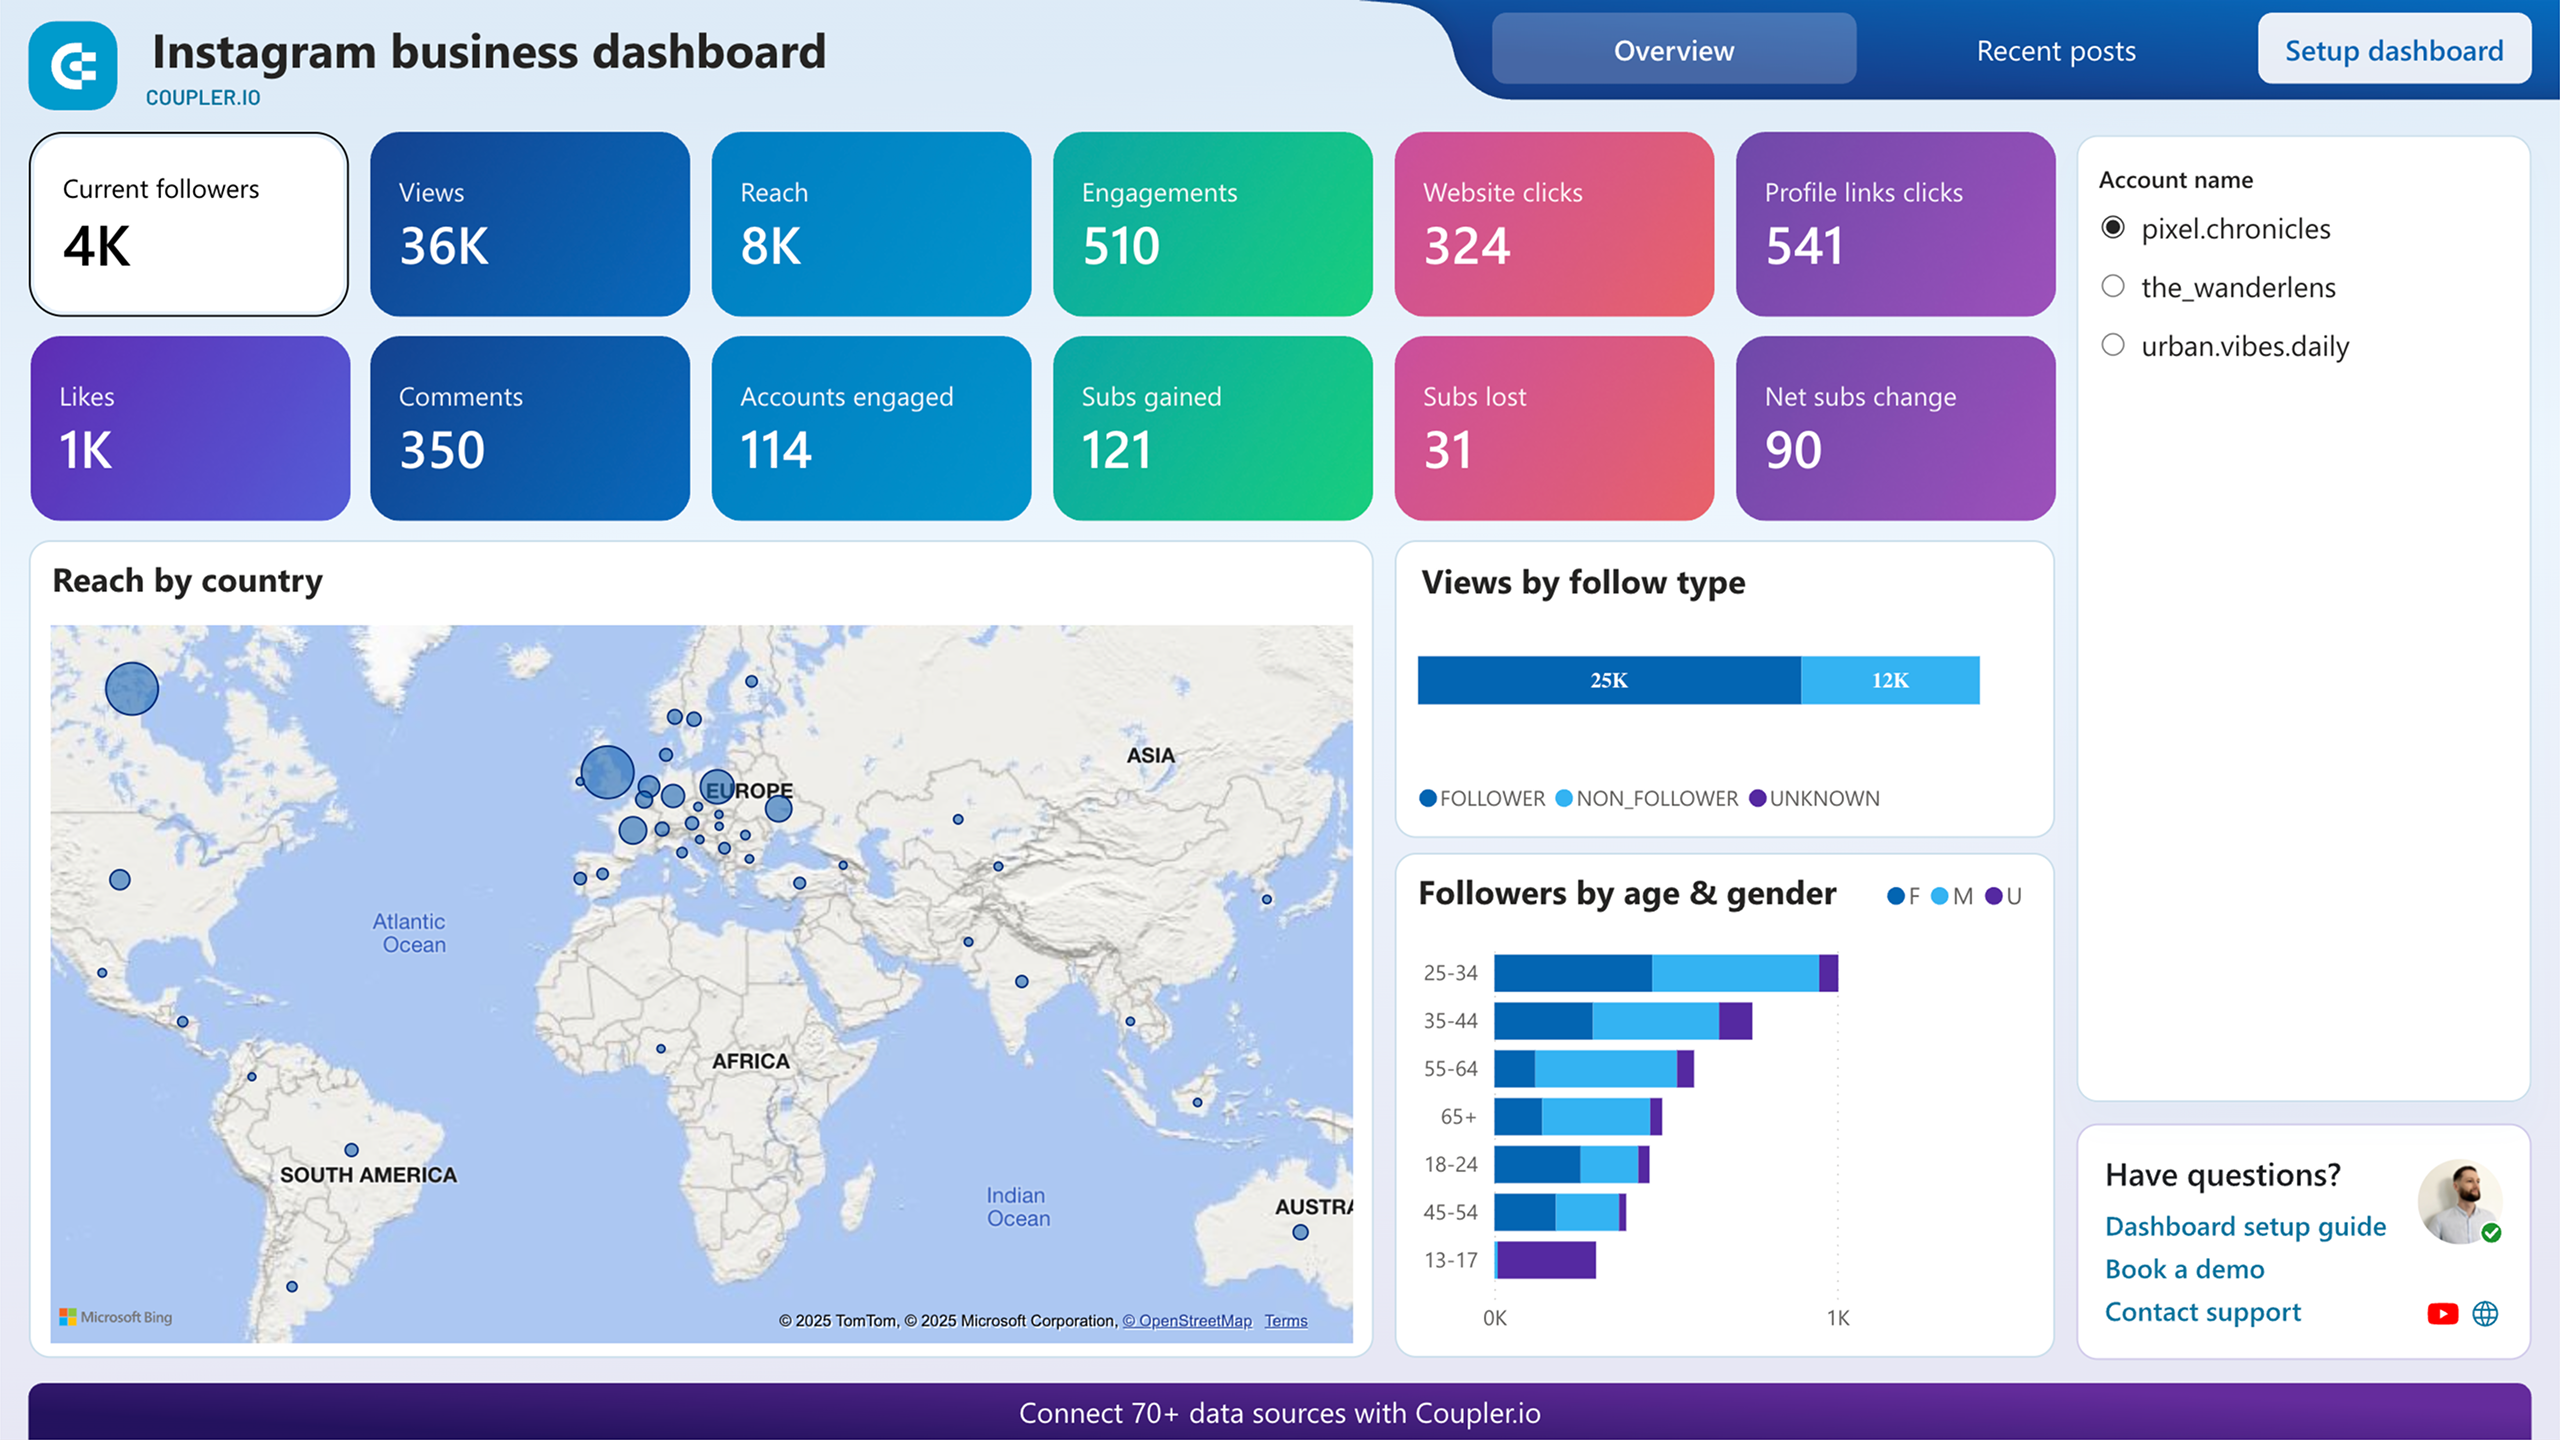


No such template is available yet.
No worries. Our team will create a template that fits your needs, just tell us more
about your case. It doesn't cost you a penny 😉
Request a custom report
about your case. It doesn't cost you a penny 😉
Integrate Instagram Insights to Power BI automatically with just a few clicks.
Connect similar Social Media apps and get data in minutes


What to export from Instagram Insights to Power BI

Post: comment details review
Analyze detailed insights on user comments, including volume, sentiment, and engagement patterns. This report provides an overview of how your audience interacts with your Instagram posts through comments. It helps you understand user feedback and tailor your content strategy to enhance engagement.
Post: profile interactions breakdown
Gain a detailed understanding of user interactions with your profile. This report breaks down actions such as likes, comments, shares, and saves. It offers insights into how users engage with your profile. Use this data to optimize your profile's performance and improve user engagement.
Story: performance totals (Last 24 hours)
Monitor the total performance of your Instagram Stories within the last 24 hours. This report includes metrics such as views, replies, and engagements. It provides a snapshot of your Stories' effectiveness. Use this information to refine your Stories strategy and maximize viewer engagement.
Story: navigation by action type (last 24 hours)
Track how users navigate through your Stories over the past 24 hours. This report categorizes actions such as forwards, backward, exits, and skips. It helps you understand viewer behavior and identify the most engaging content. Use these insights to improve your Stories' flow and viewer retention.
Story: profile interactions breakdown (last 24 hours)
Examine detailed interactions with your profile through Stories over the last 24 hours. This report includes metrics on taps, replies, and other engagements. It offers a granular view of how users interact with your profile via Stories. Optimize your Stories' content based on these interactions.
Profile: performance totals
Review the overall performance of your Instagram profile. This includes key metrics such as follower growth, engagement rates, and reach. The report enables you to assess the effectiveness of your social media strategy and make informed decisions.
Profile: performance by media type
Understand how different types of media perform on your profile. This report breaks down performance metrics by media type, including photos, videos, and carousels. These insights allow you to identify which formats resonate most with your audience. As a result, you can optimize your content mix accordingly.
Profile: performance by follow type
Analyze your profile's performance based on different follower types. This report provides insights into how various follower segments engage with your content. Based on this insight, you can tailor your strategy to different audience groups for better engagement.
Profile: links taps by contact button type
Track the effectiveness of contact buttons on your profile, such as email, phone, and address. This report details the number of taps each button receives. It provides insights into how users prefer to connect with your business. Use this information to optimize your contact options and enhance user accessibility.
Profile: reach by media product type and follow type
Measure the reach of your profile based on media product type and follower type. This report offers a breakdown of how different content types perform across various audience segments. It helps you identify the most effective content strategies for maximizing reach and engagement.
Profile: new audience demography insights
Gain insights into the demographic characteristics of your new followers. This report includes data on age, gender, location, and other demographic factors. With this insight, you can better understand your new audience and tailor your content to meet their preferences and needs.
How do you connect Instagram Insights to Power BI?
Step 1. Connect your Instagram account and choose the type of report you'd like to export data
Step 2. Organize and transform data before loading it into Power BI
Step 3. Generate and copy the integration URL to the Power BI desktop app
Step 4. Schedule automated refreshes to run the Instagram Insights to Power BI integration at desired intervals
Pricing plans
- Monthly
- Annual (save 25%)
Your data is secured by industry standards
 Google Cloud
Certified
 SOC 2 Type II
Certified
 GDPR
GDPRCompliant
 HIPAA
HIPAACompliant
Don’t just take our word for it


Dramatically improved our reporting speed by about 60%. The interface is user-friendly, even for team members with no technical background.
Helped solve data processing issues, and customer service is 10/10. It is extremely easy to use, and allows us to extract data from multiple sources.