Export Braze to Excel
Connect Braze to Excel with Coupler.io for hands-on engagement data analysis. Build pivot tables, apply conditional formatting, and create formula-driven reports from your messaging campaigns, canvas journeys, and audience segments using Excel's familiar analytical toolkit.


What data you can export from Braze
-
CampaignsList of messaging campaigns with names, channels, and configuration details for building organized performance tracking workbooks and campaign inventory reports in Excel.
-
Campaigns analyticsDelivery and engagement metrics per campaign including sends, opens, clicks, and conversions for pivot-table-driven comparison and trend analysis across messaging initiatives.
-
Campaigns detailsGranular campaign configuration data covering audience targeting, scheduling, and variant setups for detailed A/B test evaluation and campaign structure audits in Excel.
-
EventsUser interaction records capturing behavioral signals and custom actions for event-frequency analysis, funnel mapping, and user activity tracking using Excel formulas.
-
Events analyticsAggregated event metrics summarizing interaction volumes and patterns over time for trend identification, peak activity analysis, and behavioral reporting in Excel.
-
CanvasesJourney orchestration records listing multi-step messaging flows with branching logic for mapping customer paths and documenting automation workflows in spreadsheet format.
-
Canvases analyticsStep-level performance data from canvas journeys showing progression rates, drop-offs, and message effectiveness for journey optimization analysis using Excel charts.
-
SegmentsAudience group definitions with membership criteria and population sizes for maintaining a centralized segment reference and tracking audience development over time.
-
Segments analyticsSegment growth and engagement metrics showing how audience groups evolve and respond to messaging for population trend monitoring and targeting effectiveness reviews.
-
Kpi daily active usersDay-by-day active user counts providing a baseline engagement metric for tracking platform health, calculating retention benchmarks, and building usage trend reports.
All-in-one tool for Braze data exports and analytics
Pull campaign metrics, event logs, and segment data from Braze, then combine them with records from your CRM, ad platforms, or product analytics tools to build unified Excel workbooks for cross-channel marketing analysis.

Shape Braze exports into structured Excel layouts with clean headers, consistent data types, and pivot-ready formatting so you can start analyzing campaign performance and user behavior without manual cleanup.

Keep your Excel reports aligned with the latest Braze activity through automated updates. Run reports at 15-minute, 30-minute, hourly, daily, or monthly intervals — no repeated manual exports needed.

Go beyond spreadsheets with Coupler.io AI integrations. Route your Braze data to AI tools and ask plain-language questions about campaign outcomes, user trends, and segment behavior to surface insights faster.

Why export Braze to Excel - real life cases

Campaign performance benchmarking

User lifecycle and retention analysis

Segment health monitoring

Cross-channel messaging audit
How to export Braze to Excel
 30 seconds
30 seconds
10 seconds
30 seconds
30 seconds
30 seconds
10 seconds
Automate data exports with the no-code Braze Excel integration
Connect similar Email apps and get data in minutes





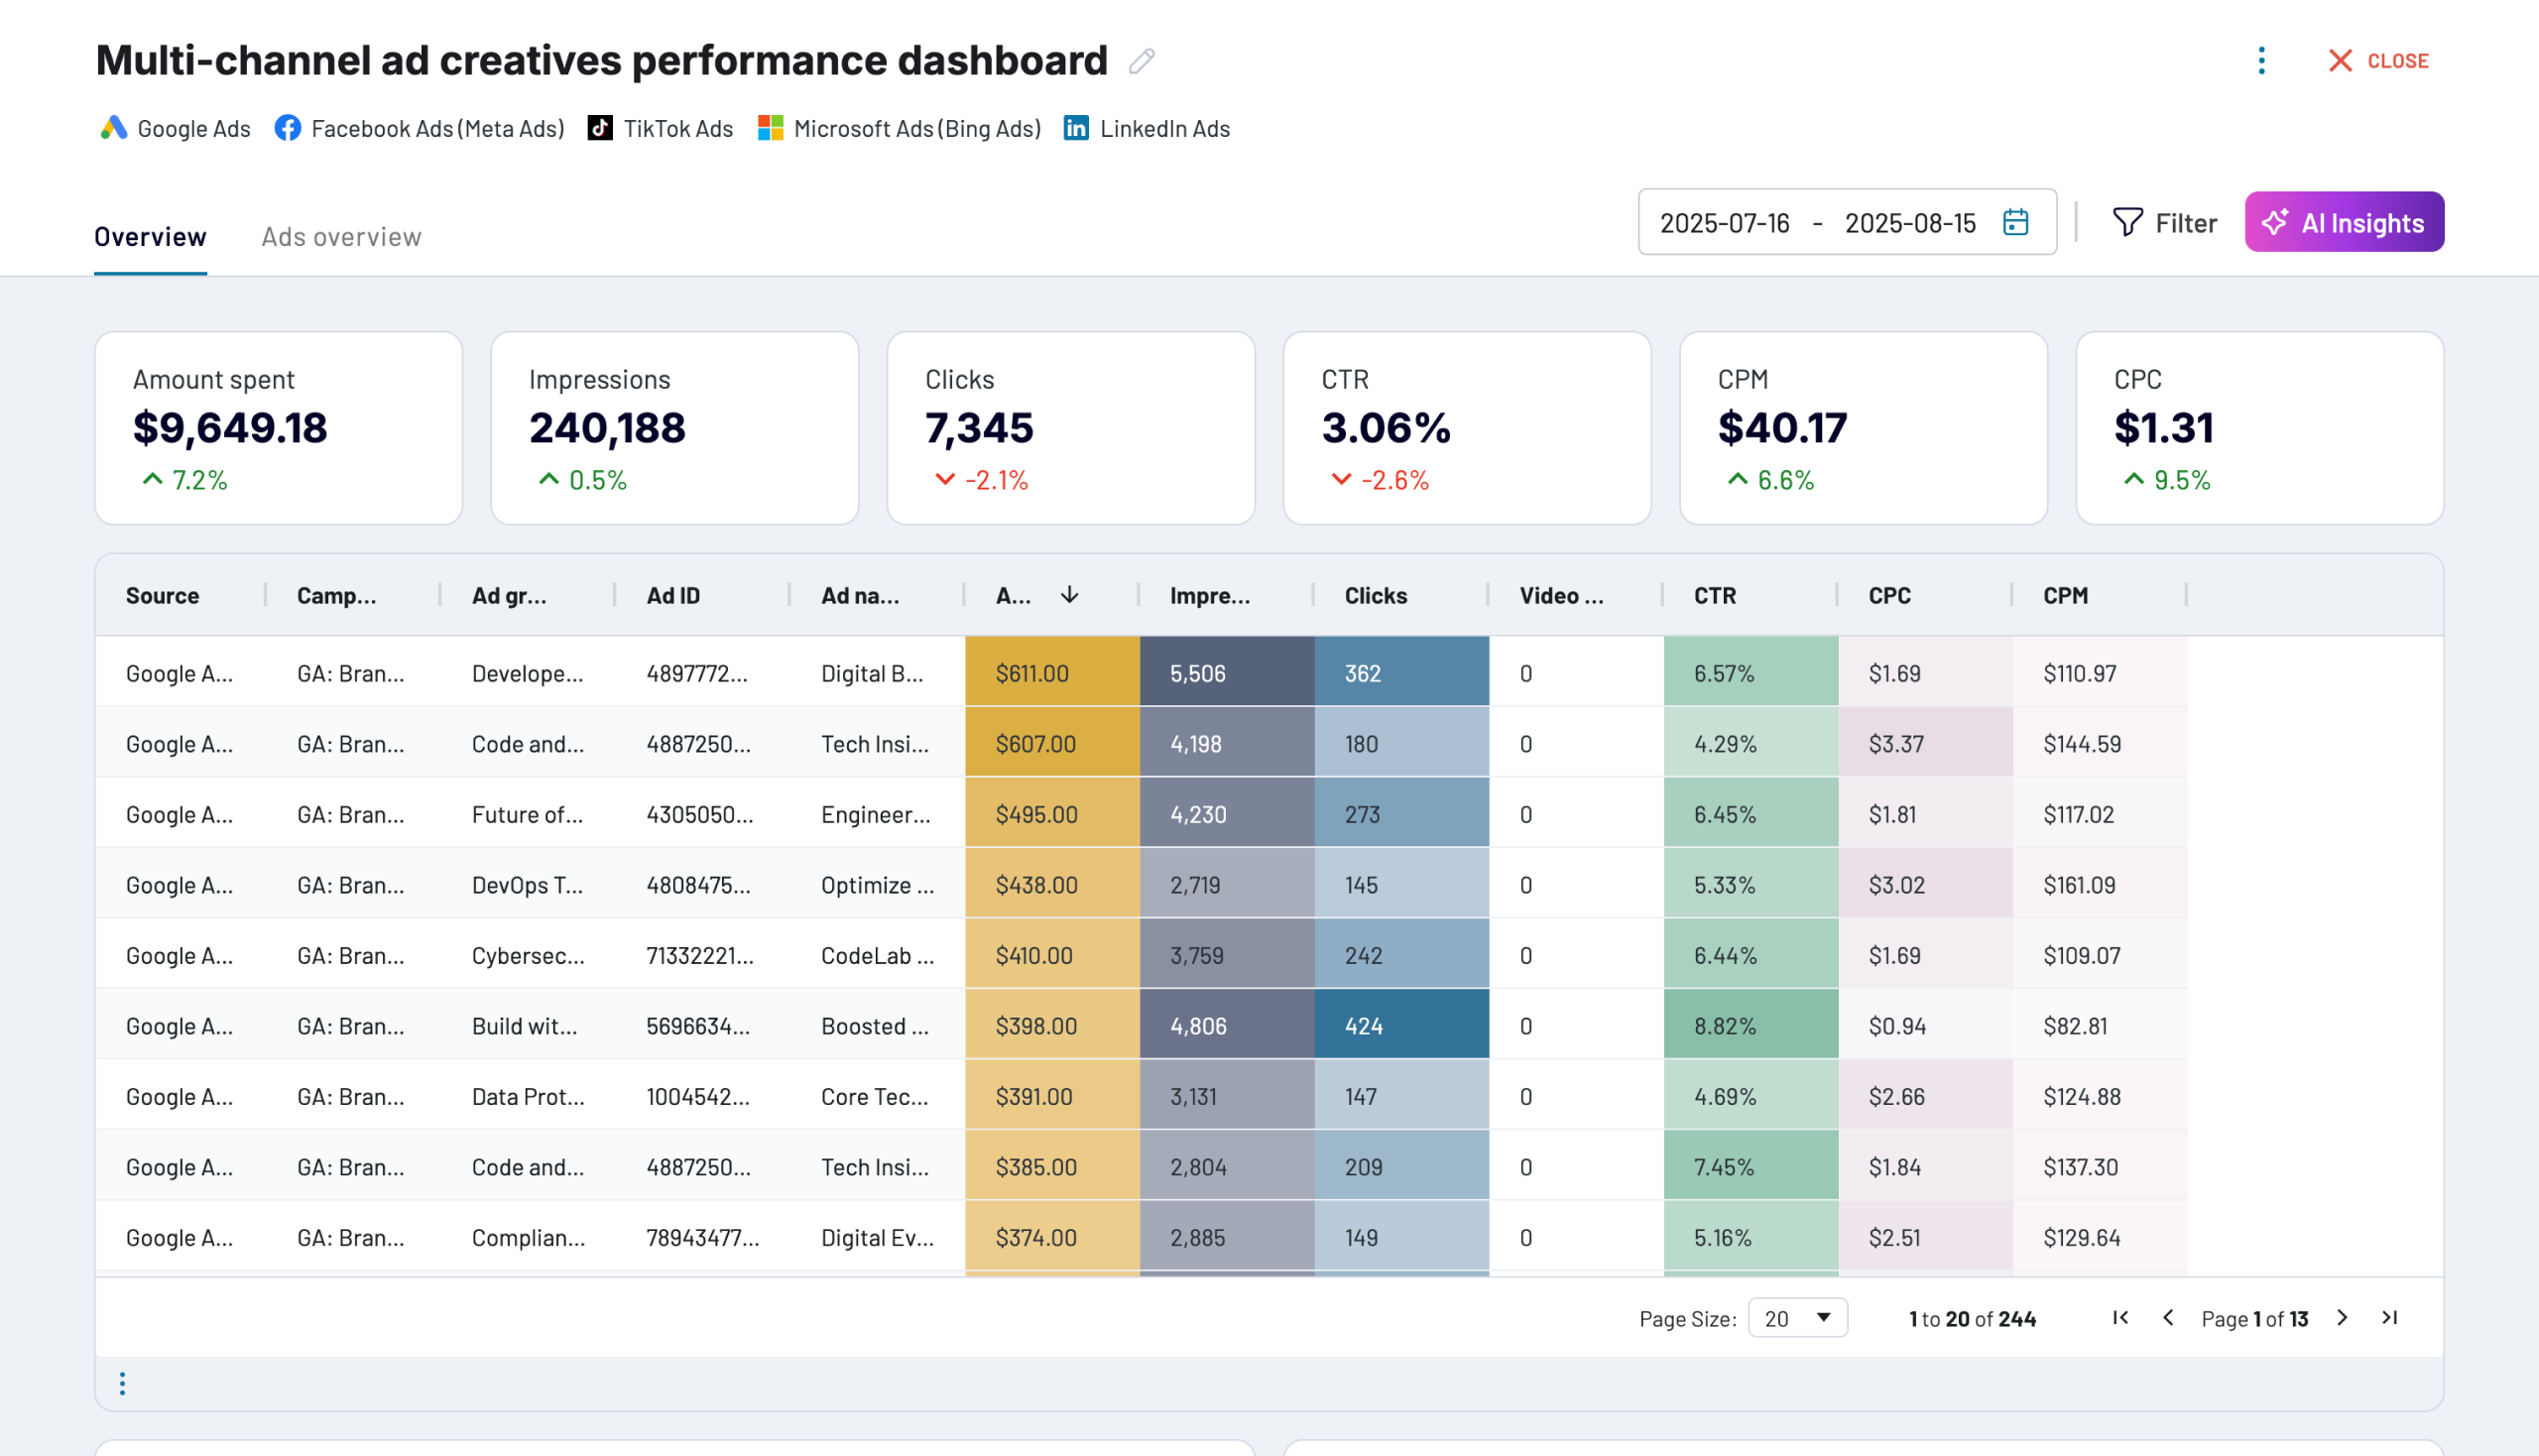
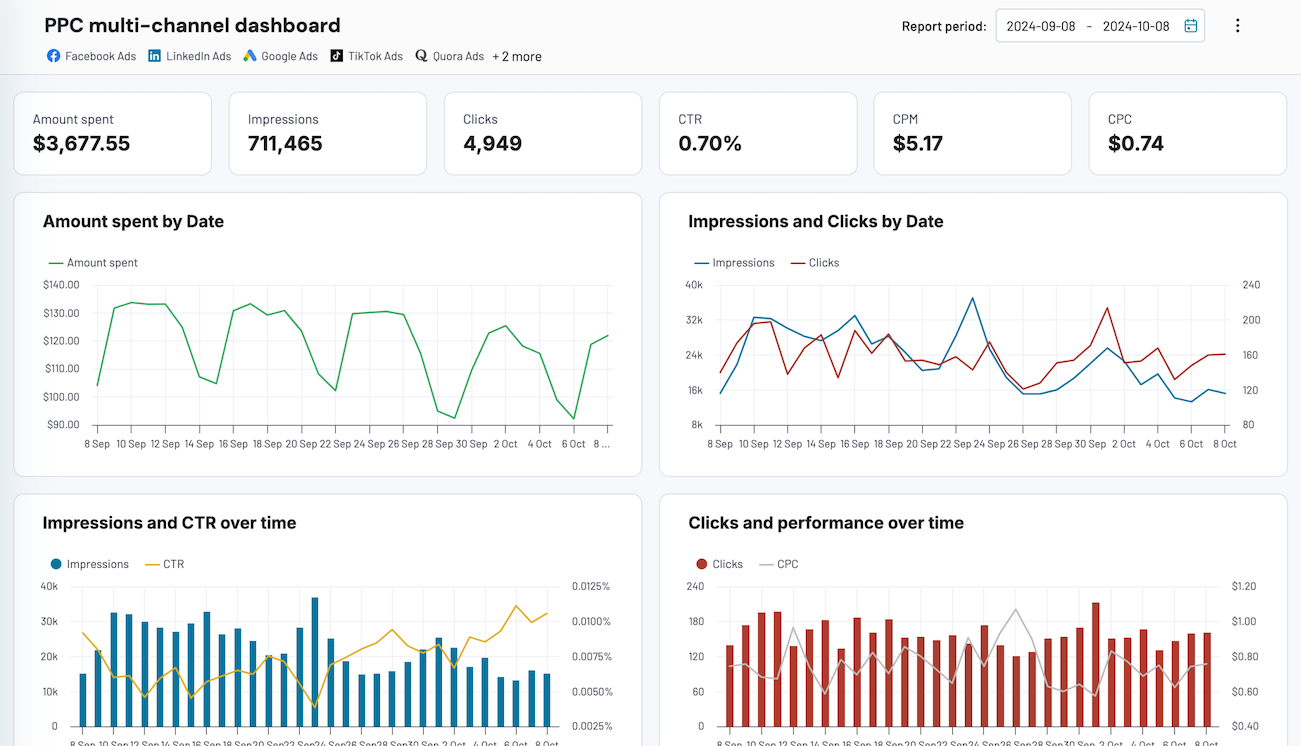
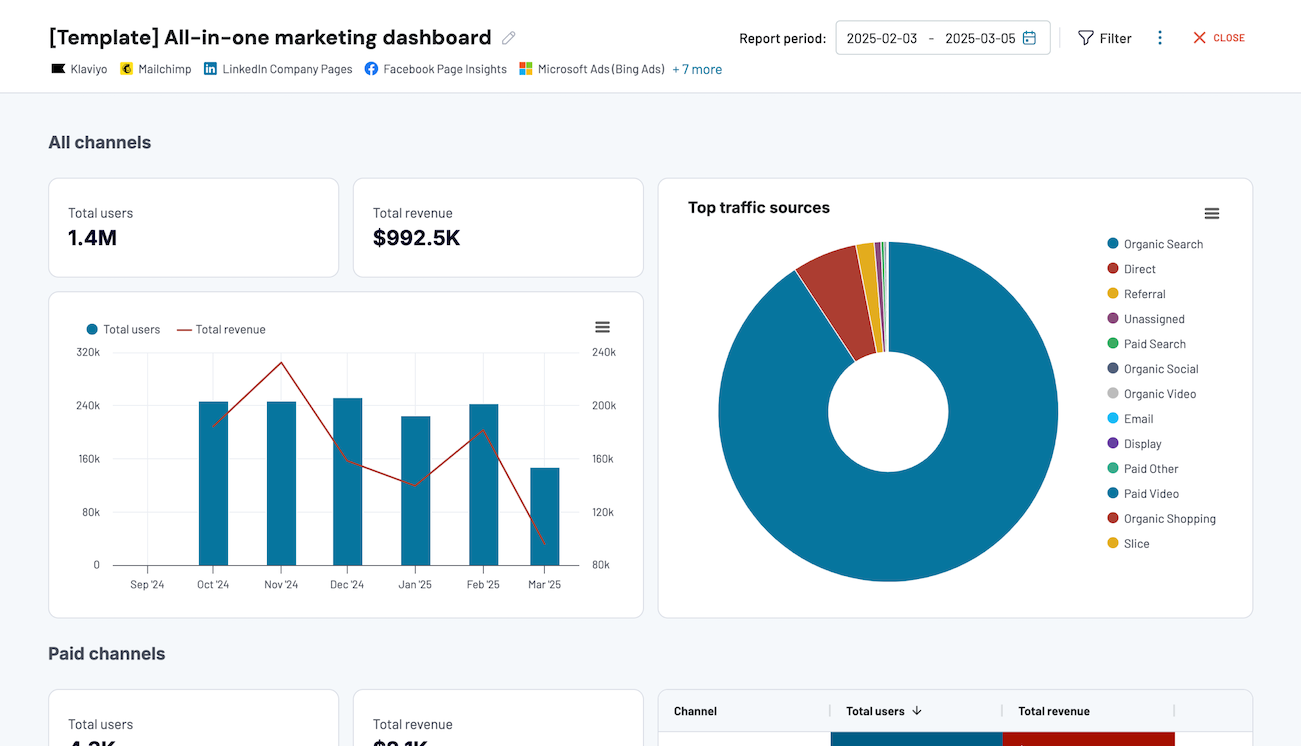
Quick start with dashboard templates


 +0
+0




 +4
+4


 +7
+7
about your case. It doesn't cost you a penny 😉
Talk to AI about your Braze data
Examples of questions you can ask about Braze data:
"Which campaigns had the highest click-to-open ratio this month and what do they have in common?"
"Show me how daily active users changed after we launched the new onboarding canvas"
"Compare engagement rates across our top five segments and suggest which ones need refreshing"
"What day of the week generates the best response rates for our push notification campaigns?"





Your data is secured by industry standards
 SOC 2 Type II
Certified
 Google Cloud
Certified
 GDPR
GDPRCompliant
 HIPAA
HIPAACompliant
Export data from Braze to alternative destinations