Export Braze to Data Studio (formerly Looker Studio)
Visualize Braze to Data Studio data with Coupler.io for interactive marketing dashboards. Turn campaign metrics, journey performance, and segment trends into dynamic charts and drill-down reports that make engagement patterns visible at a glance across your organization.


What data you can export from Braze
-
Campaigns analyticsDelivery and response metrics per campaign formatted for Data Studio visualizations, enabling side-by-side bar charts and trend graphs comparing performance across messaging initiatives.
-
Campaigns detailsTargeting rules, variant configurations, and scheduling parameters structured for building visual breakdowns of campaign setups and A/B test comparisons in dashboard format.
-
CanvasesJourney flow records with step sequences and branching definitions for creating visual journey maps and flow diagrams within Data Studio reporting layouts.
-
Canvases analyticsProgression and drop-off metrics at each canvas step optimized for funnel visualizations, sankey diagrams, and step-by-step performance charts in interactive dashboards.
-
EventsUser action logs capturing in-app behaviors and custom interactions for building event frequency heatmaps and behavioral pattern visualizations in Data Studio.
-
Events analyticsAggregated interaction volumes over configurable time windows for designing time-series charts that reveal engagement rhythms and seasonal activity shifts.
-
Segments analyticsAudience size trends and engagement distributions across defined groups for creating segment comparison dashboards with growth curves and composition breakdowns.
-
Kpi daily new usersAcquisition trend data showing first-time user counts per day for plotting growth trajectories and onboarding velocity charts in executive-facing dashboards.
-
Kpi daily active usersDaily platform engagement figures for building retention dashboards with rolling averages, usage heatmaps, and participation rate visualizations.
-
CardsContent card records with display configurations and targeting rules for visualizing in-app content performance and card placement effectiveness across user segments.
All-in-one tool for Braze data exports and analytics
Feed campaign statistics, user KPIs, and event data from Braze into Data Studio alongside metrics from analytics platforms, ad networks, or product databases to produce unified visual reports spanning your full marketing ecosystem.

Prepare Braze records for visualization by structuring fields into dashboard-friendly formats with proper date hierarchies, categorical groupings, and metric definitions optimized for Data Studio charts, scorecards, and filter controls.

Keep dashboards reflecting the latest engagement data with scheduled refreshes running at 15-minute, 30-minute, hourly, daily, or monthly cycles. Enable your stakeholders to always view up-to-date campaign visuals without manual intervention.

Add a conversational layer to your visual analytics with Coupler.io AI integrations. Send Braze data to AI tools to ask questions about the trends and patterns behind your Data Studio dashboards.

Why export Braze to Data Studio - real life cases

Multi-channel engagement visualization

Journey funnel dashboards

Audience growth and composition reporting

Campaign effectiveness scorecards
How to export Braze to Data Studio
 30 seconds
30 seconds
10 seconds
30 seconds
30 seconds
30 seconds
10 seconds
Automate data exports with the no-code Braze to Data Studio integration
Connect similar Email apps and get data in minutes





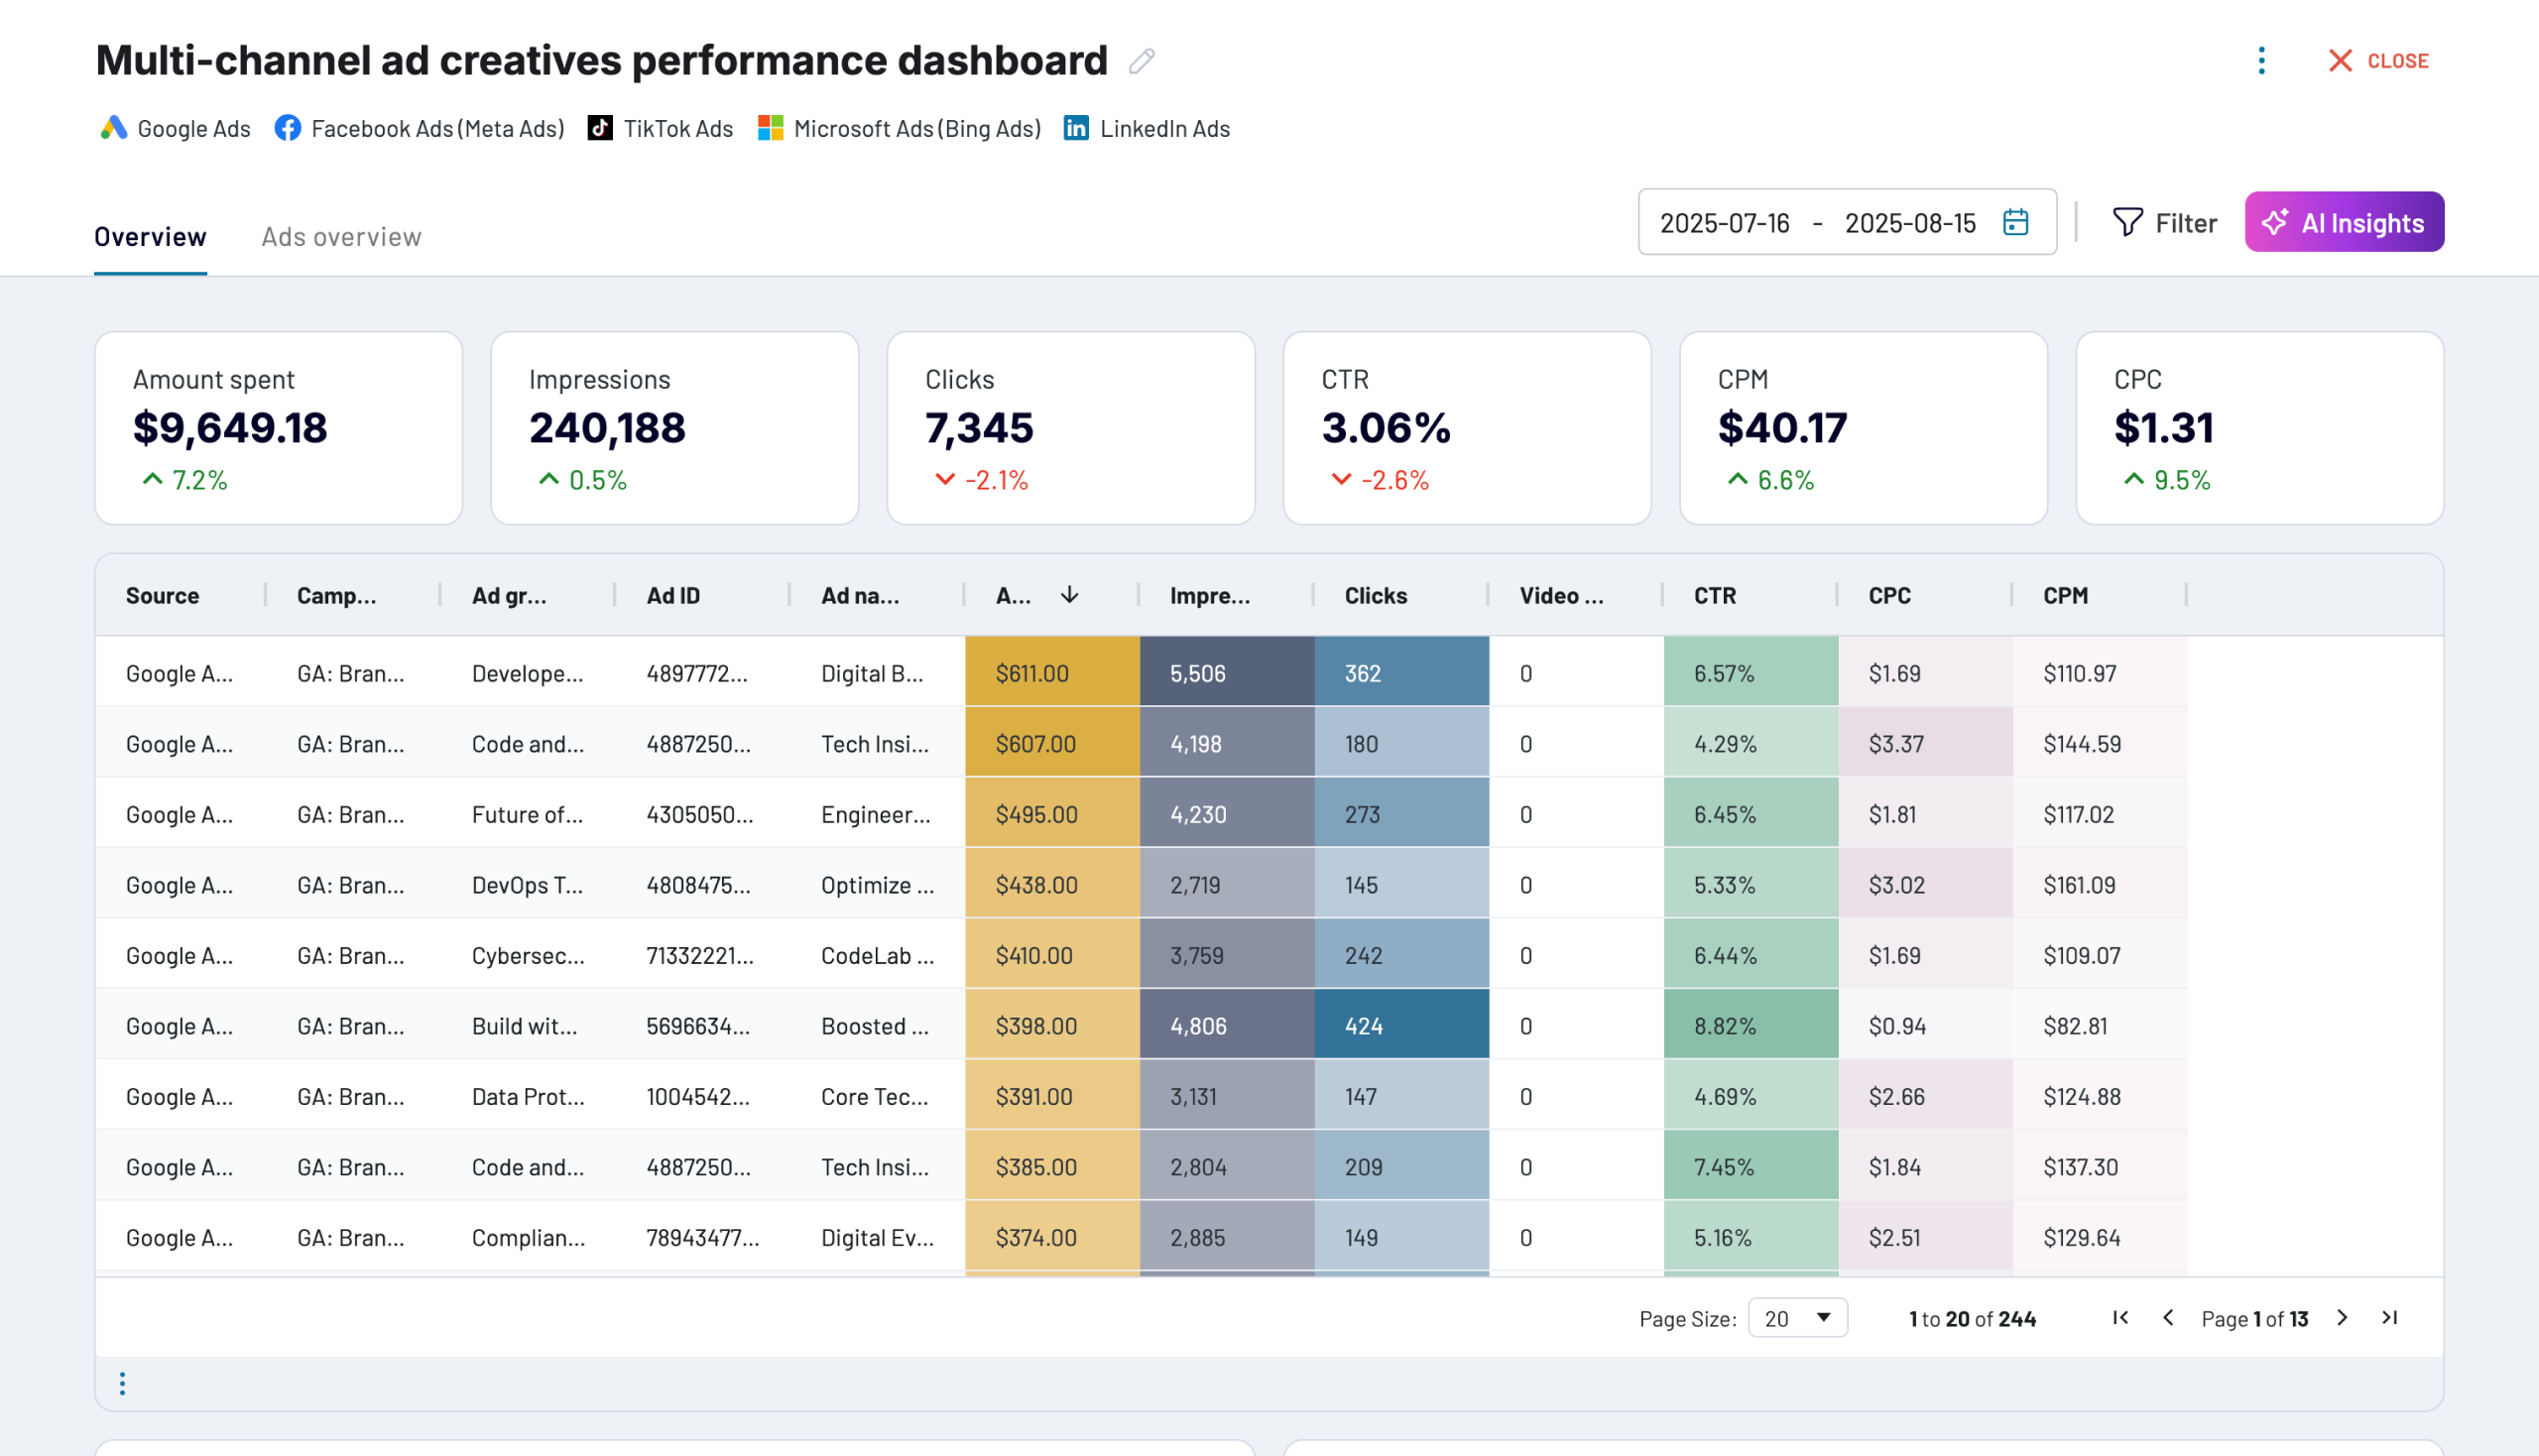
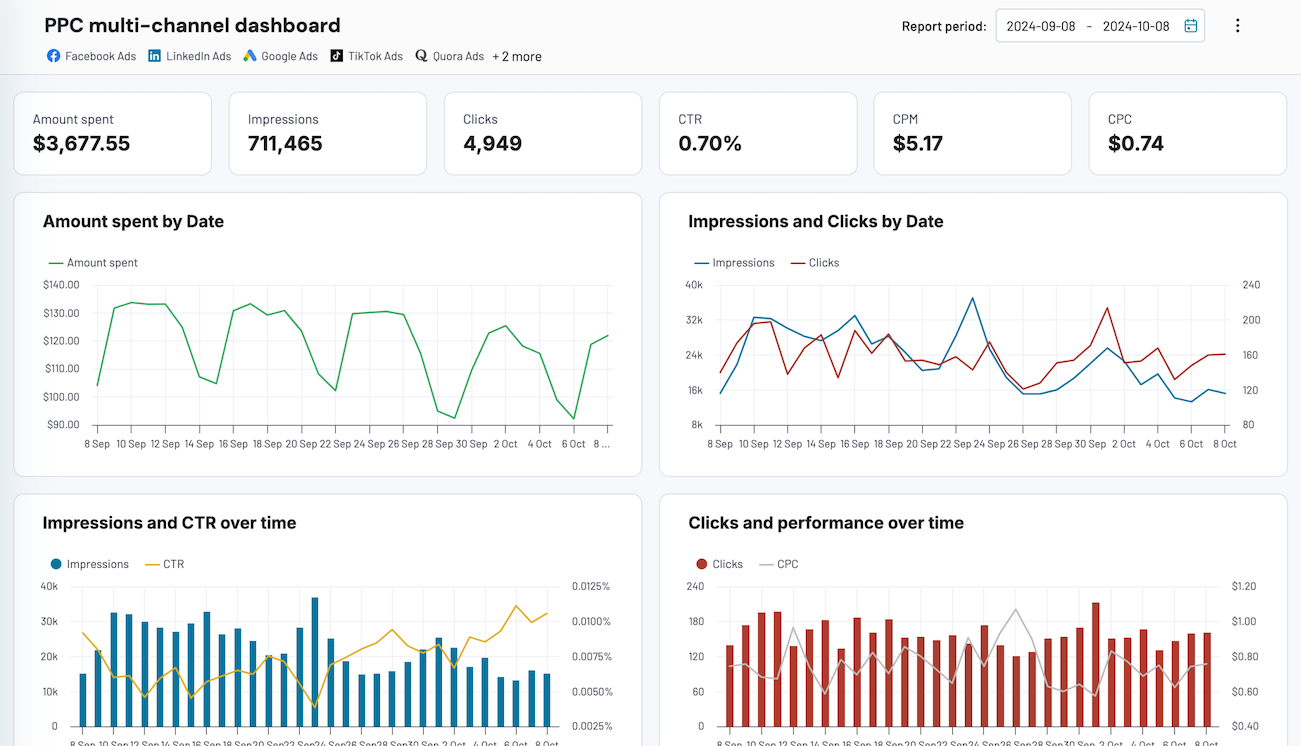
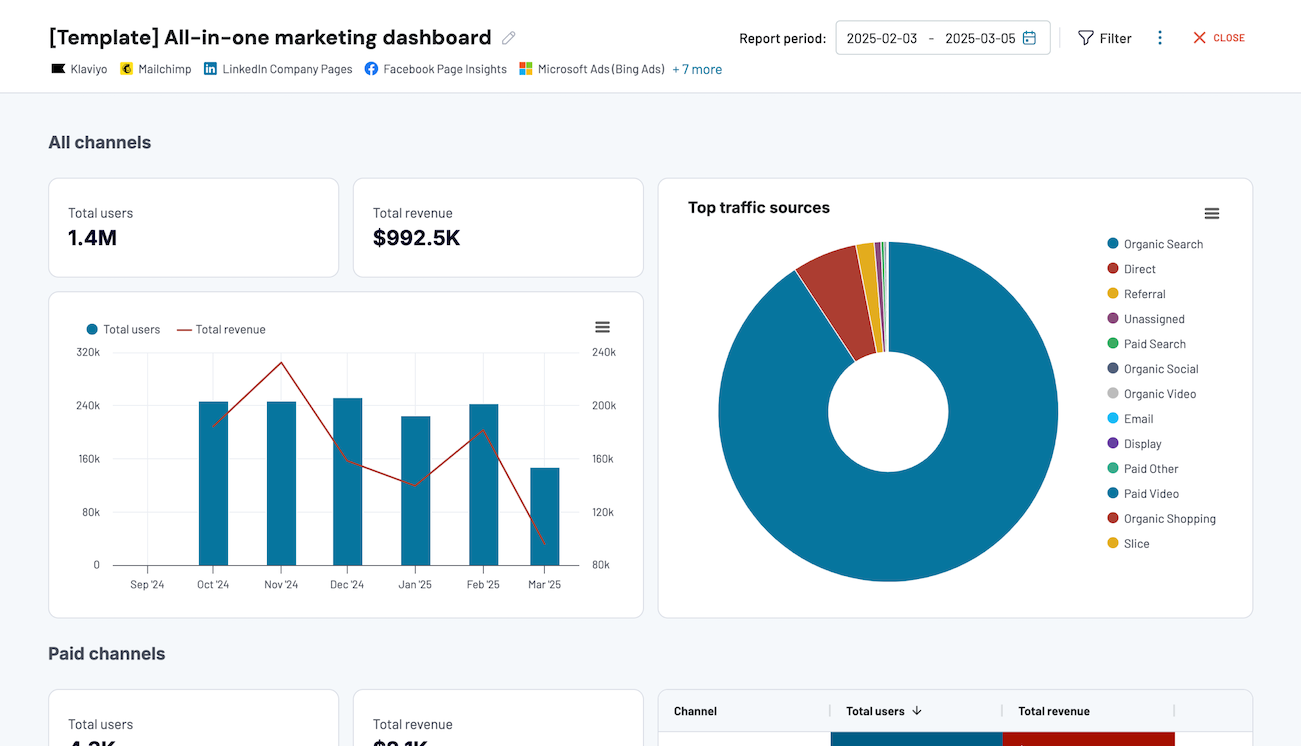
Quick start with dashboard templates


 +0
+0




 +4
+4


 +7
+7
about your case. It doesn't cost you a penny 😉
Talk to AI about your Braze data
Examples of questions you can ask about Braze data:
"What's behind the engagement dip we're seeing in the weekly active users dashboard this month?"
"Recommend the best chart types to present our canvas journey drop-off analysis to leadership"
"Which campaign metrics should I prioritize on the executive scorecard for next quarter's review?"
"Identify correlations between segment growth rates and the campaigns targeting those audiences"





Your data is secured by industry standards
 SOC 2 Type II
Certified
 Google Cloud
Certified
 GDPR
GDPRCompliant
 HIPAA
HIPAACompliant
Export data from Braze to alternative destinations