What data you can export from ClickUp
-
UsersTeam member profiles with roles and permissions for workforce analysis and access management reporting across project dashboards.
-
TeamsOrganizational structures and member groupings to analyze collaboration patterns and build department-specific performance visualizations.
-
ListsProject task collections and deliverable categories for tracking scope completion and analyzing project structure effectiveness.
-
SpacesHigh-level project containers and workspace organization for portfolio management and cross-departmental project analysis.
-
FoldersProject hierarchy elements that maintain organizational structure in your Looker Studio dashboard data model.
-
TasksDetailed task information including status, priority, assignees, due dates, and custom properties for comprehensive project tracking and performance analysis.
-
Time trackingLogged work hours per task, project, and user for accurate billing analysis, productivity measurement, and project profitability insights.
-
Time tracking tagsCategorized time entries enabling detailed billing breakdowns and project cost analysis in visual dashboard format.
-
Custom fieldsProject-specific data points and metadata configured at list level for tailored analytics and specialized project reporting needs.
-
Team goalsStrategic objectives and progress tracking for OKR visualization and goal achievement analysis across teams and projects.
-
CommentsTask communication and collaboration history for project timeline analysis and team interaction insights.
All-in-one tool for ClickUp data exports and analytics
Merge ClickUp project metrics with data from financial systems, HR platforms, or sales tools to create unified business dashboards that show the complete picture of organizational performance.
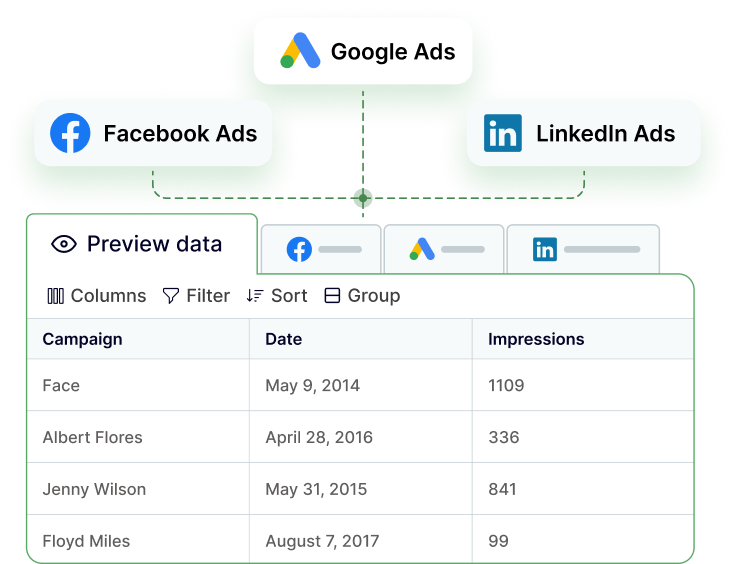
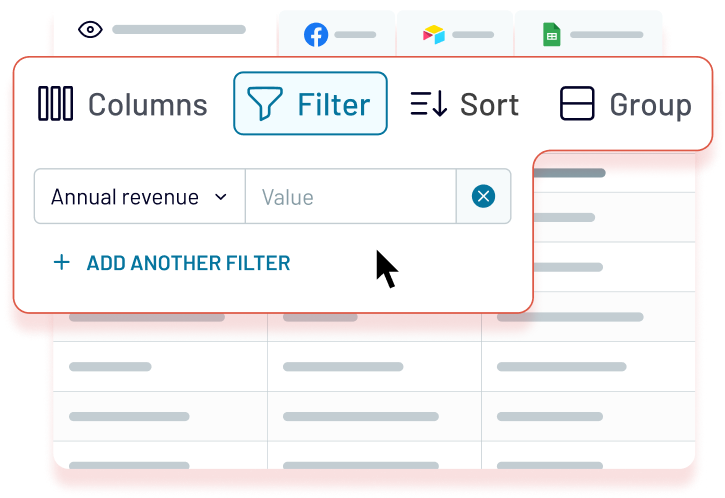
Convert scattered task information, project timelines, and team metrics into analysis-ready data tables with proper relationships, calculated measures, and business-friendly column names for immediate Power BI visualization.
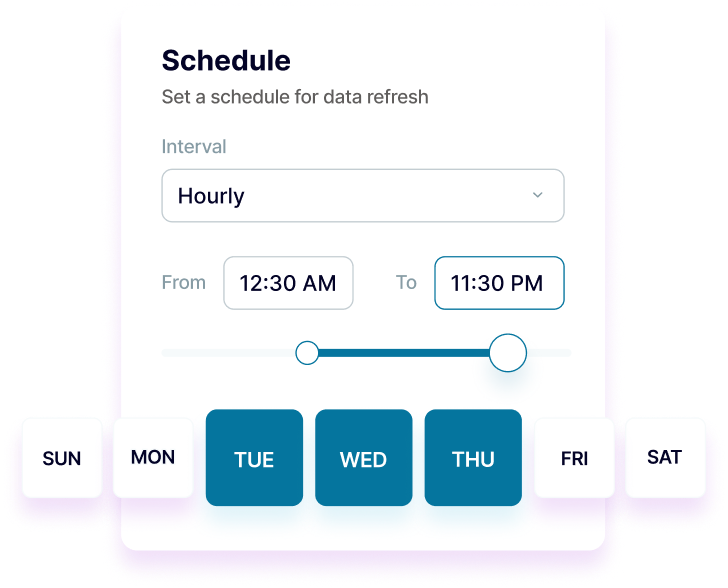
Establish seamless data pipelines with refresh intervals from monthly to every 15 minutes, ensuring your Power BI reports always reflect current project status and team productivity metrics.
Leverage AI-powered insights to ask questions about project performance, resource use, and timeline predictions using natural language queries against your ClickUp data.



Why export ClickUp to Power BI - real life cases
Executive project portfolio dashboards
Advanced resource analytics and forecasting
Cross-functional performance intelligence
Data-driven project optimization
How to export ClickUp to Power BI
Automate data exports with the no-code ClickUp Power BI integration
Connect similar Project Management apps and get data in minutes
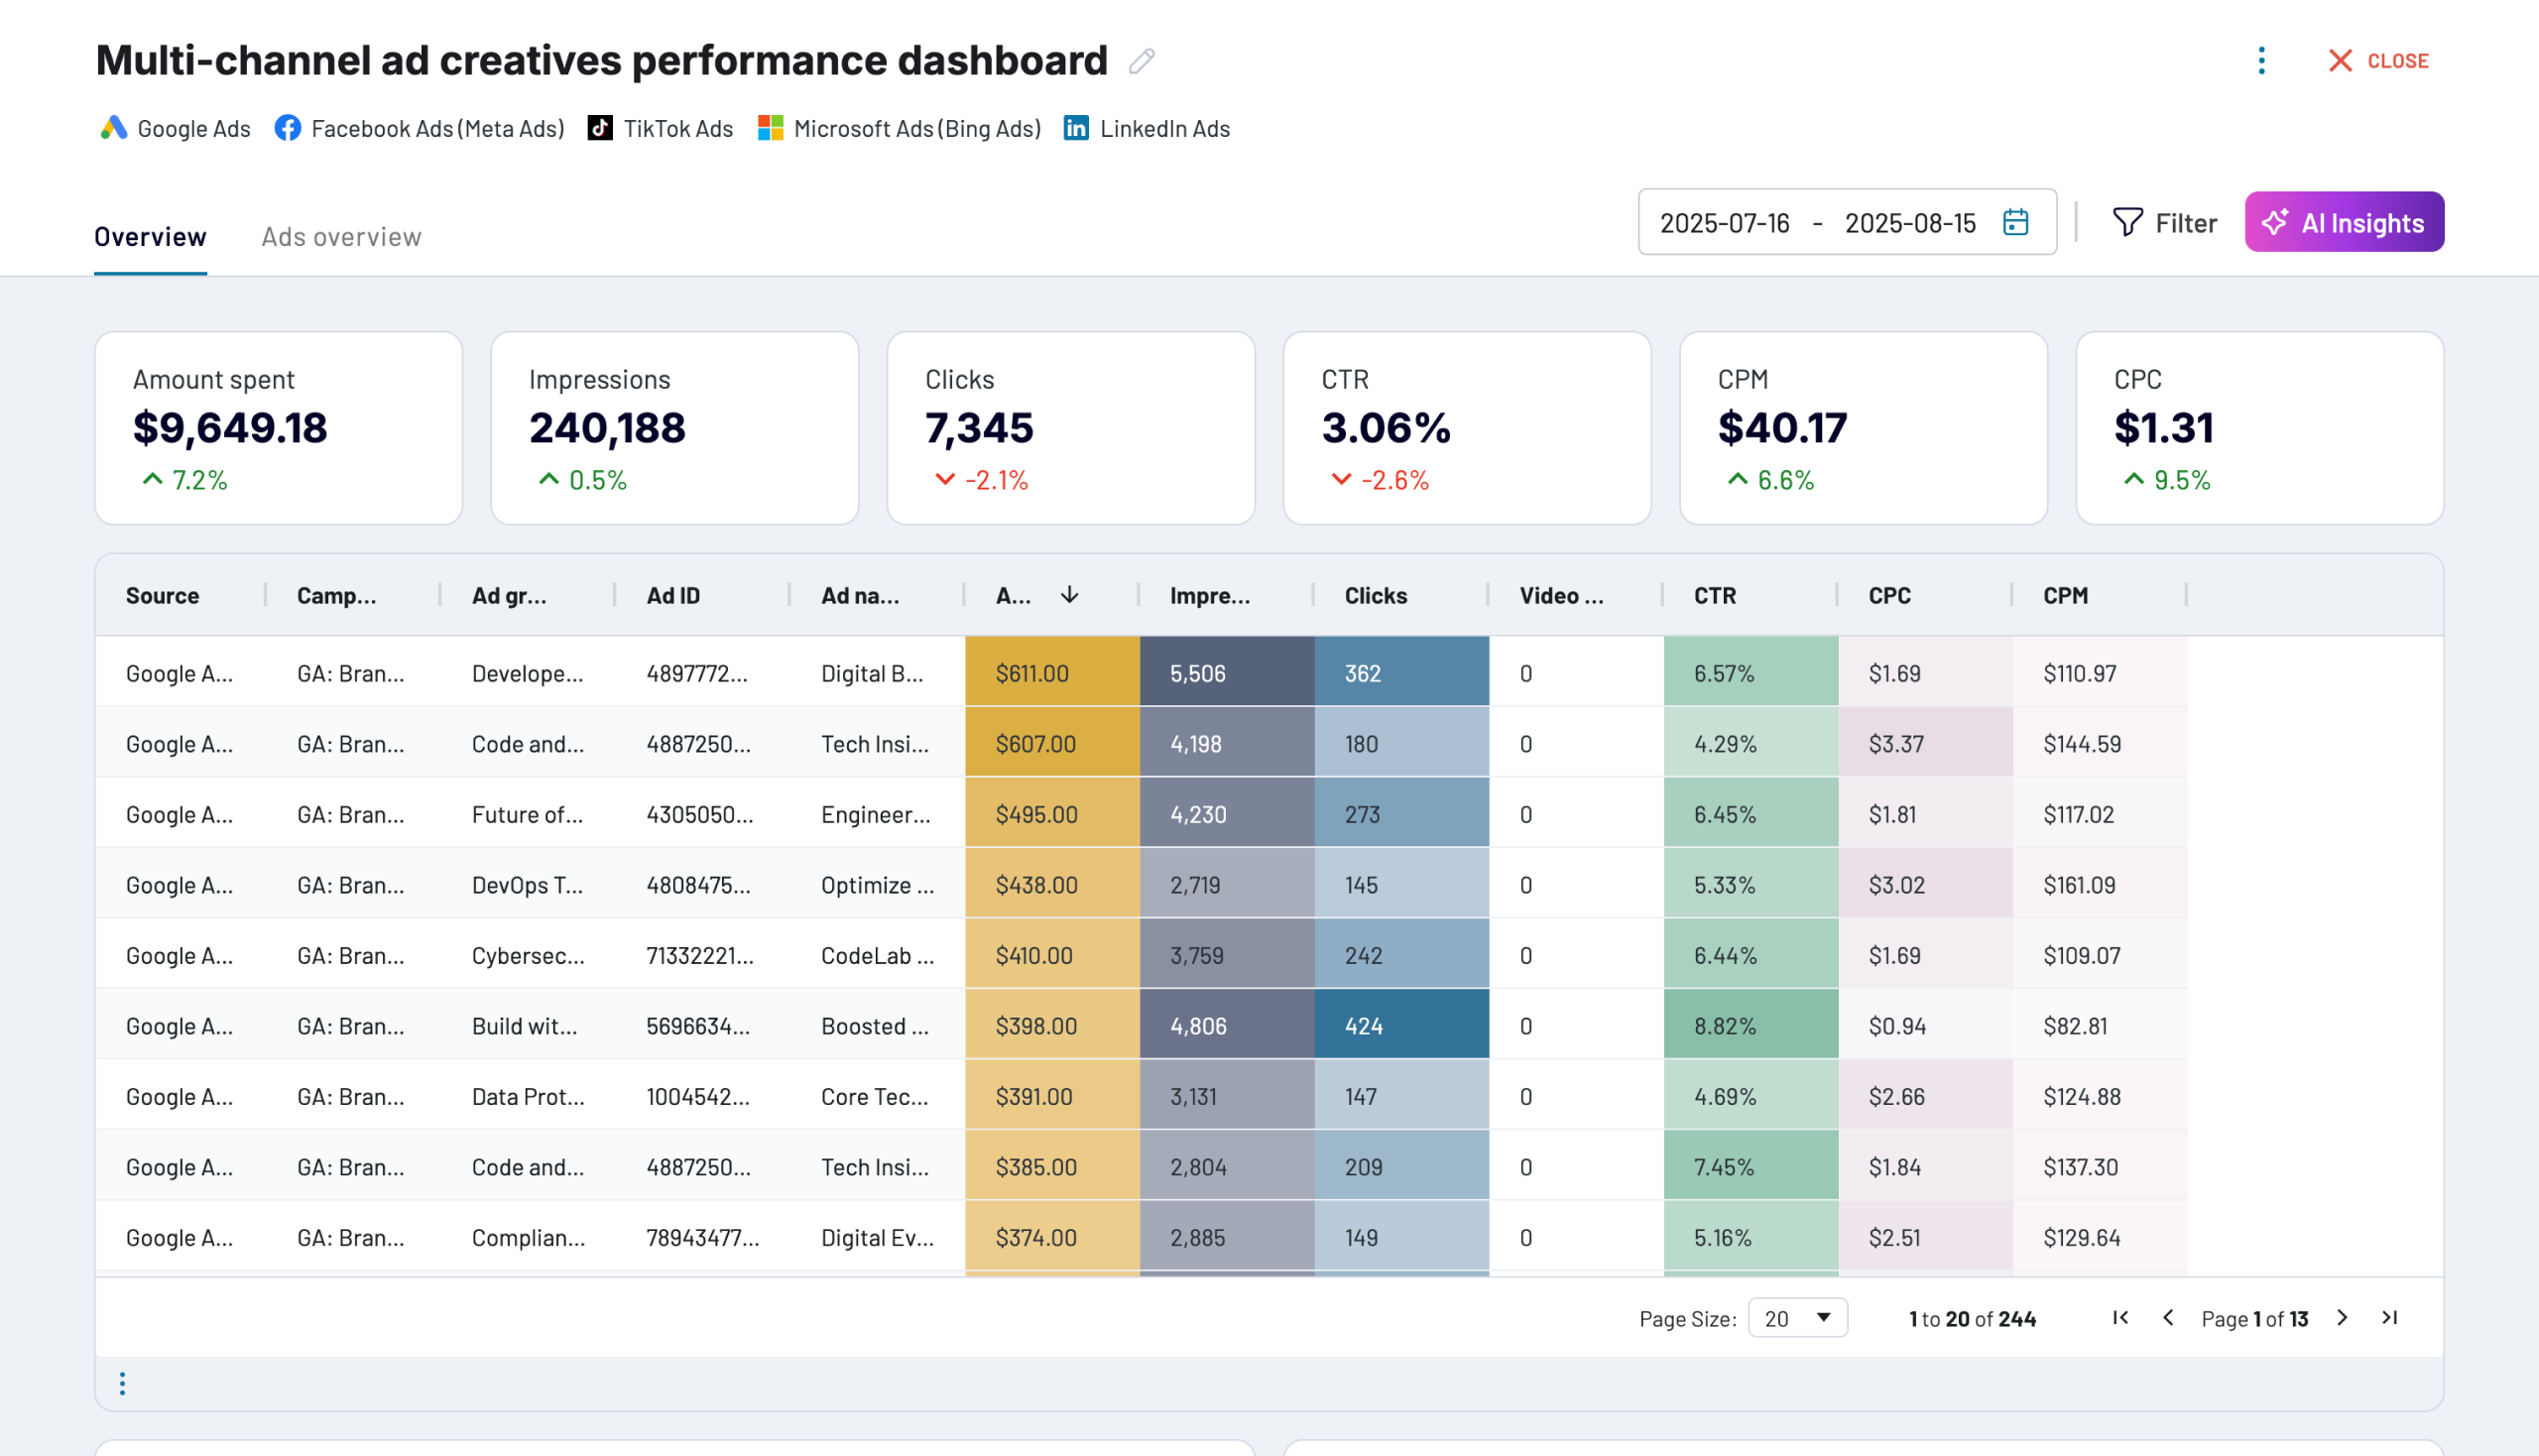
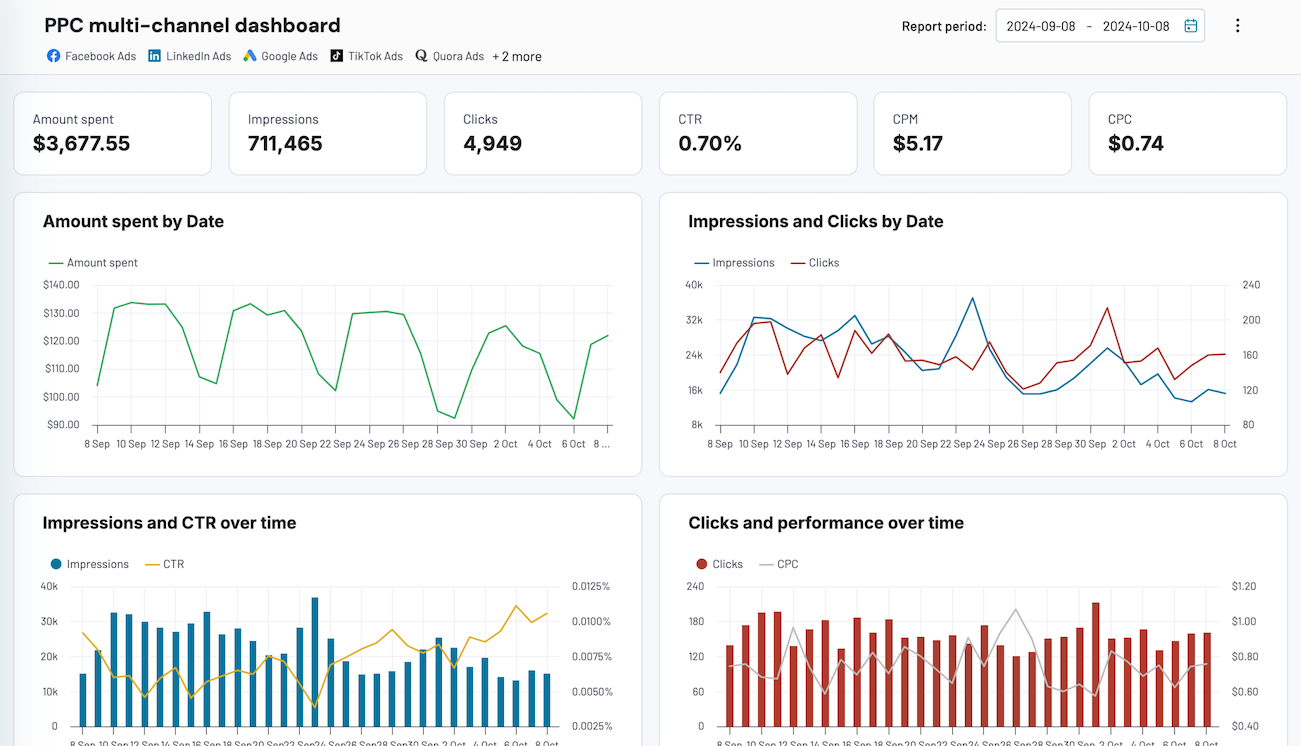
Quick start with dashboard templates




about your case. It doesn't cost you a penny 😉
Talk to AI about your ClickUp data
Ask questions like: "Which projects are consuming the most resources relative to their budget?", "What's the correlation between team size and project delivery time?", "Show me resource utilization trends across different project types", or "Which custom fields are the strongest predictors of project success?" Get instant, data-driven insights without complex DAX formulas or manual analysis.


Keep your data safe
Coupler.io safeguards your shared information and data transfers from breaches, leaks, and unauthorized disclosures.


