Looker Studio dashboard

Looker Studio templates for powerful business reports

Build automated reporting dashboards with ready-to-use templates for Looker Studio that connect your business data sources. Track advertising campaigns, financial performance, sales pipelines, and website analytics through visual reports that update automatically. Consolidate information from Google Ads, QuickBooks, Salesforce, Google Analytics, and other platforms using Coupler.io to transform raw data into actionable insights without manual exports or spreadsheet maintenance.

Looker Studio dashboard templates for any use case

All-in-one social media analytics dashboard  image
All-in-one social media analytics dashboard
YouTube icon LinkedIn Company Pages icon Instagram Insights icon Google Analytics 4 (GA4) icon Facebook Page Insights icon arrow icon Looker Studio icon
Web analytics dashboard image
Web analytics dashboard
Google Analytics 4 (GA4) icon arrow icon Looker Studio icon
Flex Hard: Your PPC 2025 Wrapped  image
Flex Hard: Your PPC 2025 Wrapped
LinkedIn Ads icon Facebook Ads (Meta Ads) icon Google Ads icon X (Twitter) Ads icon TikTok Ads icon Quora Ads icon Microsoft Ads (Bing Ads) icon arrow icon Looker Studio icon
Multi-channel creatives performance dashboard image
Multi-channel creatives performance dashboard
LinkedIn Ads icon Microsoft Ads (Bing Ads) icon TikTok Ads icon Google Ads icon Facebook Ads (Meta Ads) icon arrow icon Looker Studio icon
All-in-one marketing dashboard image
All-in-one marketing dashboard
YouTube icon Google Search Console icon Microsoft Ads (Bing Ads) icon LinkedIn Ads icon Google Ads icon Mailchimp icon Instagram Insights icon +6 arrow icon Looker Studio icon
PPC multi-channel dashboard image
PPC multi-channel dashboard
LinkedIn Ads icon Google Ads icon Microsoft Ads (Bing Ads) icon Facebook Ads (Meta Ads) icon Pinterest Ads icon TikTok Ads icon Quora Ads icon +3 arrow icon Looker Studio icon
Billing dashboard for Xero image
Billing dashboard for Xero
Xero Reports icon Xero icon arrow icon Looker Studio icon
Xero financial dashboard image
Xero financial dashboard
Xero Reports icon Xero icon arrow icon Looker Studio icon
Revenue dashboard for Xero image
Revenue dashboard for Xero
Xero Reports icon Xero icon arrow icon Looker Studio icon
Accounts receivable dashboard for Xero image
Accounts receivable dashboard for Xero
Xero icon arrow icon Looker Studio icon
Accounts payable dashboard for Xero image
Accounts payable dashboard for Xero
Xero icon Xero Reports icon arrow icon Looker Studio icon
Expenses dashboard for Xero image
Expenses dashboard for Xero
Xero icon Xero Reports icon arrow icon Looker Studio icon
Google Analytics PPC dashboard image
Google Analytics PPC dashboard
TikTok Ads icon Google Ads icon Microsoft Ads (Bing Ads) icon X (Twitter) Ads icon Facebook Ads (Meta Ads) icon Snapchat Ads icon LinkedIn Ads icon +4 arrow icon Looker Studio icon
LinkedIn company page performance dashboard image
LinkedIn company page performance dashboard
LinkedIn Company Pages icon arrow icon Looker Studio icon
TikTok analytics dashboard image
TikTok analytics dashboard
TikTok Organic icon arrow icon Looker Studio icon
Google Analytics dashboard for multiple properties image
Google Analytics dashboard for multiple properties
Google Analytics 4 (GA4) icon arrow icon Looker Studio icon
X (Twitter) Ads dashboard image
X (Twitter) Ads dashboard
X (Twitter) Ads icon arrow icon Looker Studio icon
Bing Ads conversion tracking dashboard image
Bing Ads conversion tracking dashboard
Microsoft Ads (Bing Ads) icon arrow icon Looker Studio icon
Bing Ads dashboard image
Bing Ads dashboard
Microsoft Ads (Bing Ads) icon arrow icon Looker Studio icon
Facebook Ads dashboard image
Facebook Ads dashboard
Facebook Ads (Meta Ads) icon arrow icon Looker Studio icon
Instagram business dashboard image
Instagram business dashboard
Instagram Insights icon arrow icon Looker Studio icon
Brand awareness general dashboard image
Brand awareness general dashboard
Google Analytics 4 (GA4) icon Google Search Console icon Instagram Insights icon YouTube icon LinkedIn Company Pages icon Facebook Page Insights icon arrow icon Looker Studio icon
Facebook Ads & Brand awareness dashboard image
Facebook Ads & Brand awareness dashboard
Google Search Console icon Facebook Ads (Meta Ads) icon arrow icon Looker Studio icon
Shopify & Xero revenue dashboard image
Shopify & Xero revenue dashboard
Shopify icon Xero Reports icon Xero icon arrow icon Looker Studio icon
Shopify marketing funnel dashboard image
Shopify marketing funnel dashboard
Google Ads icon Google Analytics 4 (GA4) icon Quora Ads icon LinkedIn Ads icon Facebook Ads (Meta Ads) icon Snapchat Ads icon TikTok Ads icon +5 arrow icon Looker Studio icon
Shopify & QuickBooks revenue dashboard image
Shopify & QuickBooks revenue dashboard
Shopify icon QuickBooks Reports icon QuickBooks icon arrow icon Looker Studio icon
Quickbooks financial dashboard image
Quickbooks financial dashboard
QuickBooks Reports icon QuickBooks icon arrow icon Looker Studio icon
Accounts receivable dashboard for QuickBooks image
Accounts receivable dashboard for QuickBooks
QuickBooks Reports icon QuickBooks icon arrow icon Looker Studio icon
Accounts payable dashboard for QuickBooks image
Accounts payable dashboard for QuickBooks
QuickBooks Reports icon QuickBooks icon arrow icon Looker Studio icon
Billing dashboard for QuickBooks image
Billing dashboard for QuickBooks
QuickBooks icon QuickBooks Reports icon arrow icon Looker Studio icon
Expenses dashboard for QuickBooks image
Expenses dashboard for QuickBooks
QuickBooks icon QuickBooks Reports icon arrow icon Looker Studio icon
QuickBooks revenue dashboard image
QuickBooks revenue dashboard
QuickBooks Reports icon QuickBooks icon arrow icon Looker Studio icon
Google Ads leads dashboard image
Google Ads leads dashboard
Google Ads icon arrow icon Looker Studio icon
Google Ads creatives dashboard image
Google Ads creatives dashboard
Google Ads icon arrow icon Looker Studio icon
Quality score analytics dashboard for Google Ads image
Quality score analytics dashboard for Google Ads
Google Ads icon arrow icon Looker Studio icon
Google Ads dashboard image
Google Ads dashboard
Google Ads icon arrow icon Looker Studio icon
Keyword performance dashboard for Google Ads image
Keyword performance dashboard for Google Ads
Google Ads icon arrow icon Looker Studio icon
Google Ads monthly dashboard image
Google Ads monthly dashboard
Google Ads icon arrow icon Looker Studio icon
Branded organic search vs. paid campaign performance dashboard for Google image
Branded organic search vs. paid campaign performance dashboard for Google
Google Search Console icon Google Ads icon arrow icon Looker Studio icon
AI traffic vs Organic traffic dashboard image
AI traffic vs Organic traffic dashboard
Google Analytics 4 (GA4) icon arrow icon Looker Studio icon
Top search query performance dashboard image
Top search query performance dashboard
Google Search Console icon arrow icon Looker Studio icon
GA4 key event insights dashboard image
GA4 key event insights dashboard
Google Analytics 4 (GA4) icon arrow icon Looker Studio icon
AI traffic analytics dashboard image
AI traffic analytics dashboard
Google Analytics 4 (GA4) icon arrow icon Looker Studio icon
Landing page performance dashboard image
Landing page performance dashboard
Google Analytics 4 (GA4) icon Google Search Console icon arrow icon Looker Studio icon
SEO dashboard for Google Search Console image
SEO dashboard for Google Search Console
Google Search Console icon arrow icon Looker Studio icon
Technical SEO dashboard image
Technical SEO dashboard
Google Search Console icon arrow icon Looker Studio icon
Google News dashboard image
Google News dashboard
Google Search Console icon arrow icon Looker Studio icon
News Outlets dashboard image
News Outlets dashboard
Google Search Console icon arrow icon Looker Studio icon
Search types and appearance from Google Search Console image
Search types and appearance from Google Search Console
Google Search Console icon arrow icon Looker Studio icon
Global SEO performance dashboard image
Global SEO performance dashboard
Google Search Console icon arrow icon Looker Studio icon
Customer acquisition dashboard for Pipedrive image
Customer acquisition dashboard for Pipedrive
Pinterest Ads icon Facebook Ads (Meta Ads) icon Google Ads icon X (Twitter) Ads icon Google Analytics 4 (GA4) icon LinkedIn Ads icon Microsoft Ads (Bing Ads) icon +3 arrow icon Looker Studio icon
Sales KPI dashboard for Pipedrive image
Sales KPI dashboard for Pipedrive
Pipedrive icon arrow icon Looker Studio icon
CRM dashboard for Pipedrive image
CRM dashboard for Pipedrive
Pipedrive icon arrow icon Looker Studio icon
Reddit Ads dashboard image
Reddit Ads dashboard
Reddit ads icon arrow icon Looker Studio icon
Google Ads and Meta Ads campaign performance dashboard image
Google Ads and Meta Ads campaign performance dashboard
Google Ads icon Facebook Ads (Meta Ads) icon arrow icon Looker Studio icon
Apple Search Ads dashboard image
Apple Search Ads dashboard
Apple Search Ads icon arrow icon Looker Studio icon
TikTok Ads dashboard image
TikTok Ads dashboard
TikTok Ads icon arrow icon Looker Studio icon
Snapchat Ads dashboard image
Snapchat Ads dashboard
Snapchat Ads icon arrow icon Looker Studio icon
Quora Ads dashboard image
Quora Ads dashboard
Quora Ads icon arrow icon Looker Studio icon
Pinterest Ads monthly dashboard image
Pinterest Ads monthly dashboard
Pinterest Ads icon arrow icon Looker Studio icon
Pinterest Ads dashboard image
Pinterest Ads dashboard
Pinterest Ads icon arrow icon Looker Studio icon
Facebook Ads performance for mobile apps dashboard image
Facebook Ads performance for mobile apps dashboard
Facebook Ads (Meta Ads) icon arrow icon Looker Studio icon
Facebook Ads ecommerce performance dashboard image
Facebook Ads ecommerce performance dashboard
Facebook Ads (Meta Ads) icon arrow icon Looker Studio icon
Facebook Ads leads breakdown dashboard image
Facebook Ads leads breakdown dashboard
Facebook Ads (Meta Ads) icon arrow icon Looker Studio icon
Facebook Ads purchases breakdown dashboard image
Facebook Ads purchases breakdown dashboard
Facebook Ads (Meta Ads) icon arrow icon Looker Studio icon
Meta Ads creatives dashboard image
Meta Ads creatives dashboard
Facebook Ads (Meta Ads) icon arrow icon Looker Studio icon
Facebook page insights dashboard image
Facebook page insights dashboard
Facebook Page Insights icon arrow icon Looker Studio icon
Meta Ads monthly dashboard image
Meta Ads monthly dashboard
Facebook Ads (Meta Ads) icon arrow icon Looker Studio icon
Shopify sales funnel dashboard image
Shopify sales funnel dashboard
Google Analytics 4 (GA4) icon arrow icon Looker Studio icon
Shopify store traffic dashboard image
Shopify store traffic dashboard
Google Analytics 4 (GA4) icon Shopify icon arrow icon Looker Studio icon
Inventory dashboard for Shopify image
Inventory dashboard for Shopify
Shopify icon arrow icon Looker Studio icon
Shopify orders dashboard image
Shopify orders dashboard
Shopify icon arrow icon Looker Studio icon
Marketing and sales performance dashboard for HubSpot image
Marketing and sales performance dashboard for HubSpot
HubSpot icon arrow icon Looker Studio icon
HubSpot marketing performance dashboard image
HubSpot marketing performance dashboard
HubSpot icon arrow icon Looker Studio icon
Customer acquisition dashboard for HubSpot image
Customer acquisition dashboard for HubSpot
LinkedIn Ads icon Google Analytics 4 (GA4) icon Facebook Ads (Meta Ads) icon Google Ads icon Snapchat Ads icon X (Twitter) Ads icon Microsoft Ads (Bing Ads) icon +1 arrow icon Looker Studio icon
Sales KPI dashboard for HubSpot image
Sales KPI dashboard for HubSpot
HubSpot icon arrow icon Looker Studio icon
CRM dashboard for HubSpot image
CRM dashboard for HubSpot
HubSpot icon arrow icon Looker Studio icon
CRM dashboard for Salesforce image
CRM dashboard for Salesforce
Salesforce icon arrow icon Looker Studio icon
Salesforce dashboard image
Salesforce dashboard
Salesforce icon arrow icon Looker Studio icon
Sales team performance dashboard for Salesforce image
Sales team performance dashboard for Salesforce
Salesforce icon arrow icon Looker Studio icon
Salesforce Win Loss analysis dashboard image
Salesforce Win Loss analysis dashboard
Salesforce icon arrow icon Looker Studio icon
Salesforce sales analytics dashboard image
Salesforce sales analytics dashboard
LinkedIn Ads icon Microsoft Ads (Bing Ads) icon Facebook Ads (Meta Ads) icon Google Ads icon Google Analytics 4 (GA4) icon X (Twitter) Ads icon Snapchat Ads icon +1 arrow icon Looker Studio icon
MailerLite campaign performance dashboard image
MailerLite campaign performance dashboard
MailerLite icon arrow icon Looker Studio icon
MailerLite segments performance dashboard image
MailerLite segments performance dashboard
MailerLite icon arrow icon Looker Studio icon
MailerLite workflow automation performance dashboard image
MailerLite workflow automation performance dashboard
MailerLite icon arrow icon Looker Studio icon
ActiveCampaign campaign performance dashboard image
ActiveCampaign campaign performance dashboard
ActiveCampaign icon arrow icon Looker Studio icon
Stripe e-commerce dashboard image
Stripe e-commerce dashboard
Stripe icon arrow icon Looker Studio icon
Stripe MRR and revenue dashboard image
Stripe MRR and revenue dashboard
Stripe icon arrow icon Looker Studio icon
Mailchimp email performance dashboard for WooCommerce image
Mailchimp email performance dashboard for WooCommerce
WooCommerce icon Mailchimp icon arrow icon Looker Studio icon
Mailchimp email campaign performance dashboard for Shopify store image
Mailchimp email campaign performance dashboard for Shopify store
Mailchimp icon Shopify icon arrow icon Looker Studio icon
Email marketing analytics dashboard for Mailchimp image
Email marketing analytics dashboard for Mailchimp
Google Analytics 4 (GA4) icon Mailchimp icon arrow icon Looker Studio icon
Mailchimp analytics dashboard image
Mailchimp analytics dashboard
Mailchimp icon arrow icon Looker Studio icon
Klaviyo analytics dashboard image
Klaviyo analytics dashboard
Klaviyo icon arrow icon Looker Studio icon
Email marketing analytics dashboard for Klaviyo image
Email marketing analytics dashboard for Klaviyo
Google Analytics 4 (GA4) icon Klaviyo icon arrow icon Looker Studio icon
Klaviyo email campaign performance dashboard for Shopify store image
Klaviyo email campaign performance dashboard for Shopify store
Shopify icon Klaviyo icon arrow icon Looker Studio icon
Klaviyo email performance dashboard for WooCommerce image
Klaviyo email performance dashboard for WooCommerce
WooCommerce icon Klaviyo icon arrow icon Looker Studio icon
Payroll dashboard for Harvest image
Payroll dashboard for Harvest
Harvest icon arrow icon Looker Studio icon
Time tracking dashboard for Harvest image
Time tracking dashboard for Harvest
Harvest icon arrow icon Looker Studio icon
Time tracking dashboard for Clockify image
Time tracking dashboard for Clockify
Clockify icon arrow icon Looker Studio icon
GoHighLevel customer acquisition dashboard image
GoHighLevel customer acquisition dashboard
Google Analytics 4 (GA4) icon Google Ads icon LinkedIn Ads icon Microsoft Ads (Bing Ads) icon Pinterest Ads icon GoHighLevel icon X (Twitter) Ads icon +3 arrow icon Looker Studio icon
GoHighLevel sales KPI dashboard image
GoHighLevel sales KPI dashboard
GoHighLevel icon arrow icon Looker Studio icon
WooCommerce store traffic dashboard image
WooCommerce store traffic dashboard
Google Analytics 4 (GA4) icon WooCommerce icon arrow icon Looker Studio icon
WooCommerce Orders dashboard image
WooCommerce Orders dashboard
WooCommerce icon arrow icon Looker Studio icon
WooCommerce marketing funnel image
WooCommerce marketing funnel
LinkedIn Ads icon Quora Ads icon Pinterest Ads icon Google Analytics 4 (GA4) icon TikTok Ads icon Google Ads icon X (Twitter) Ads icon +5 arrow icon Looker Studio icon
Intercom dashboard image
Intercom dashboard
Intercom icon arrow icon Looker Studio icon
Google Business Profile dashboard image
Google Business Profile dashboard
Google Business Profile icon arrow icon Looker Studio icon
Google Calendar dashboard image
Google Calendar dashboard
Google Calendar icon arrow icon Looker Studio icon
Google Calendar team meeting dashboard image
Google Calendar team meeting dashboard
Google Calendar icon arrow icon Looker Studio icon
Calendly event dashboard image
Calendly event dashboard
Calendly icon arrow icon Looker Studio icon
LinkedIn Ads leads dashboard image
LinkedIn Ads leads dashboard
LinkedIn Ads icon arrow icon Looker Studio icon
LinkedIn Ads creatives dashboard image
LinkedIn Ads creatives dashboard
LinkedIn Ads icon arrow icon Looker Studio icon
LinkedIn Ads dashboard image
LinkedIn Ads dashboard
LinkedIn Ads icon arrow icon Looker Studio icon
LinkedIn Ads monthly dashboard image
LinkedIn Ads monthly dashboard
LinkedIn Ads icon arrow icon Looker Studio icon
Website traffic from YouTube - performance analysis dashboard image
Website traffic from YouTube - performance analysis dashboard
Google Analytics 4 (GA4) icon arrow icon Looker Studio icon
YouTube KPIs dashboard image
YouTube KPIs dashboard
YouTube icon arrow icon Looker Studio icon
YouTube dashboard image
YouTube dashboard
YouTube icon arrow icon Looker Studio icon
No such template is available yet.
No worries. Our team will create a template that fits your needs, just tell us more
about your case. It doesn't cost you a penny 😉
Request a custom report

Go from data to insights with Looker Studio templates

What is a Looker Studio template?

A Looker Studio template provides pre-built report structures that visualize business metrics from connected data sources. These templates eliminate the need to design dashboards from scratch because they offer tested layouts, charts, and filters tailored to specific business functions. Each template connects to platforms like advertising accounts, accounting software, or CRM systems through automated data pipelines that refresh information on schedules you define.

The templates transform into personalized dashboards populated with your actual business data within minutes. Coupler.io handles the technical complexity of data extraction, transformation, and loading, so that you can focus on analysis instead of data preparation. This approach creates a reliable reporting infrastructure that maintains accuracy as your business scales.
dashboard-image image

What Looker Studio report templates can you use?

Different business functions require distinct reporting approaches, and selecting templates for Looker Studio that match your operational needs ensures you extract maximum value from your data. Available template categories address the primary analytics requirements across organizations.

Advertising and marketing report

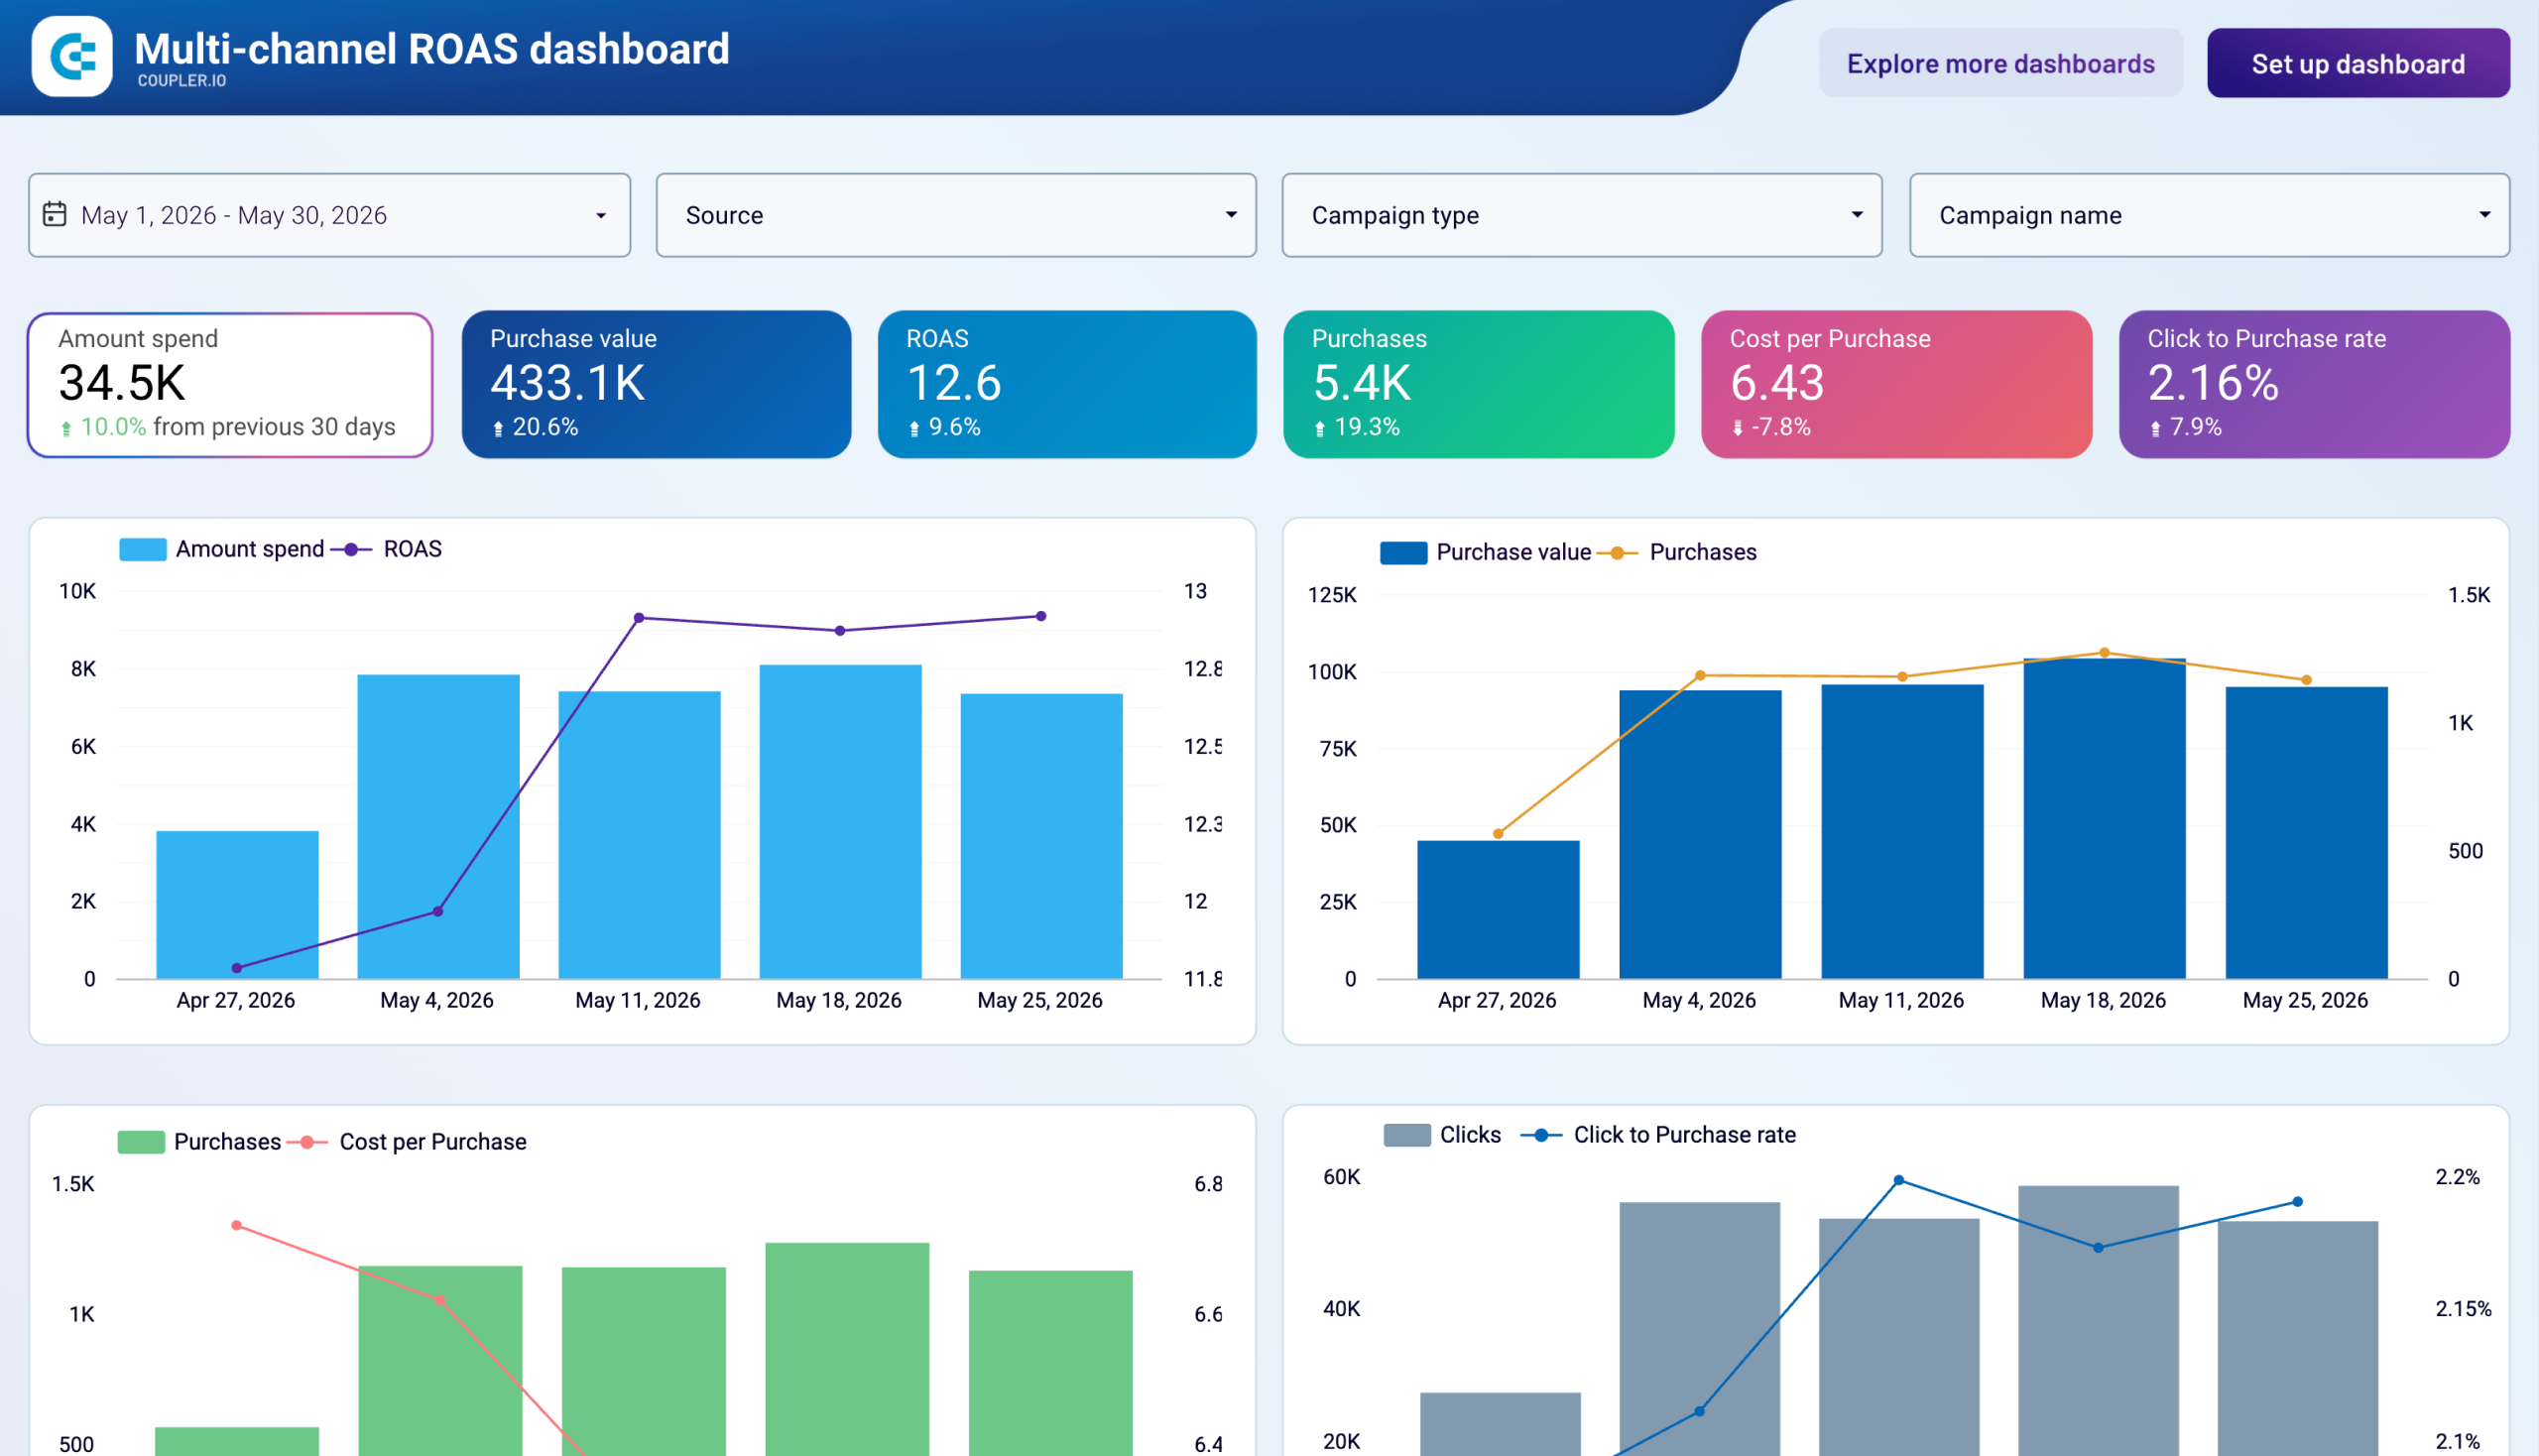
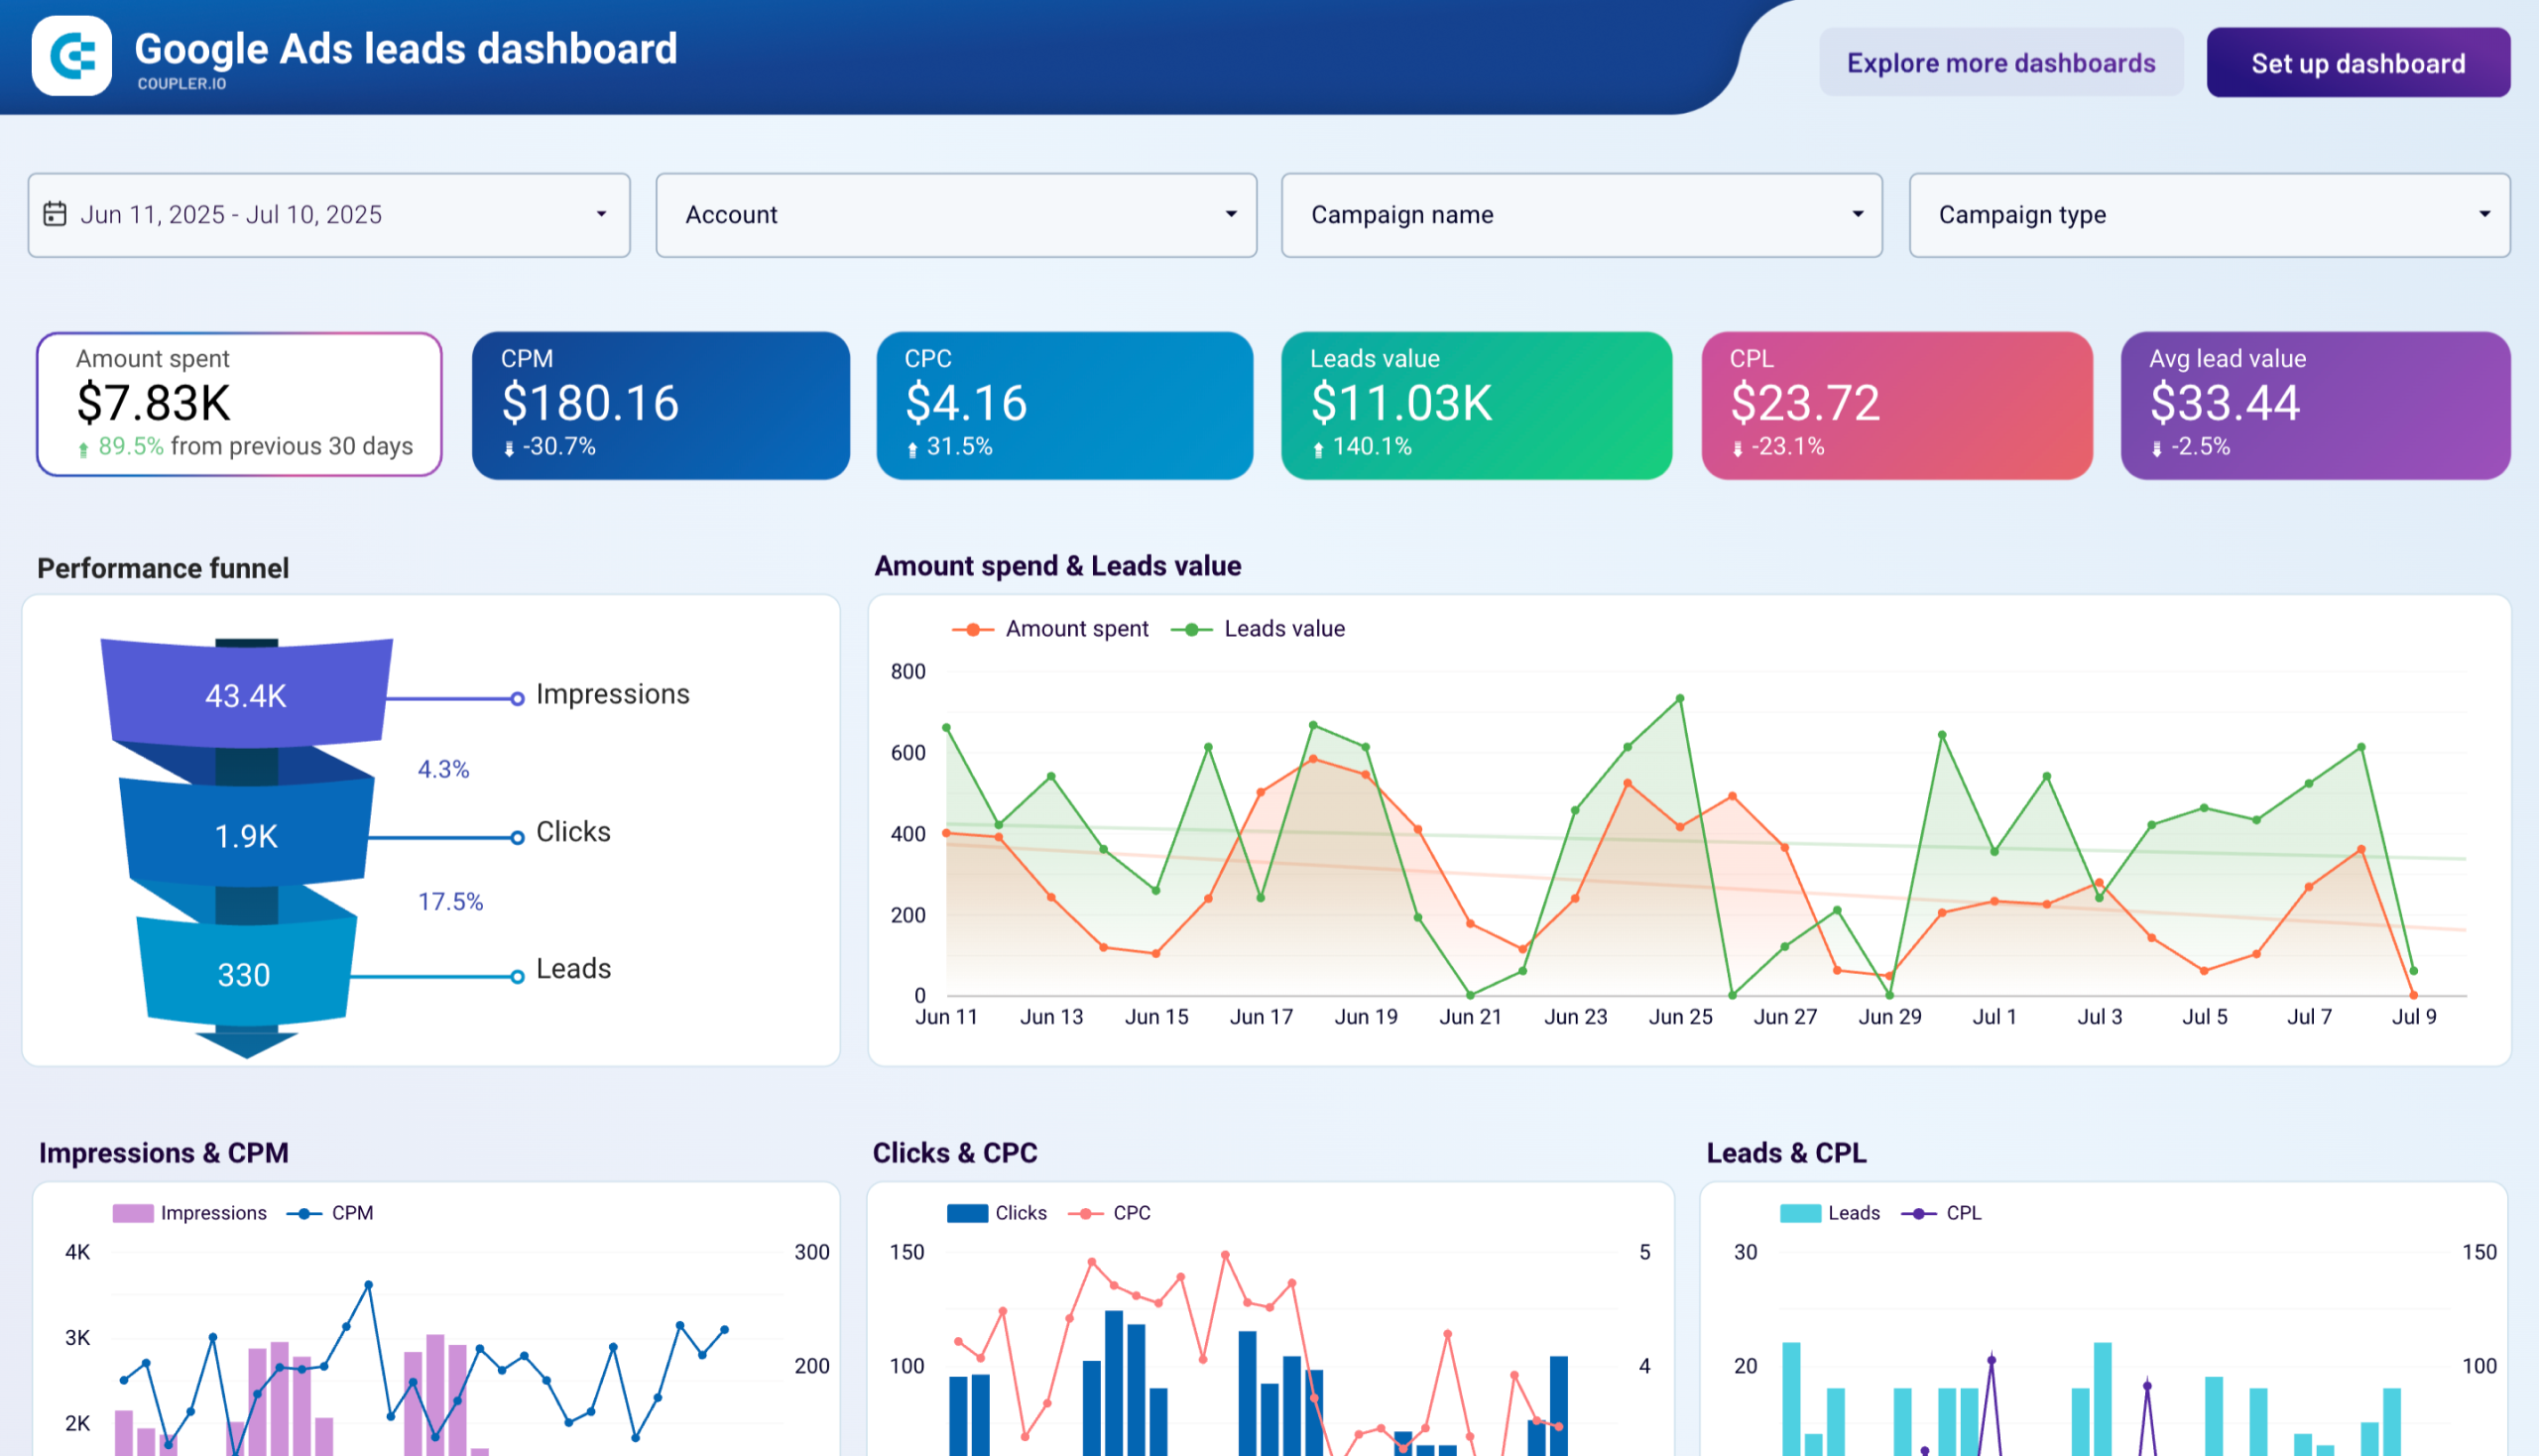
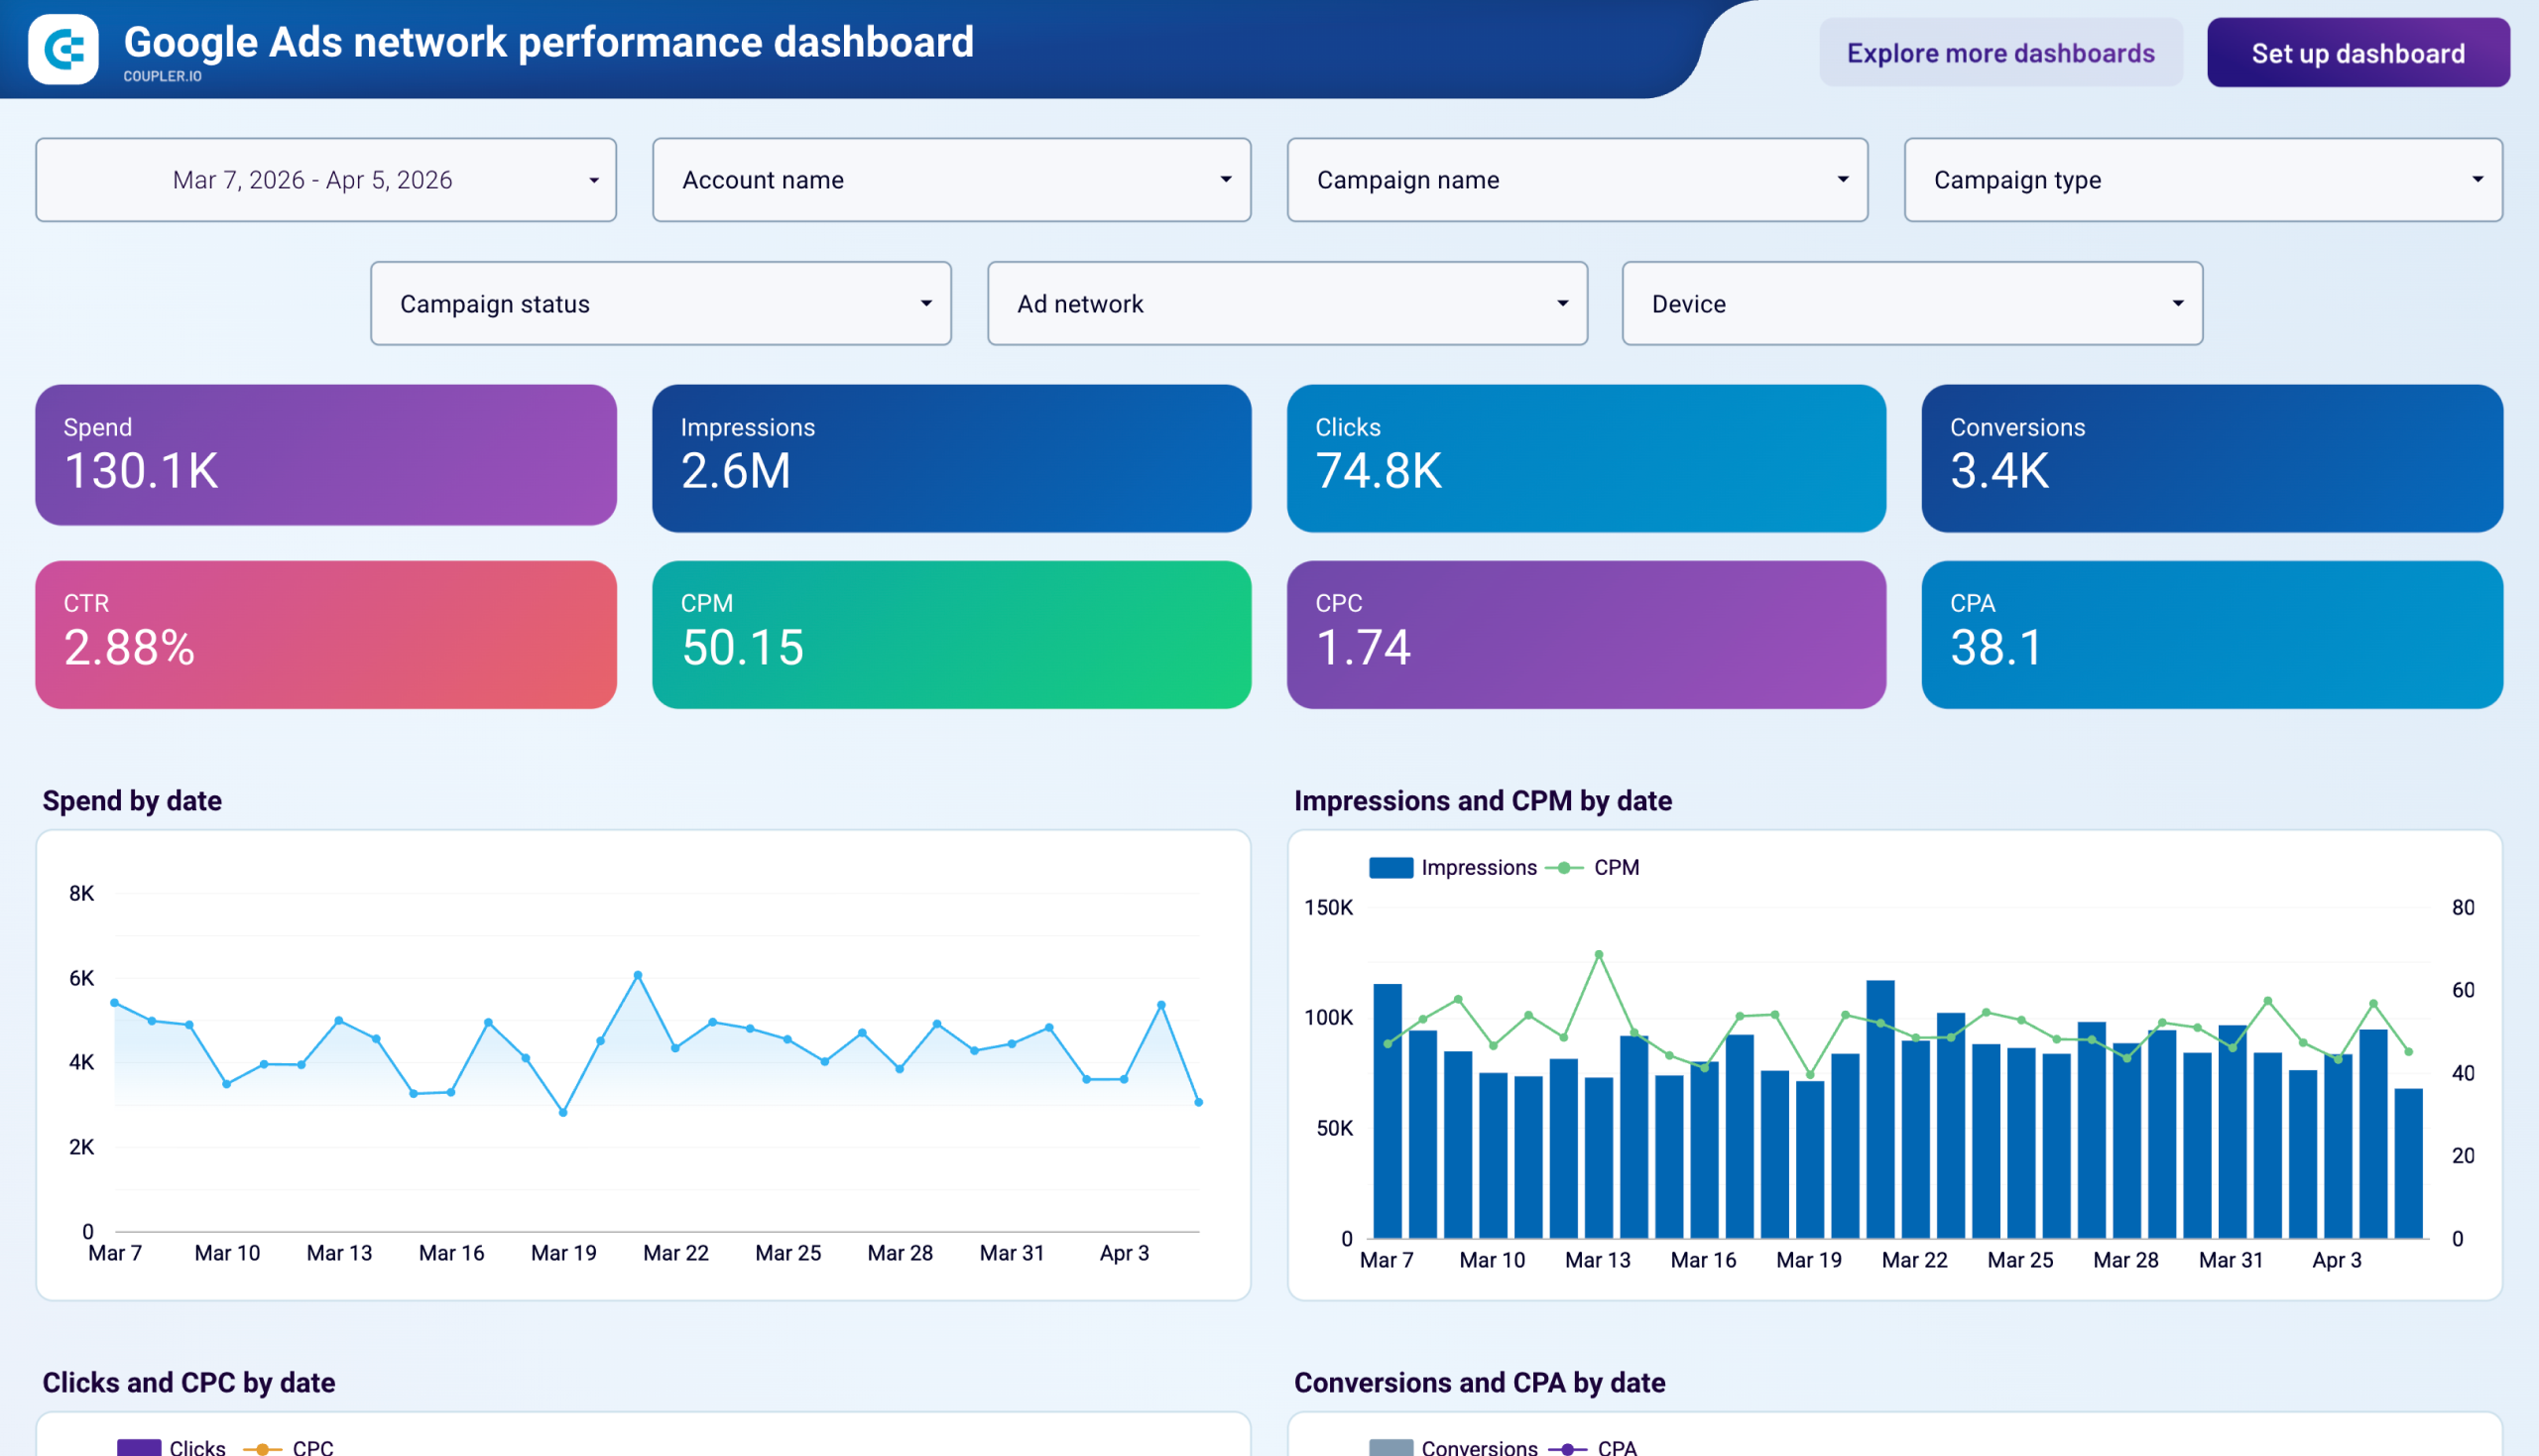
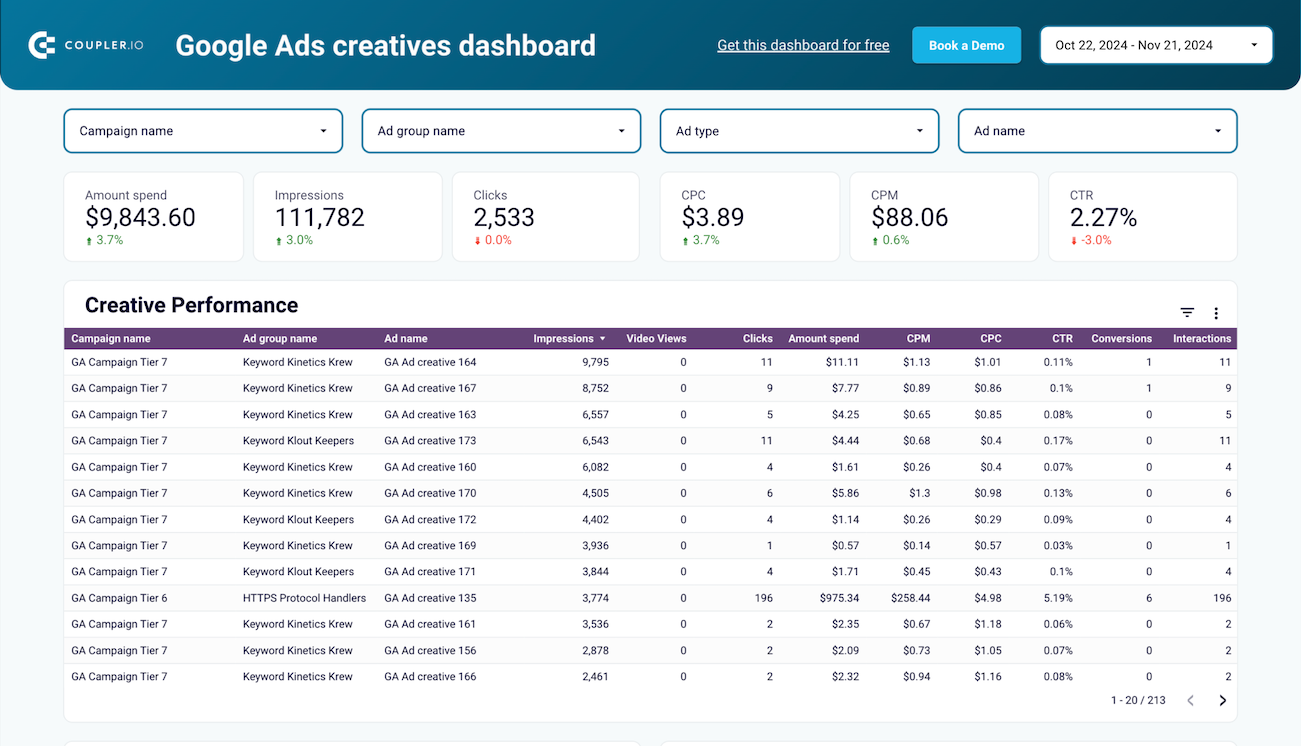
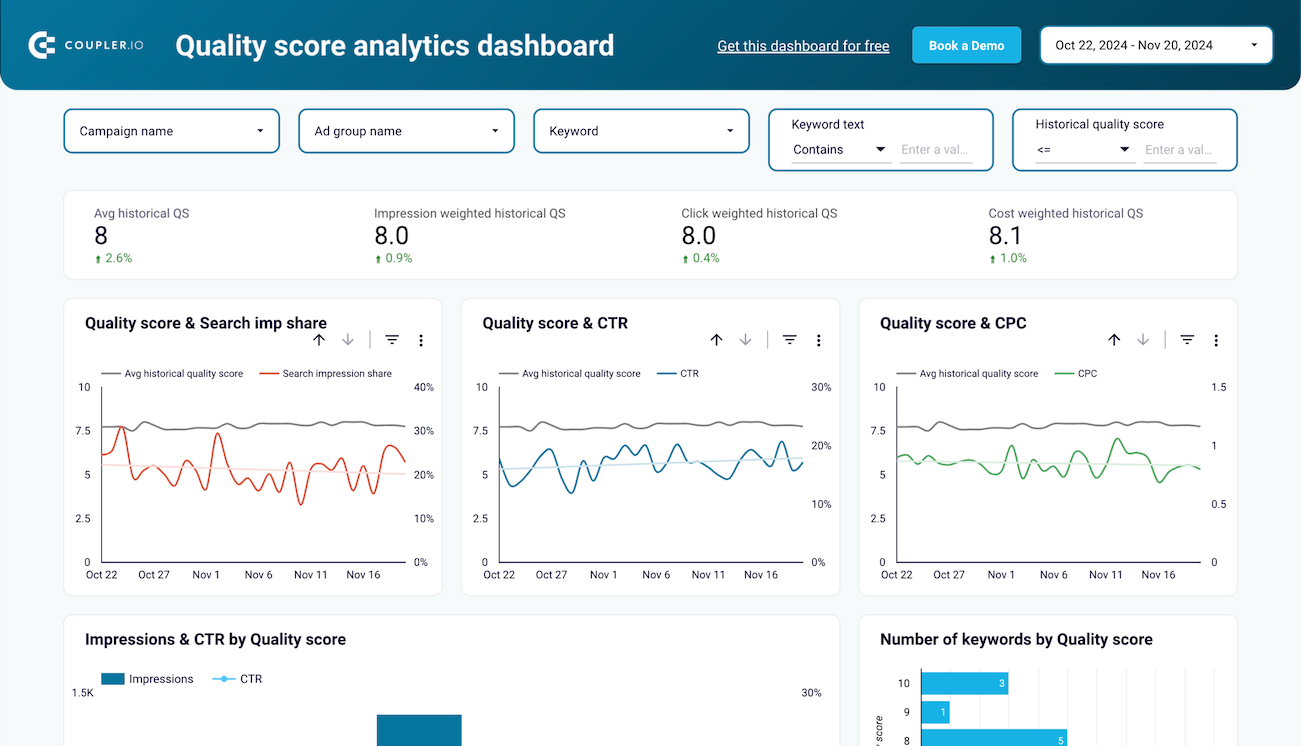
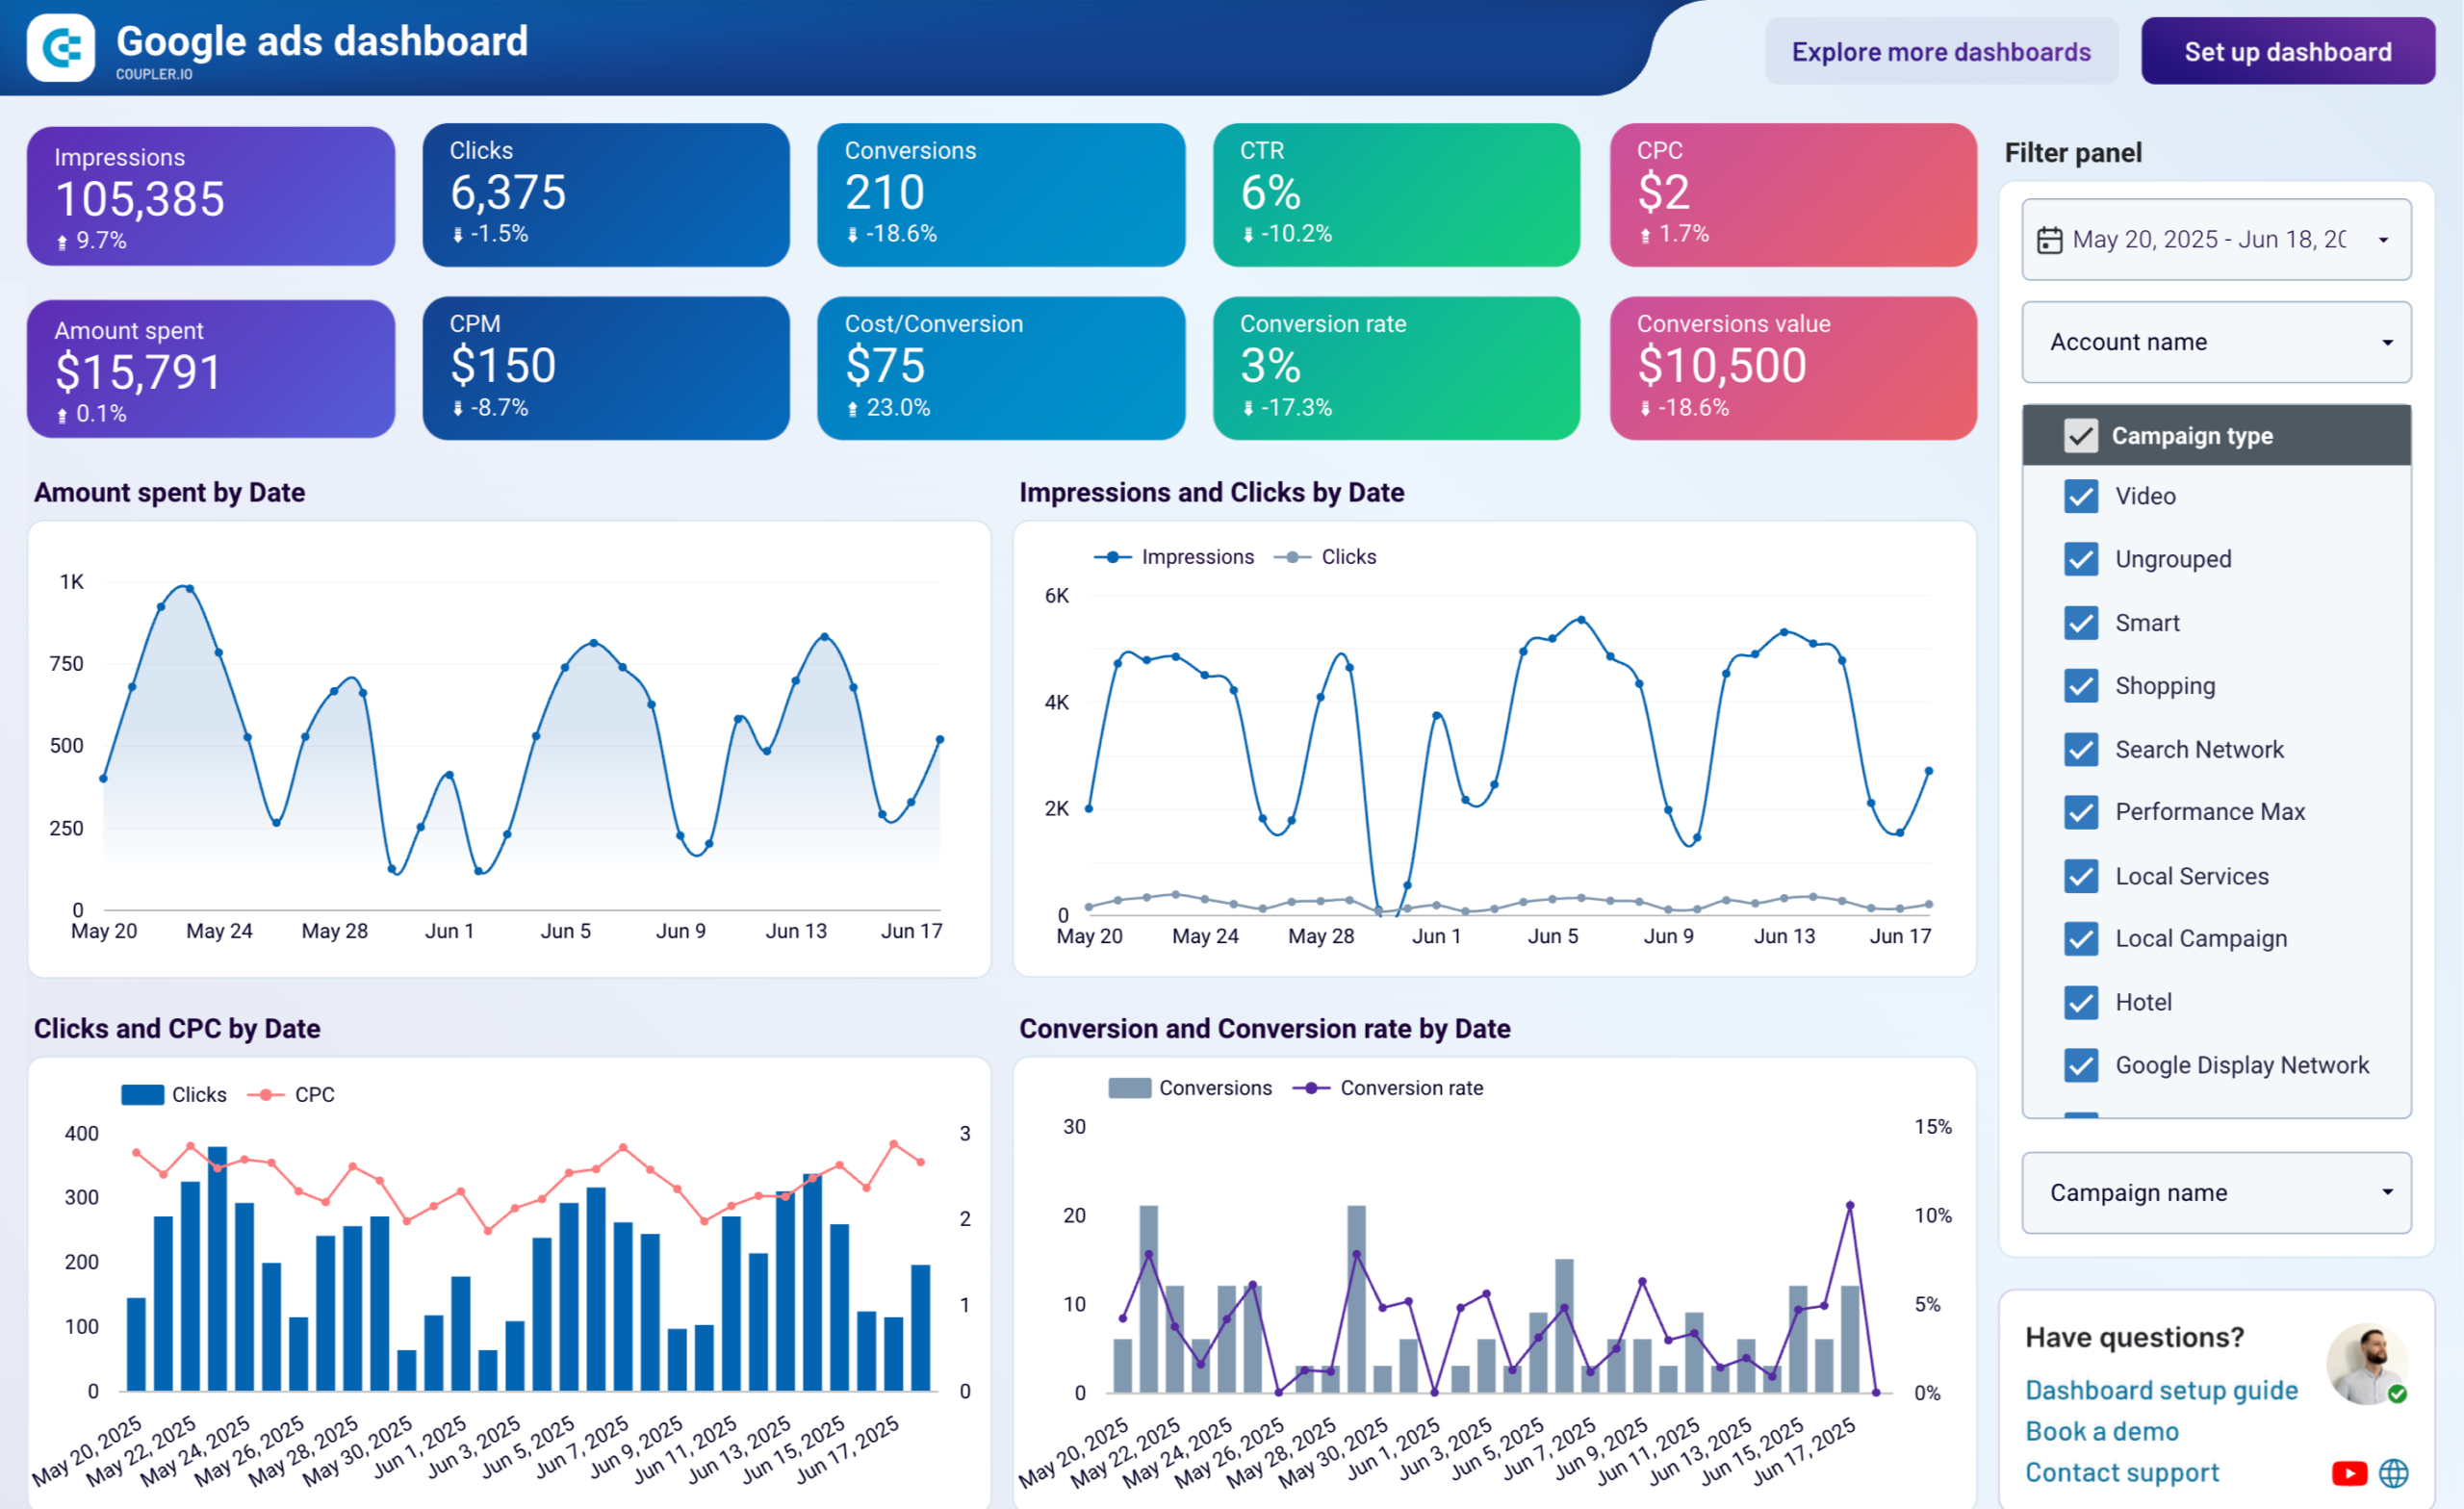
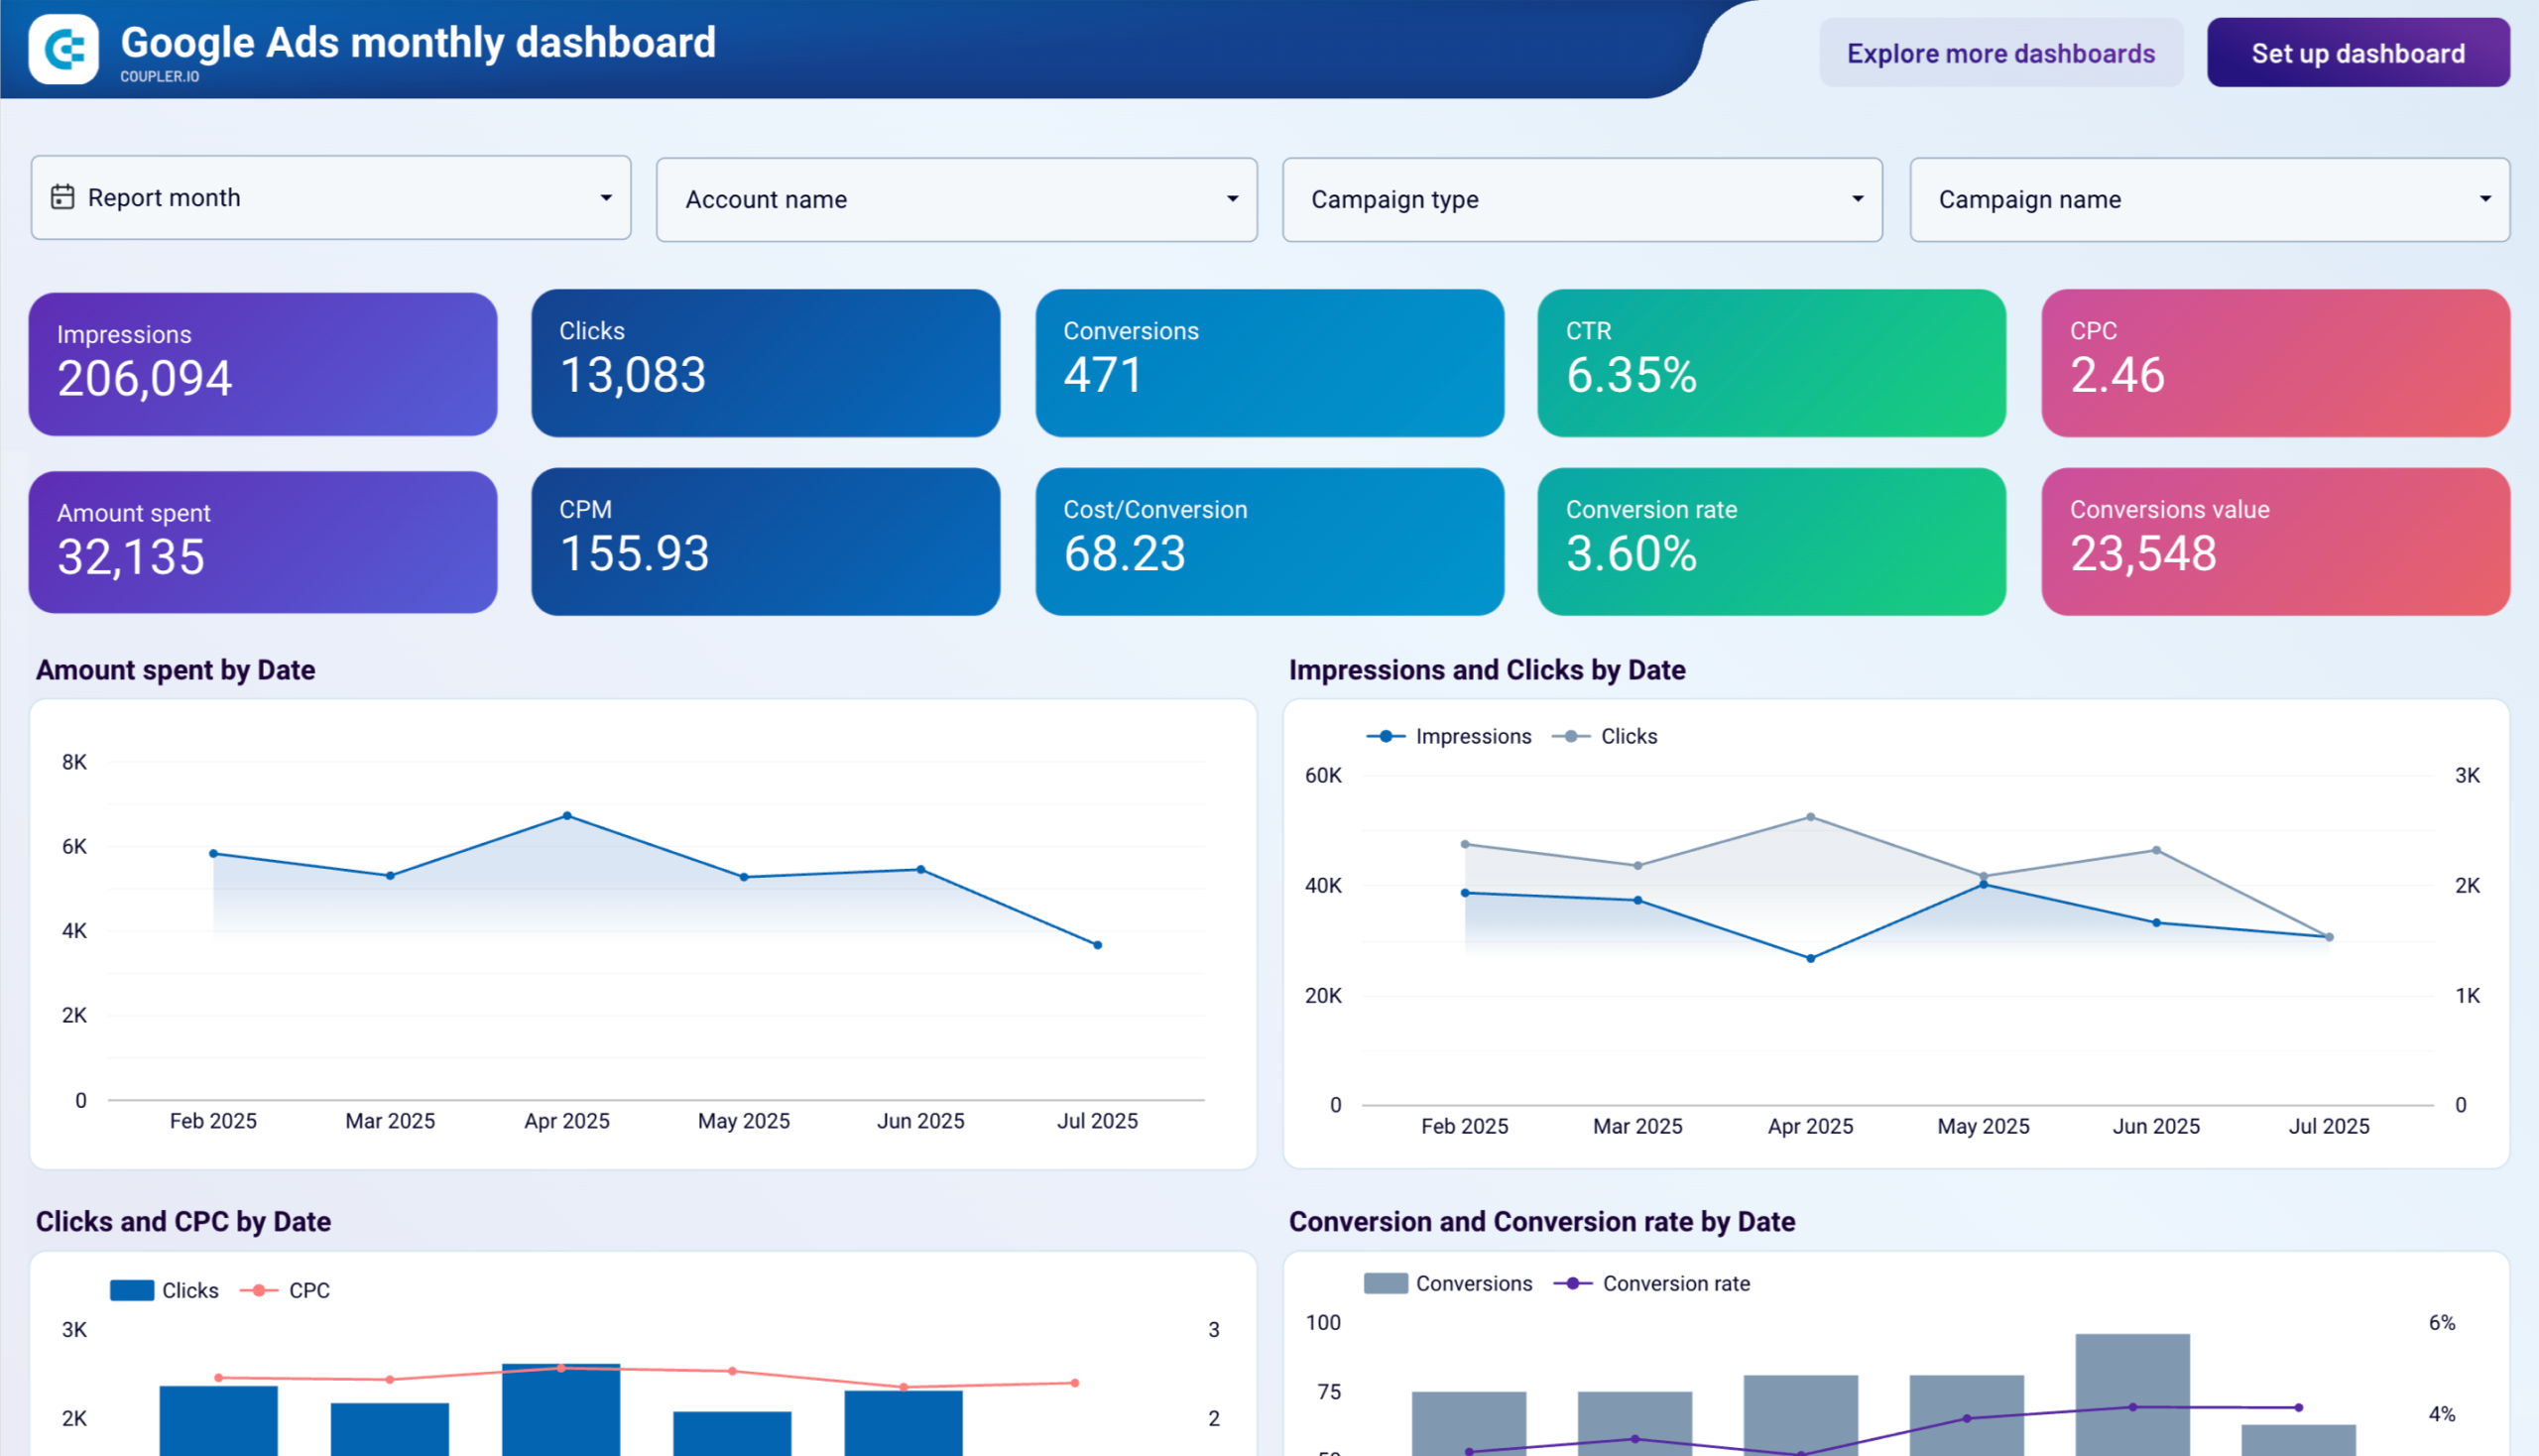
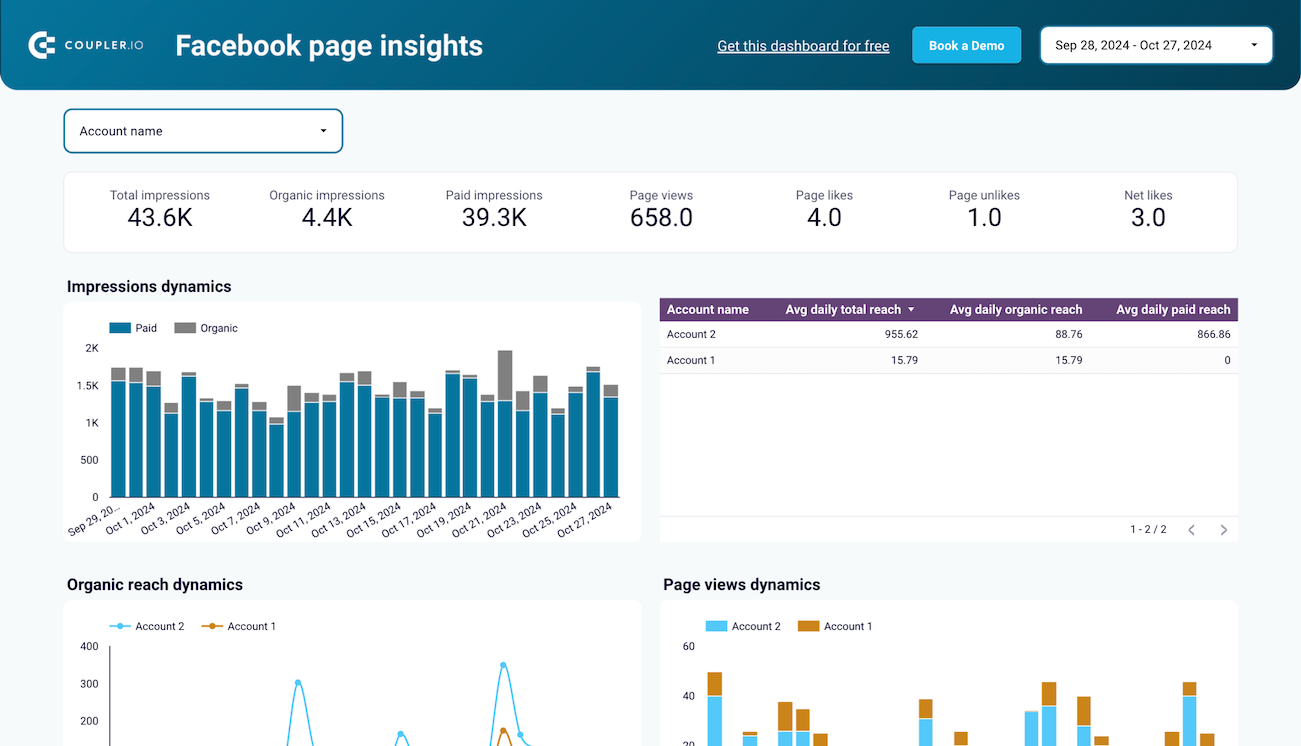
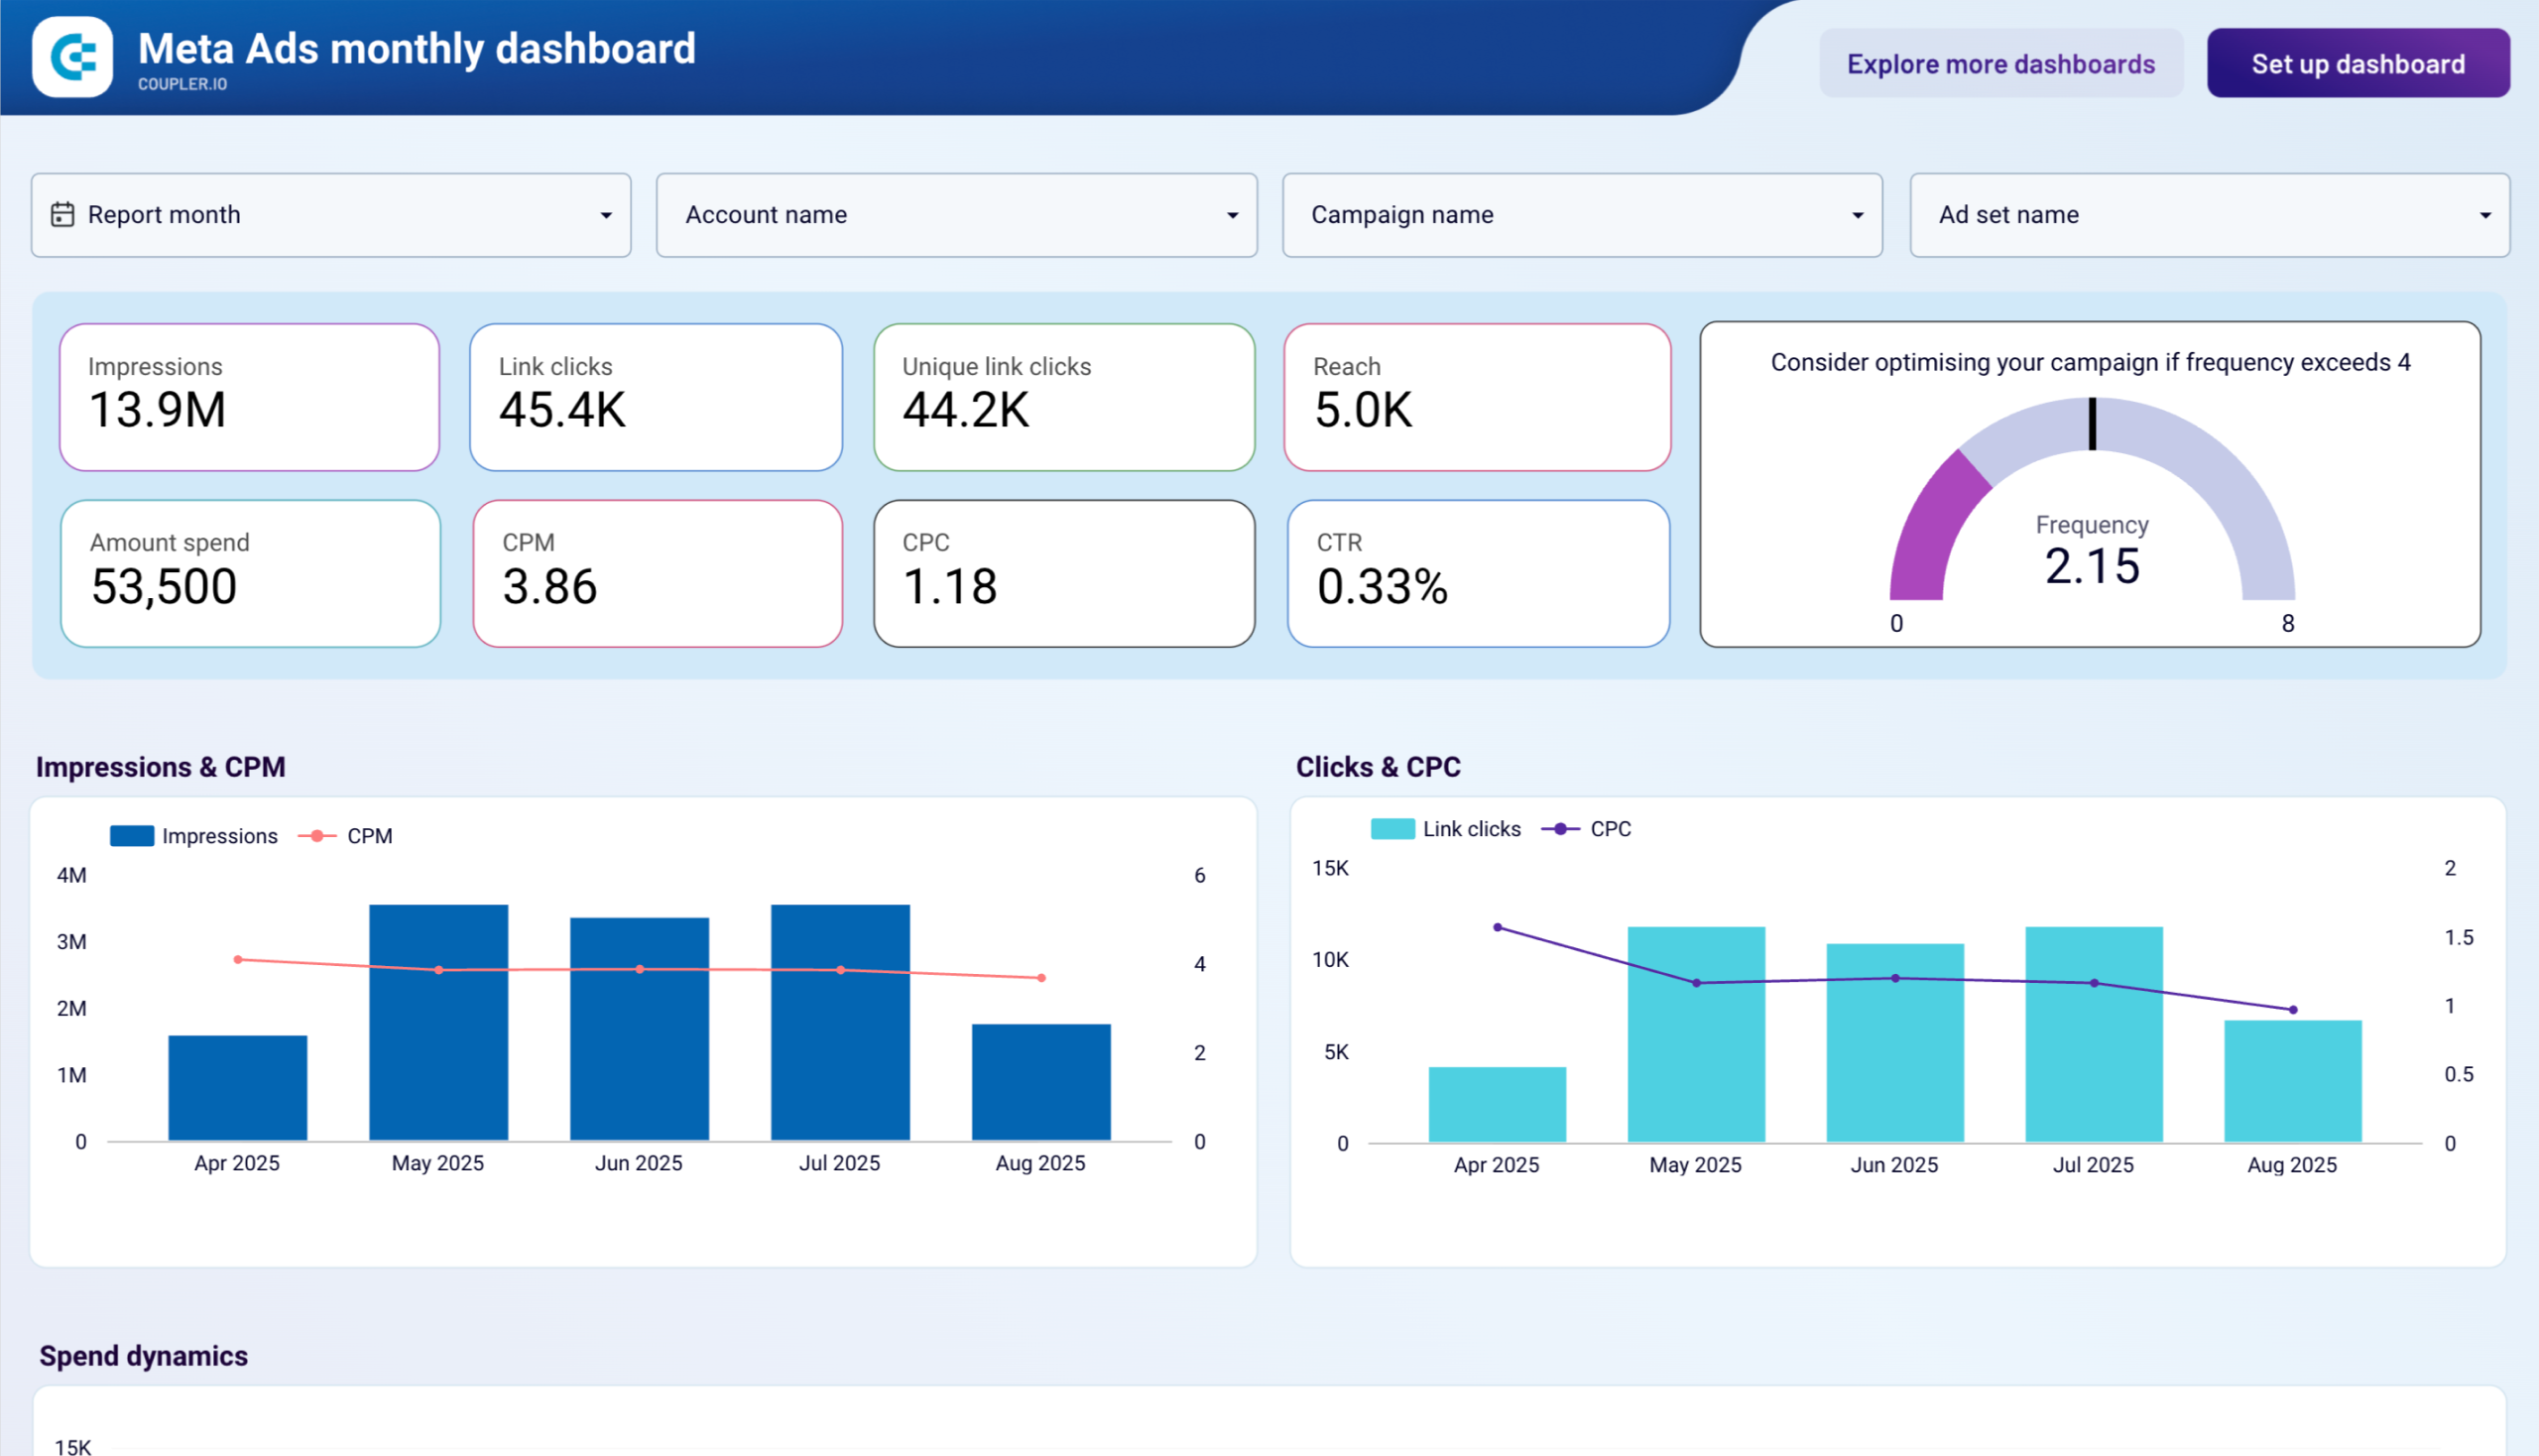
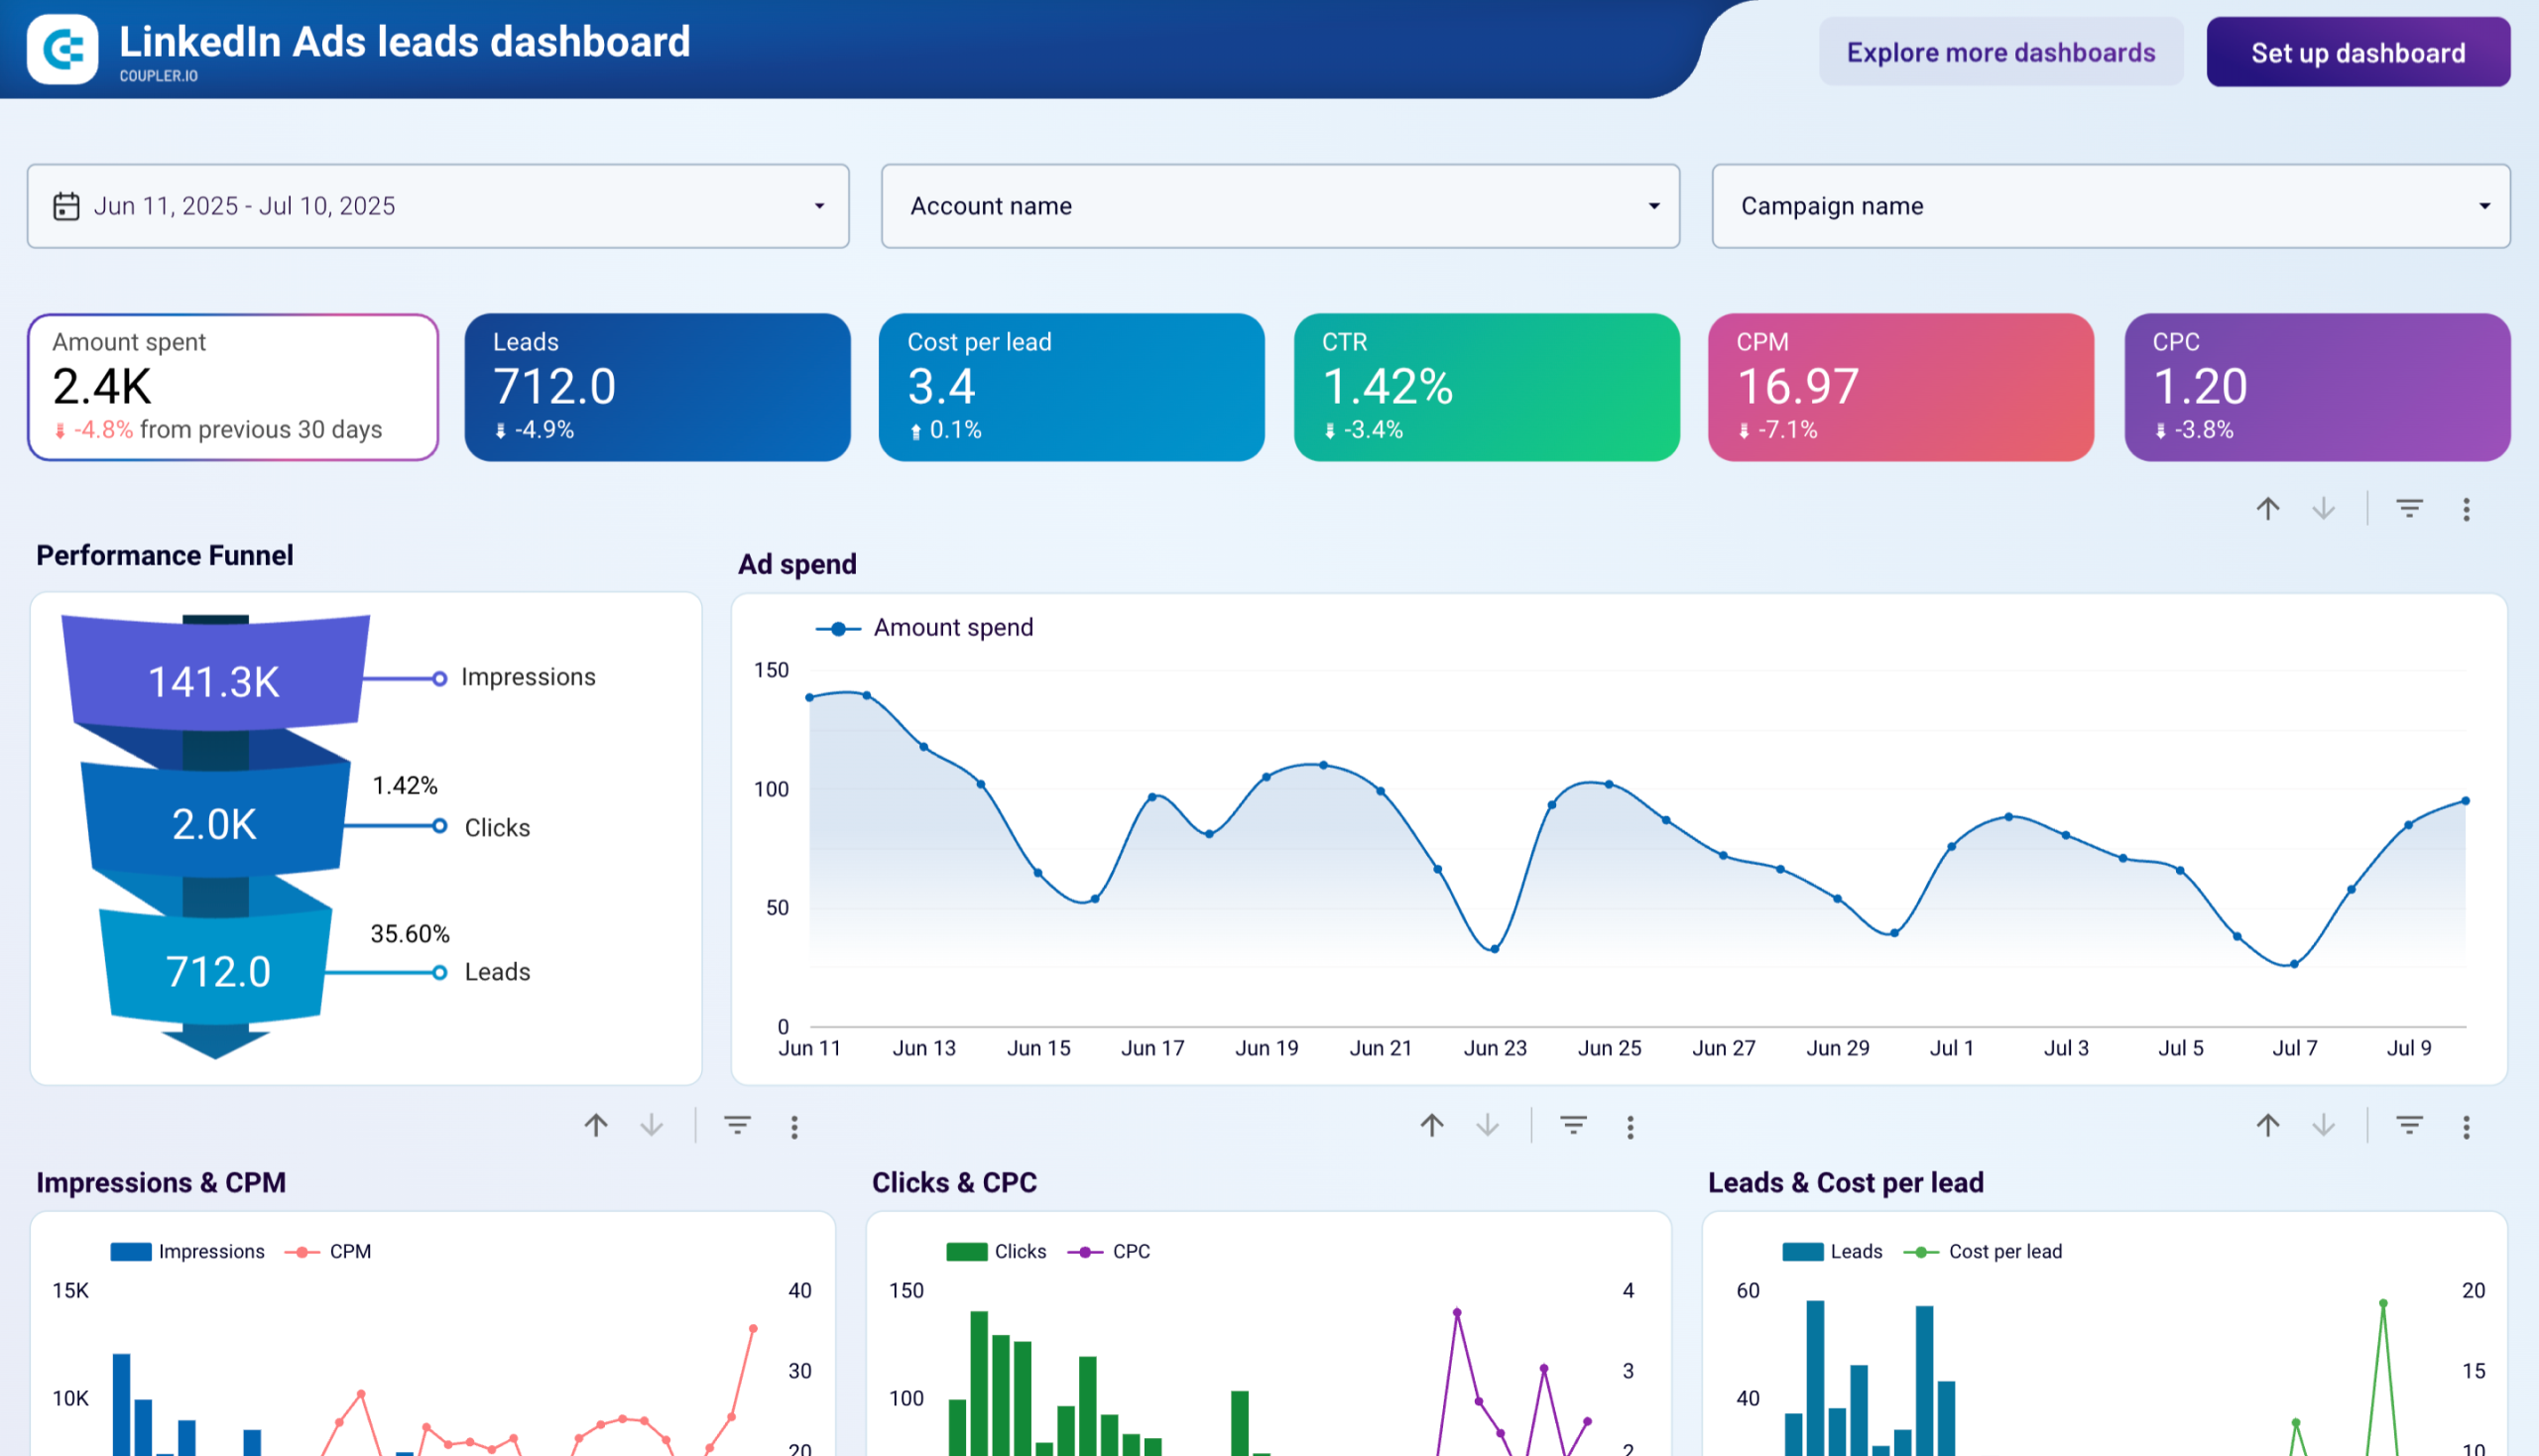
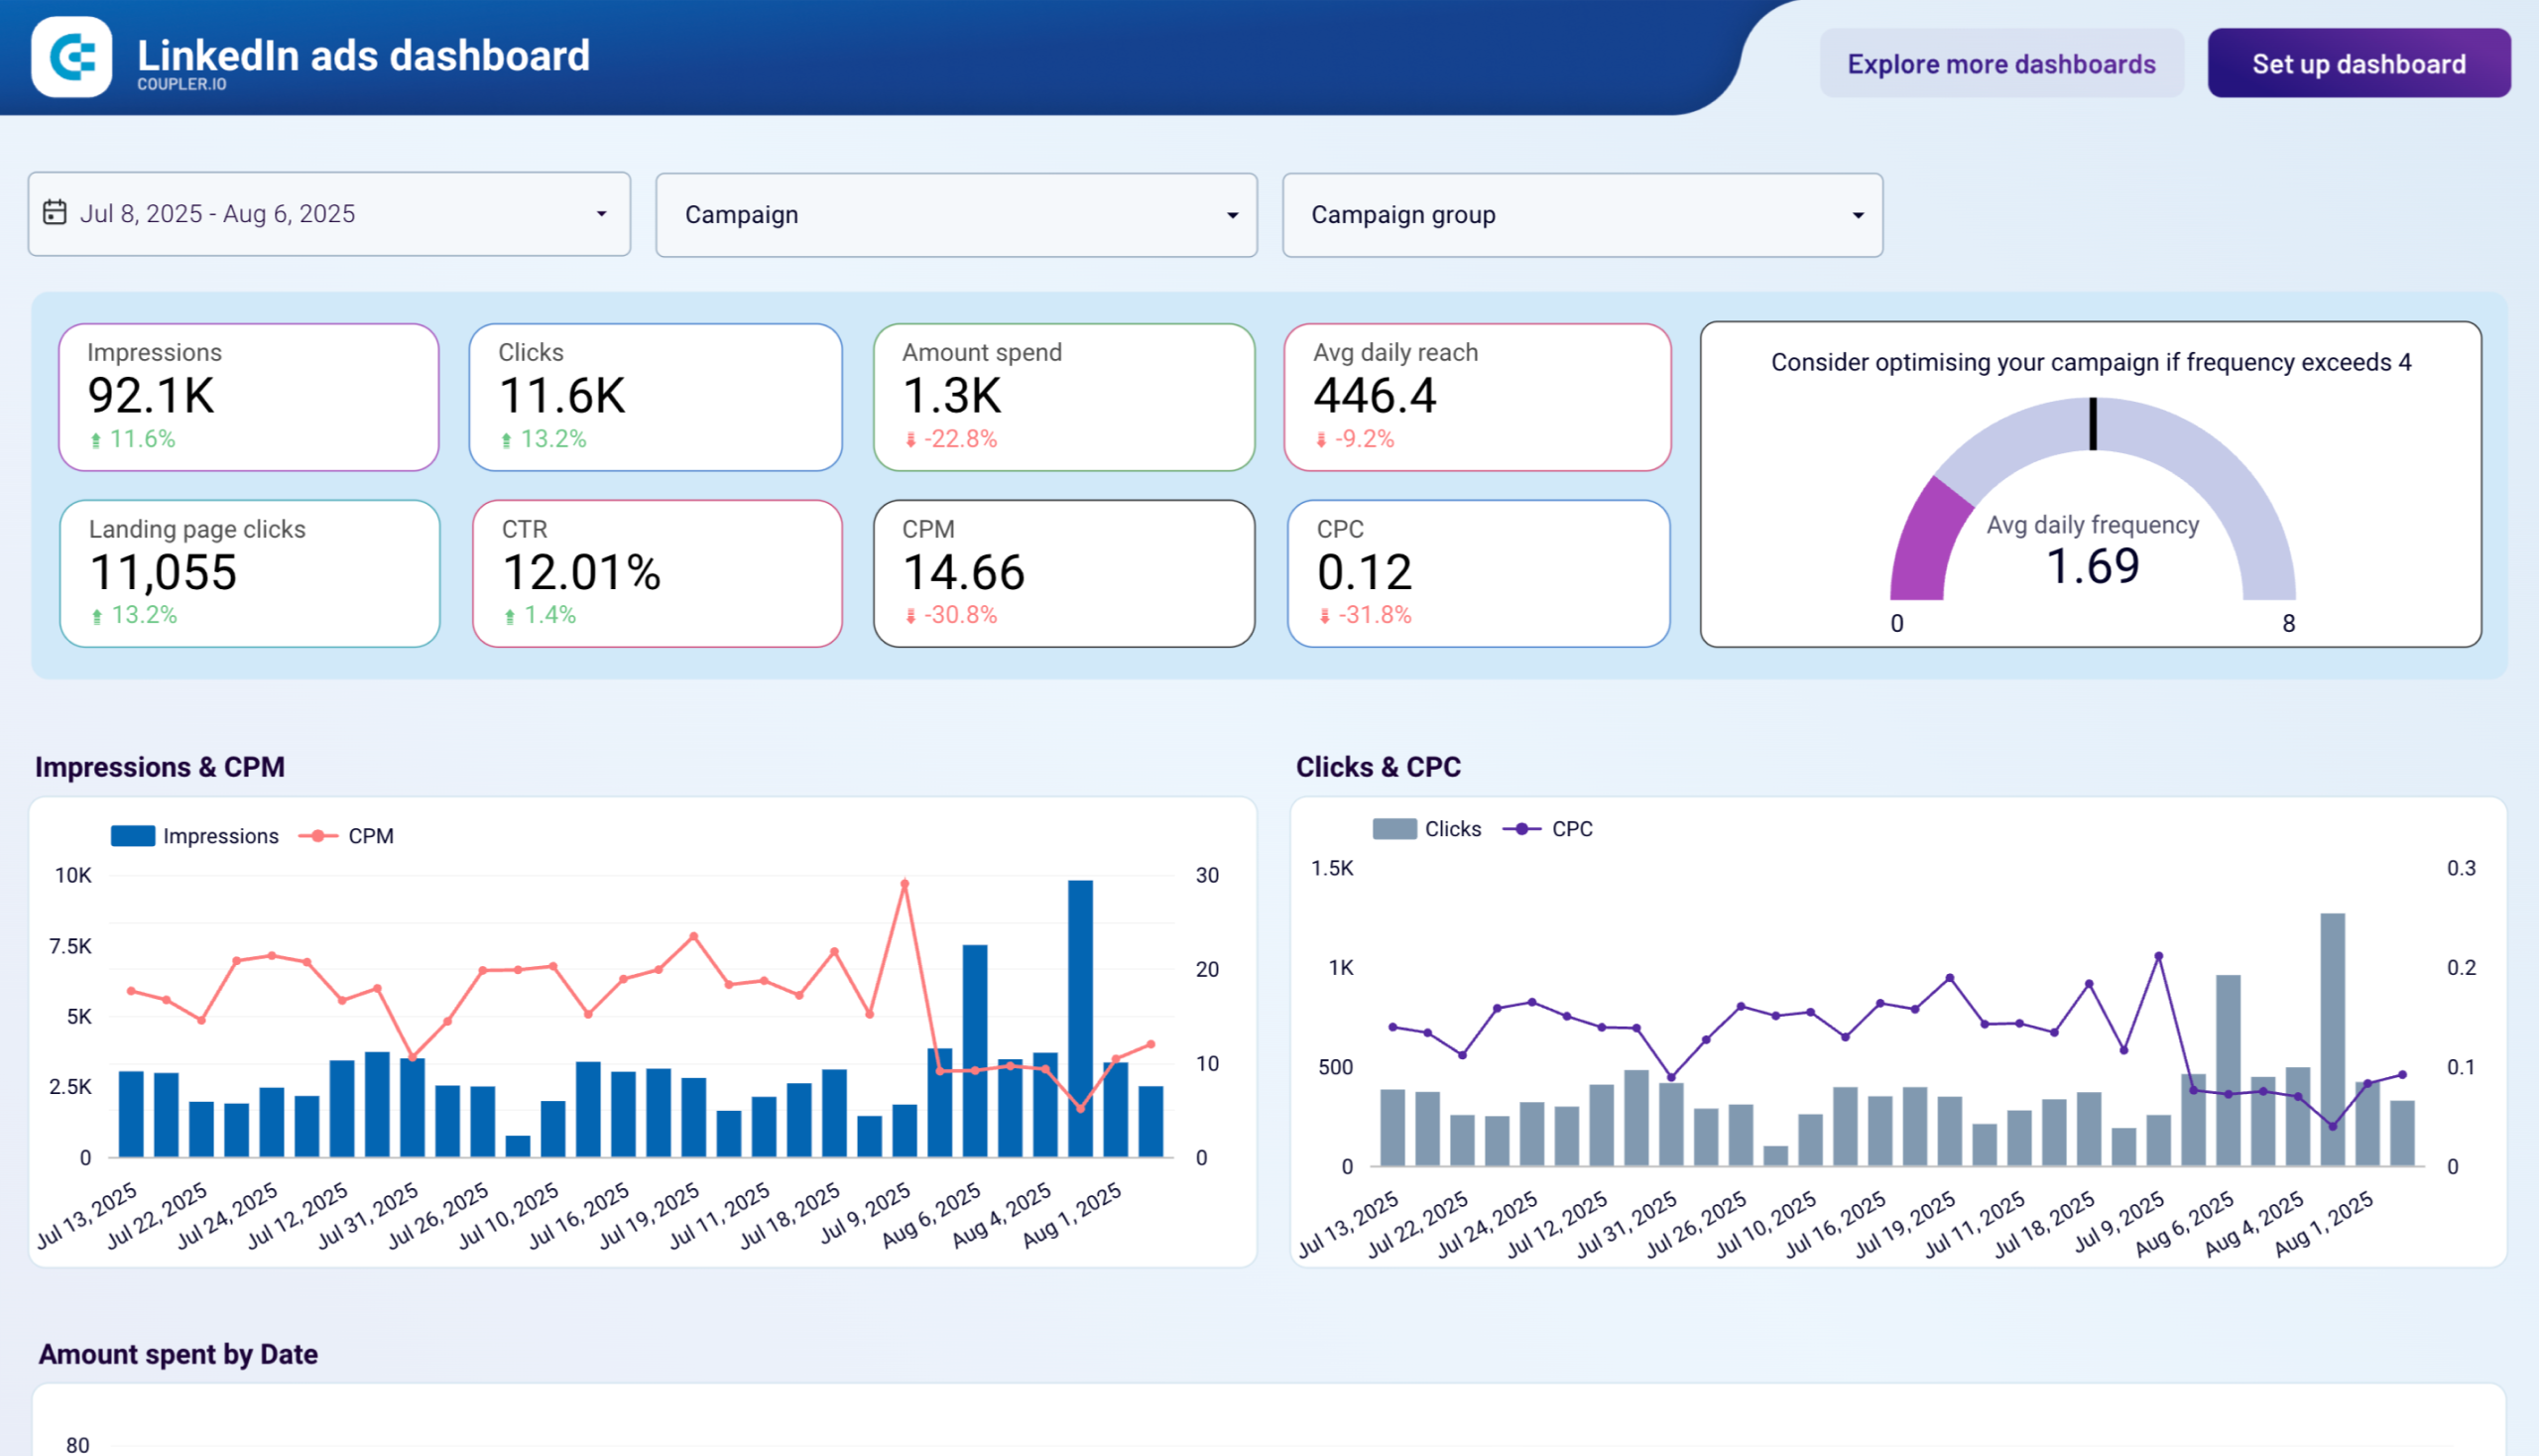
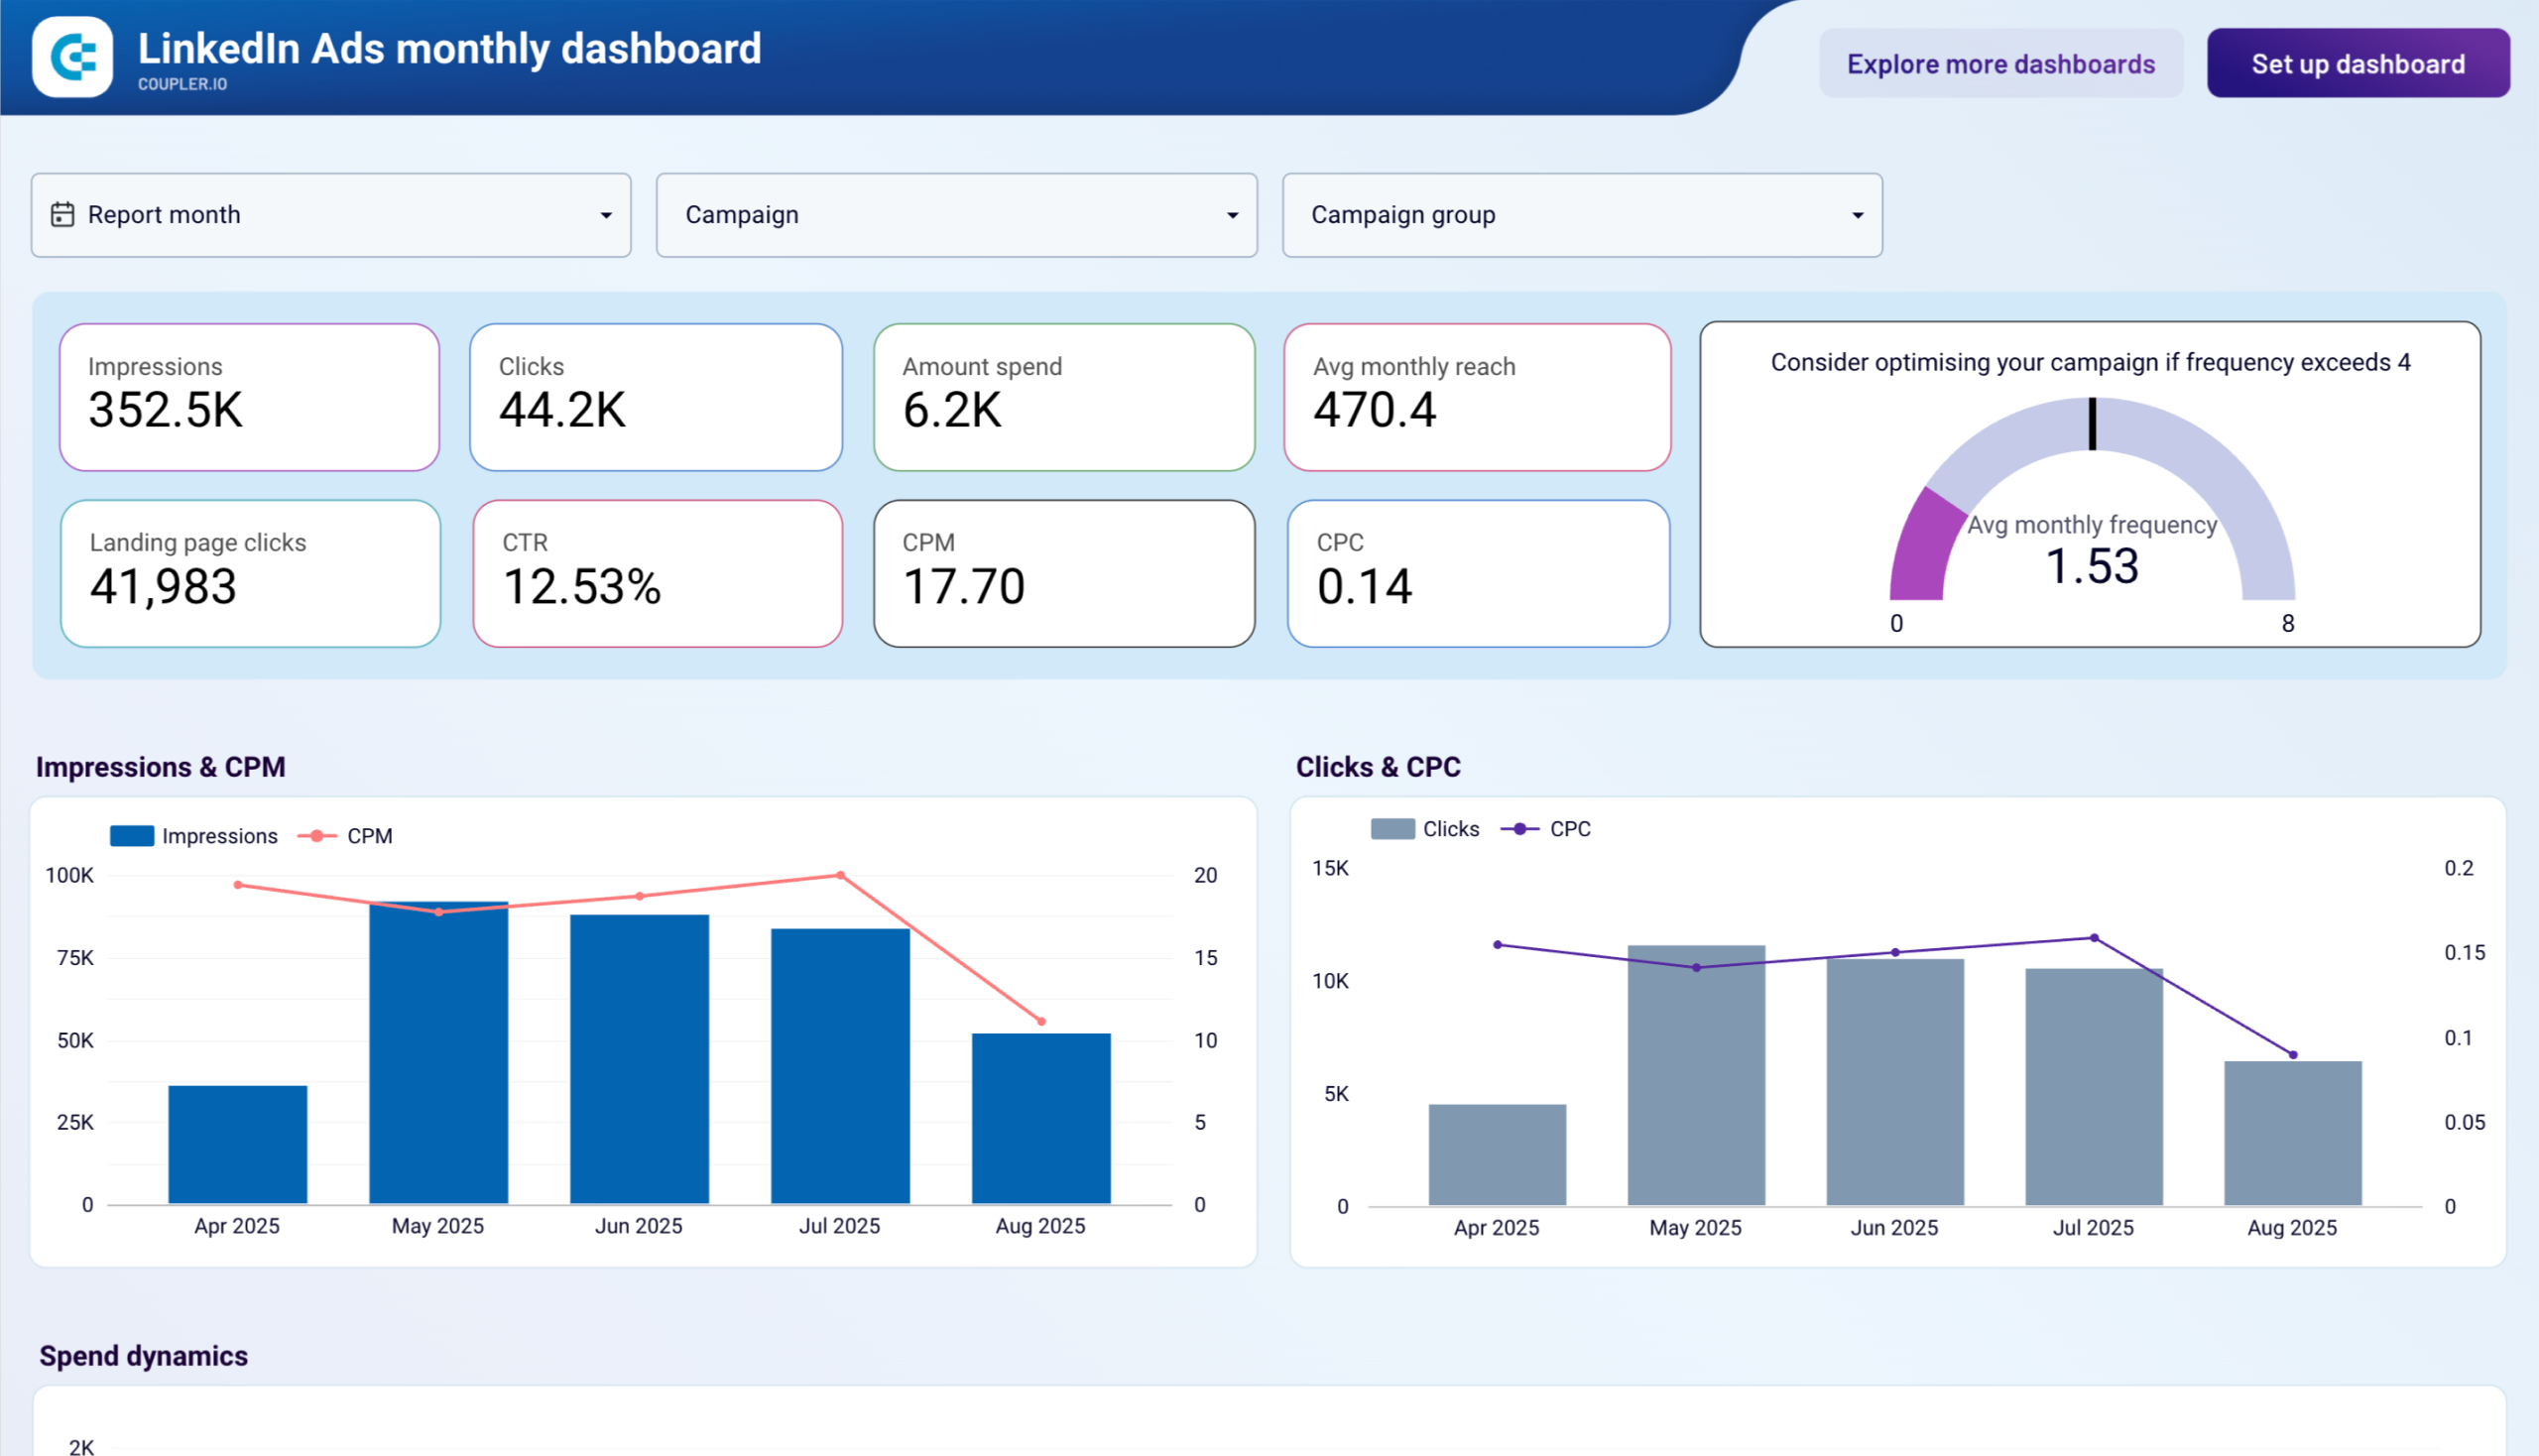
Advertising and marketing report templates consolidate campaign performance from multiple platforms into unified views. The PPC multichannel template combines data from Google Ads, LinkedIn Ads, Facebook Ads, Twitter Ads, TikTok Ads, and other channels so you can compare cost per click, conversion rates, and return on ad spend without switching between interfaces. Platform-specific Looker Studio report templates provide deeper analysis for individual channels: the Google Ads template offers demographic breakdowns and conversion funnel visualization, while the LinkedIn Ads template tracks frequency metrics and lead form progression. The brand awareness template correlates advertising impressions across platforms with branded keyword searches from Google Search Console, revealing how campaigns influence organic visibility. Templates for Facebook Ads leads, TikTok Ads performance, and Snapchat Ads metrics address channel-specific analytics needs with pre-configured visualizations.

Financial performance report

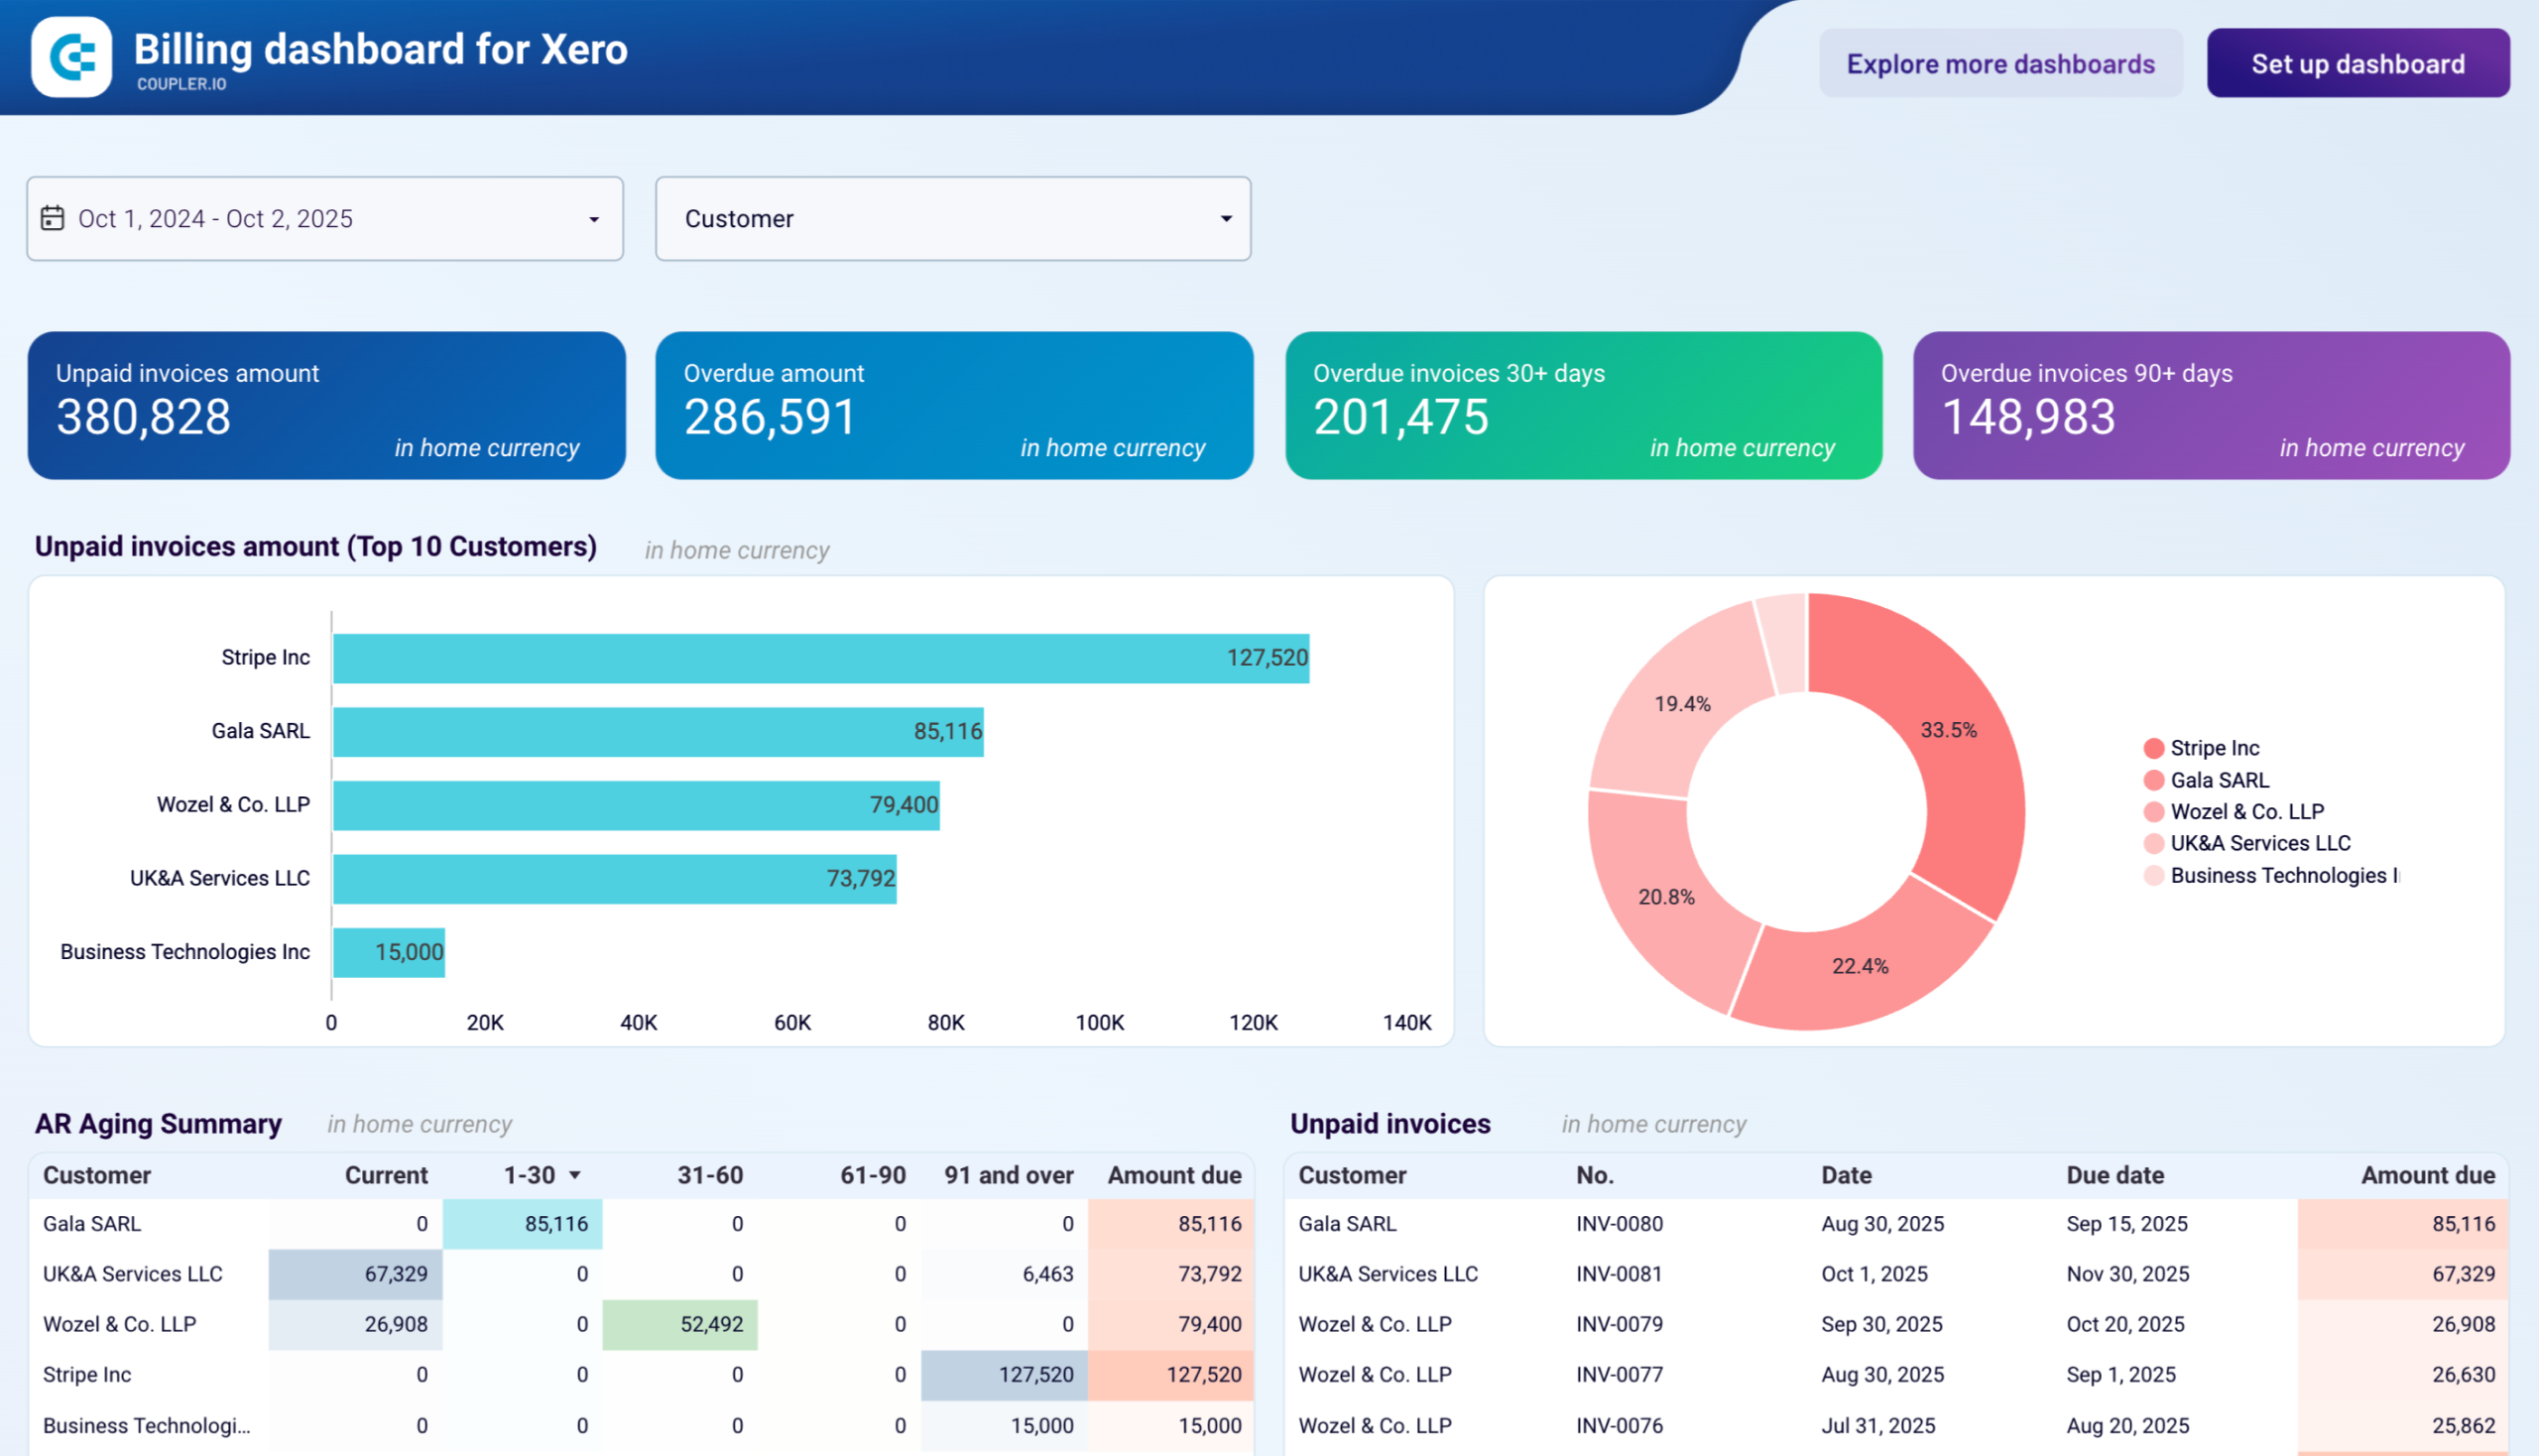
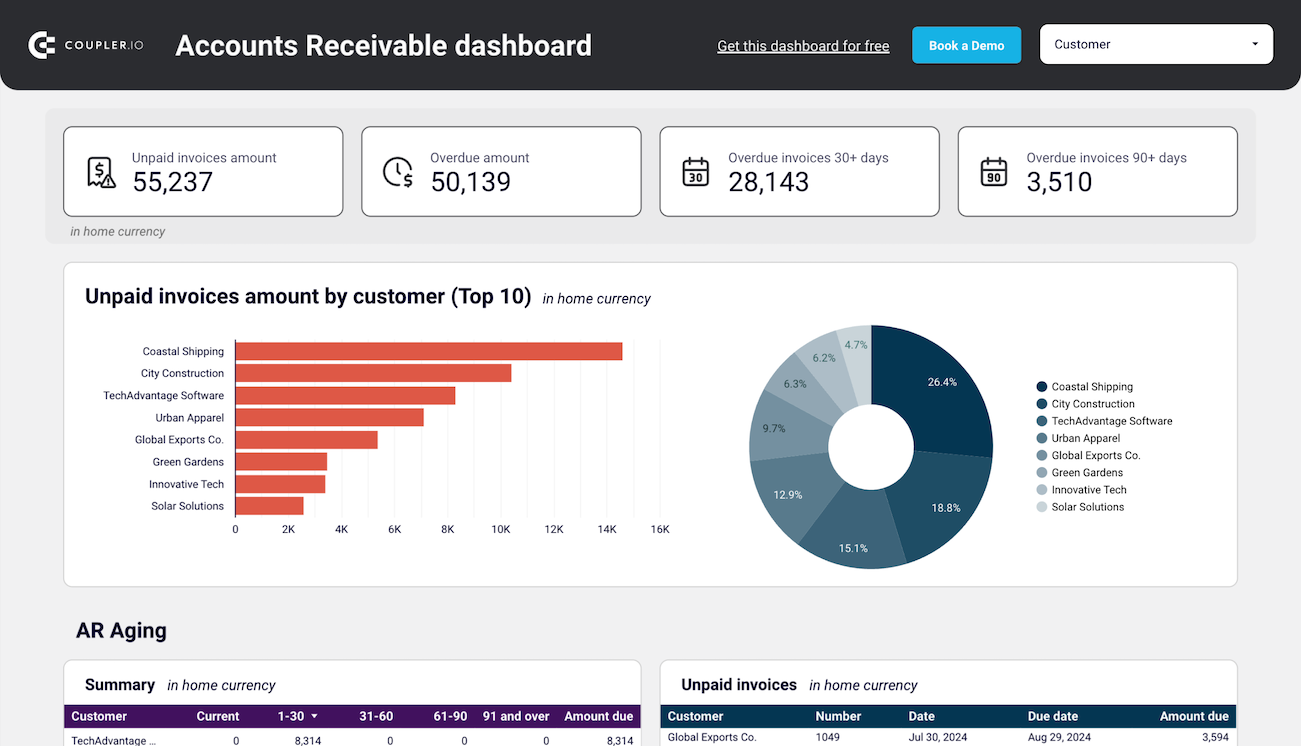
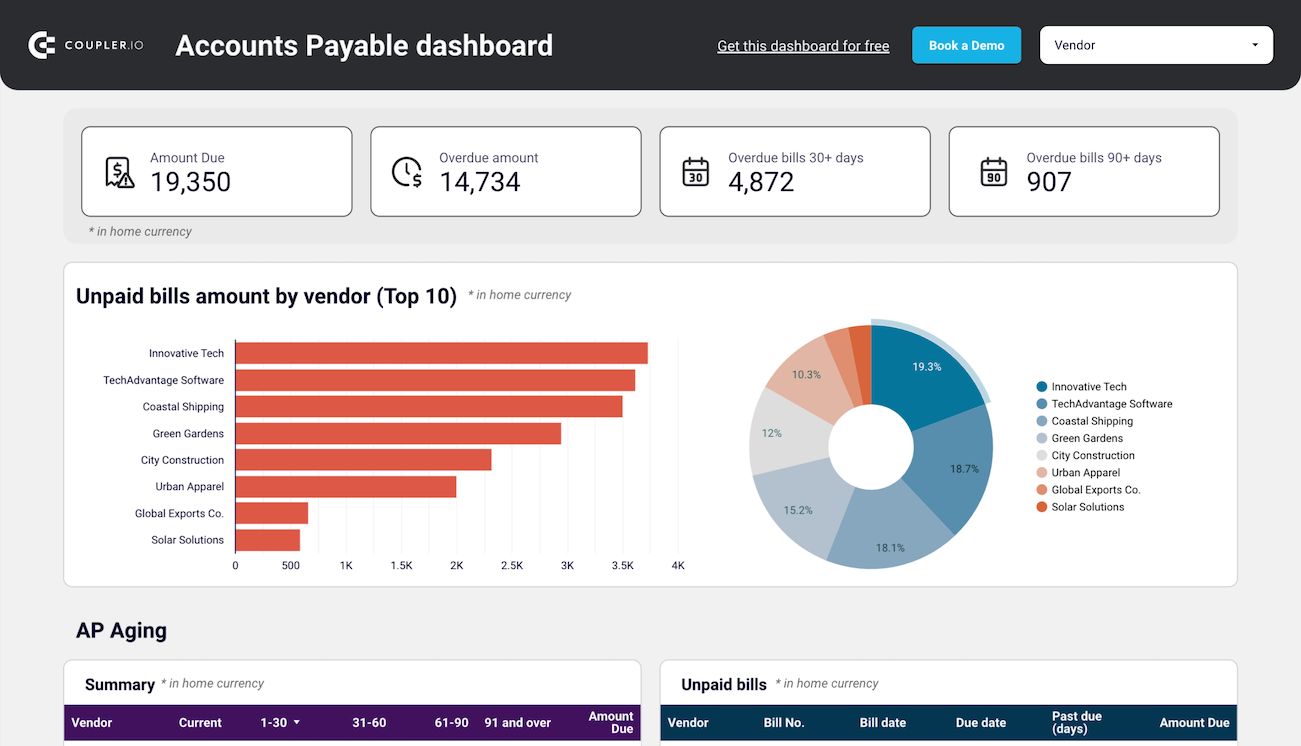
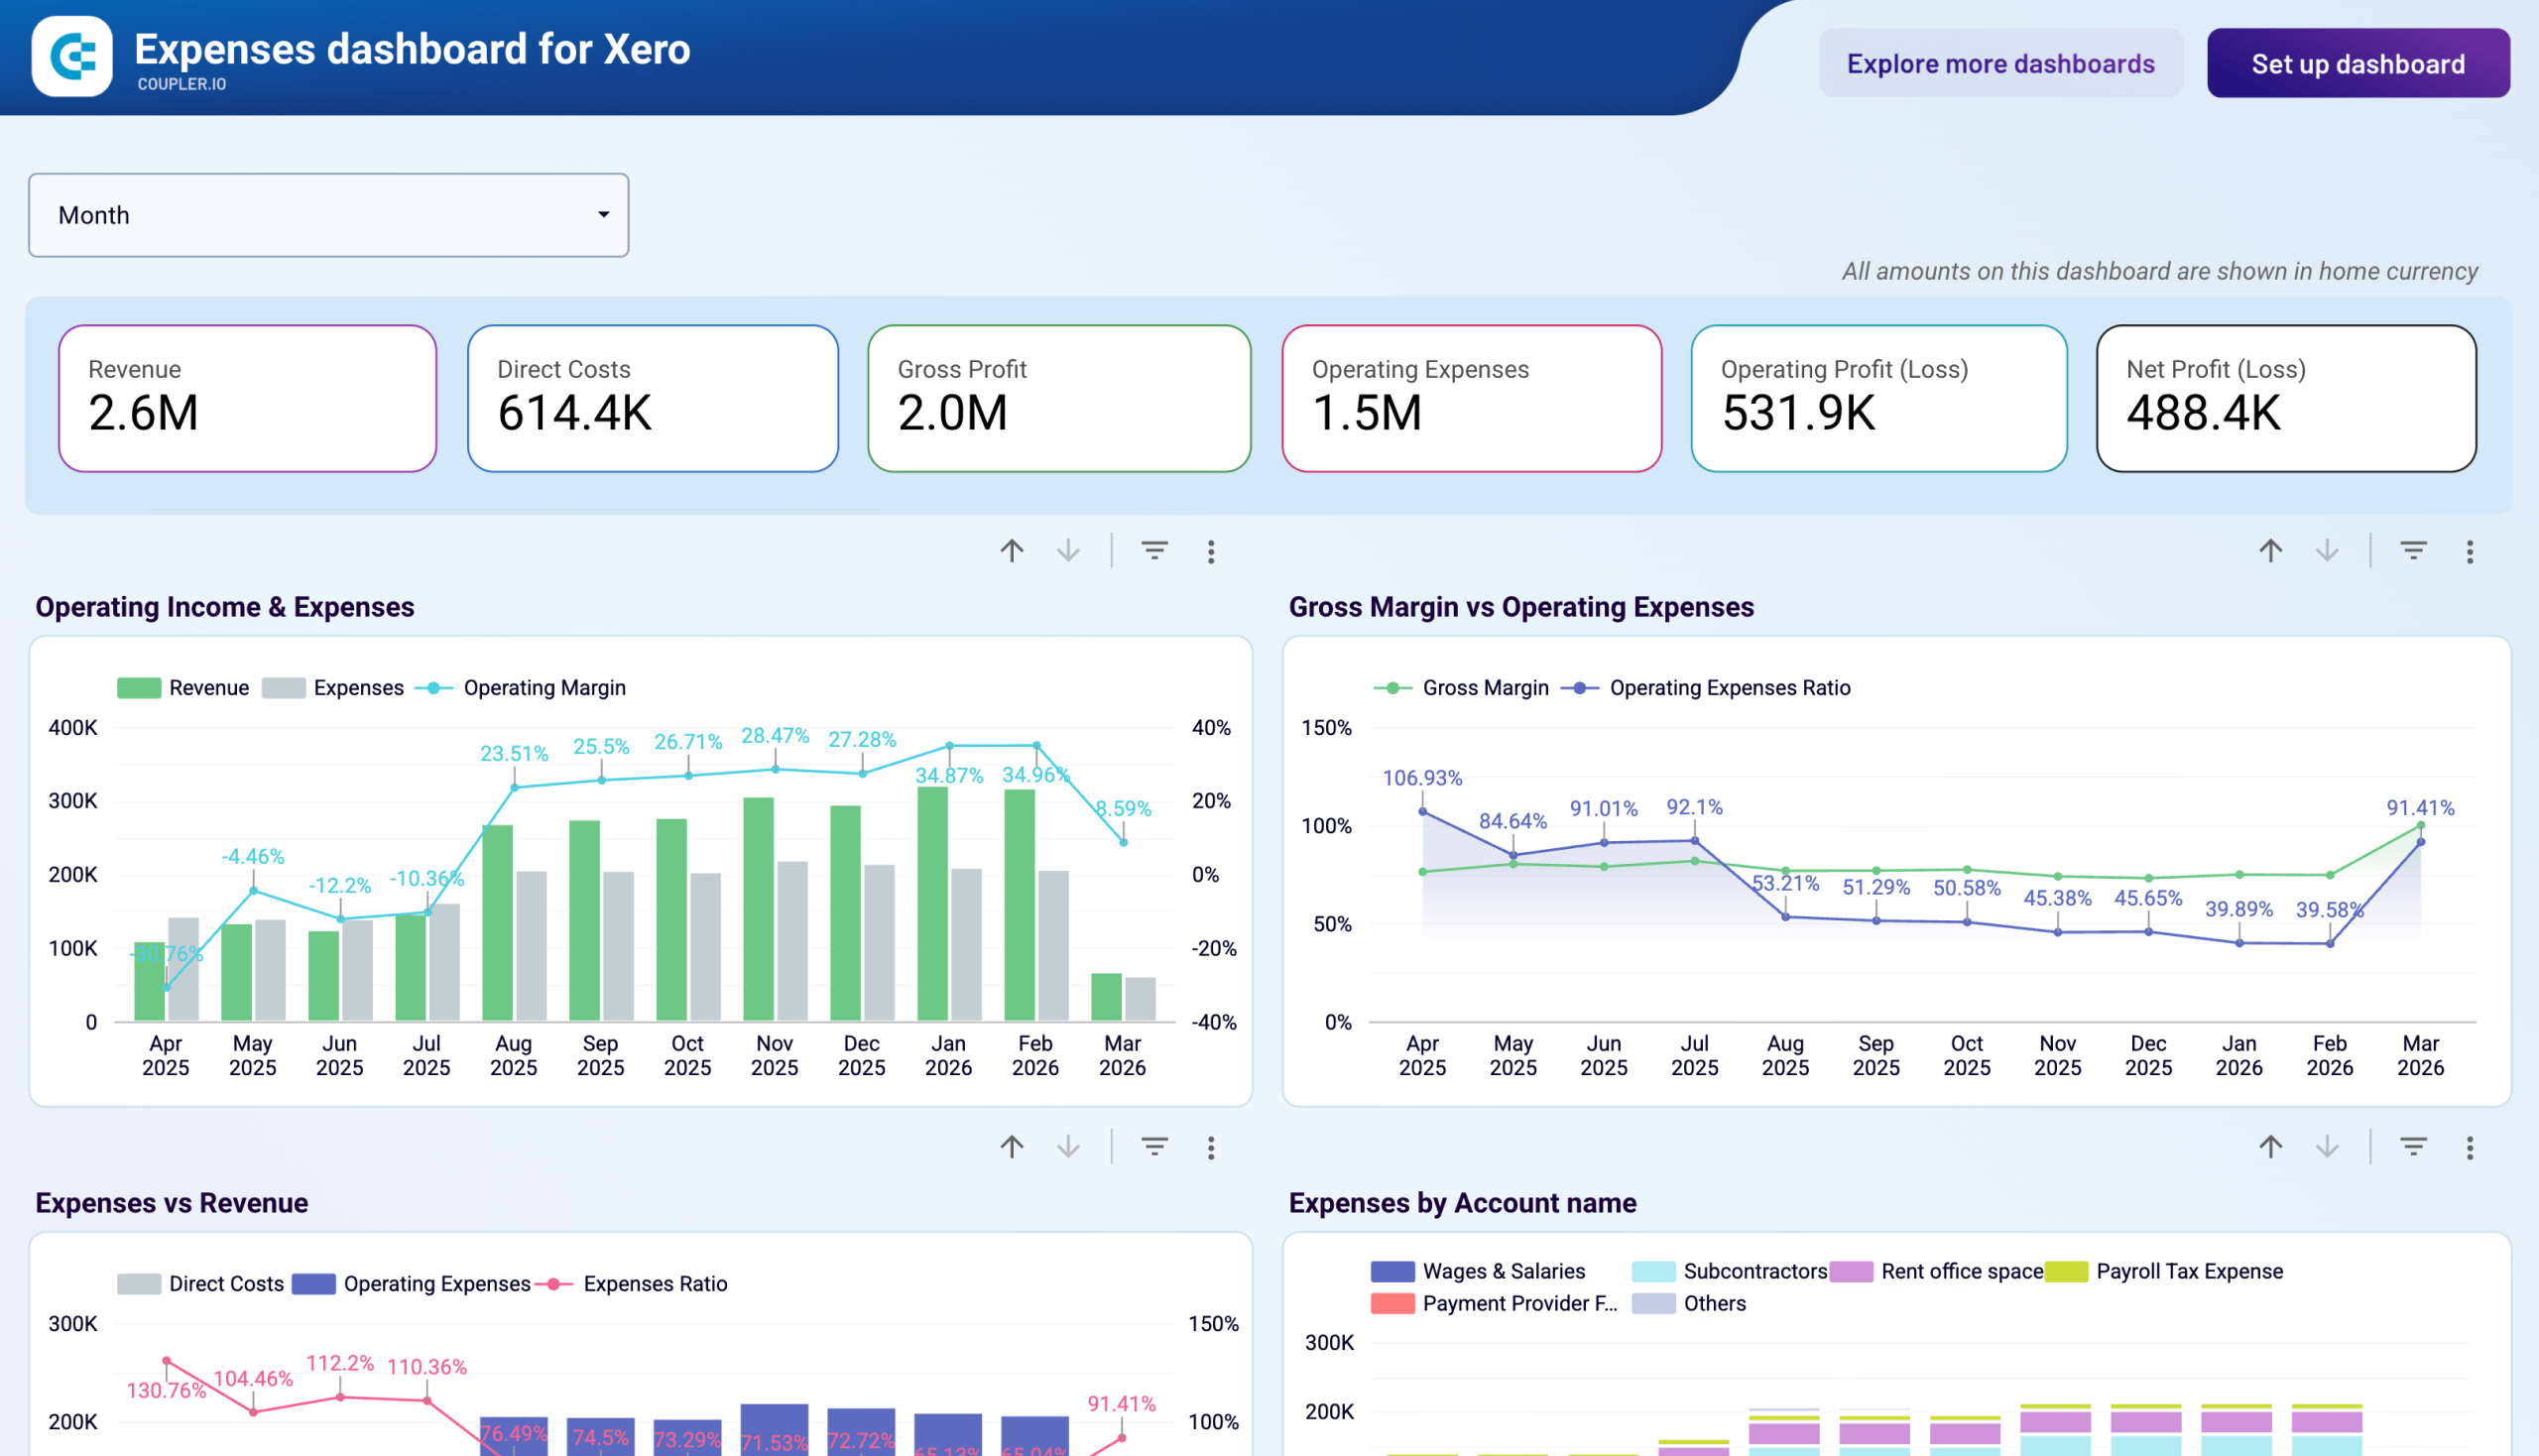
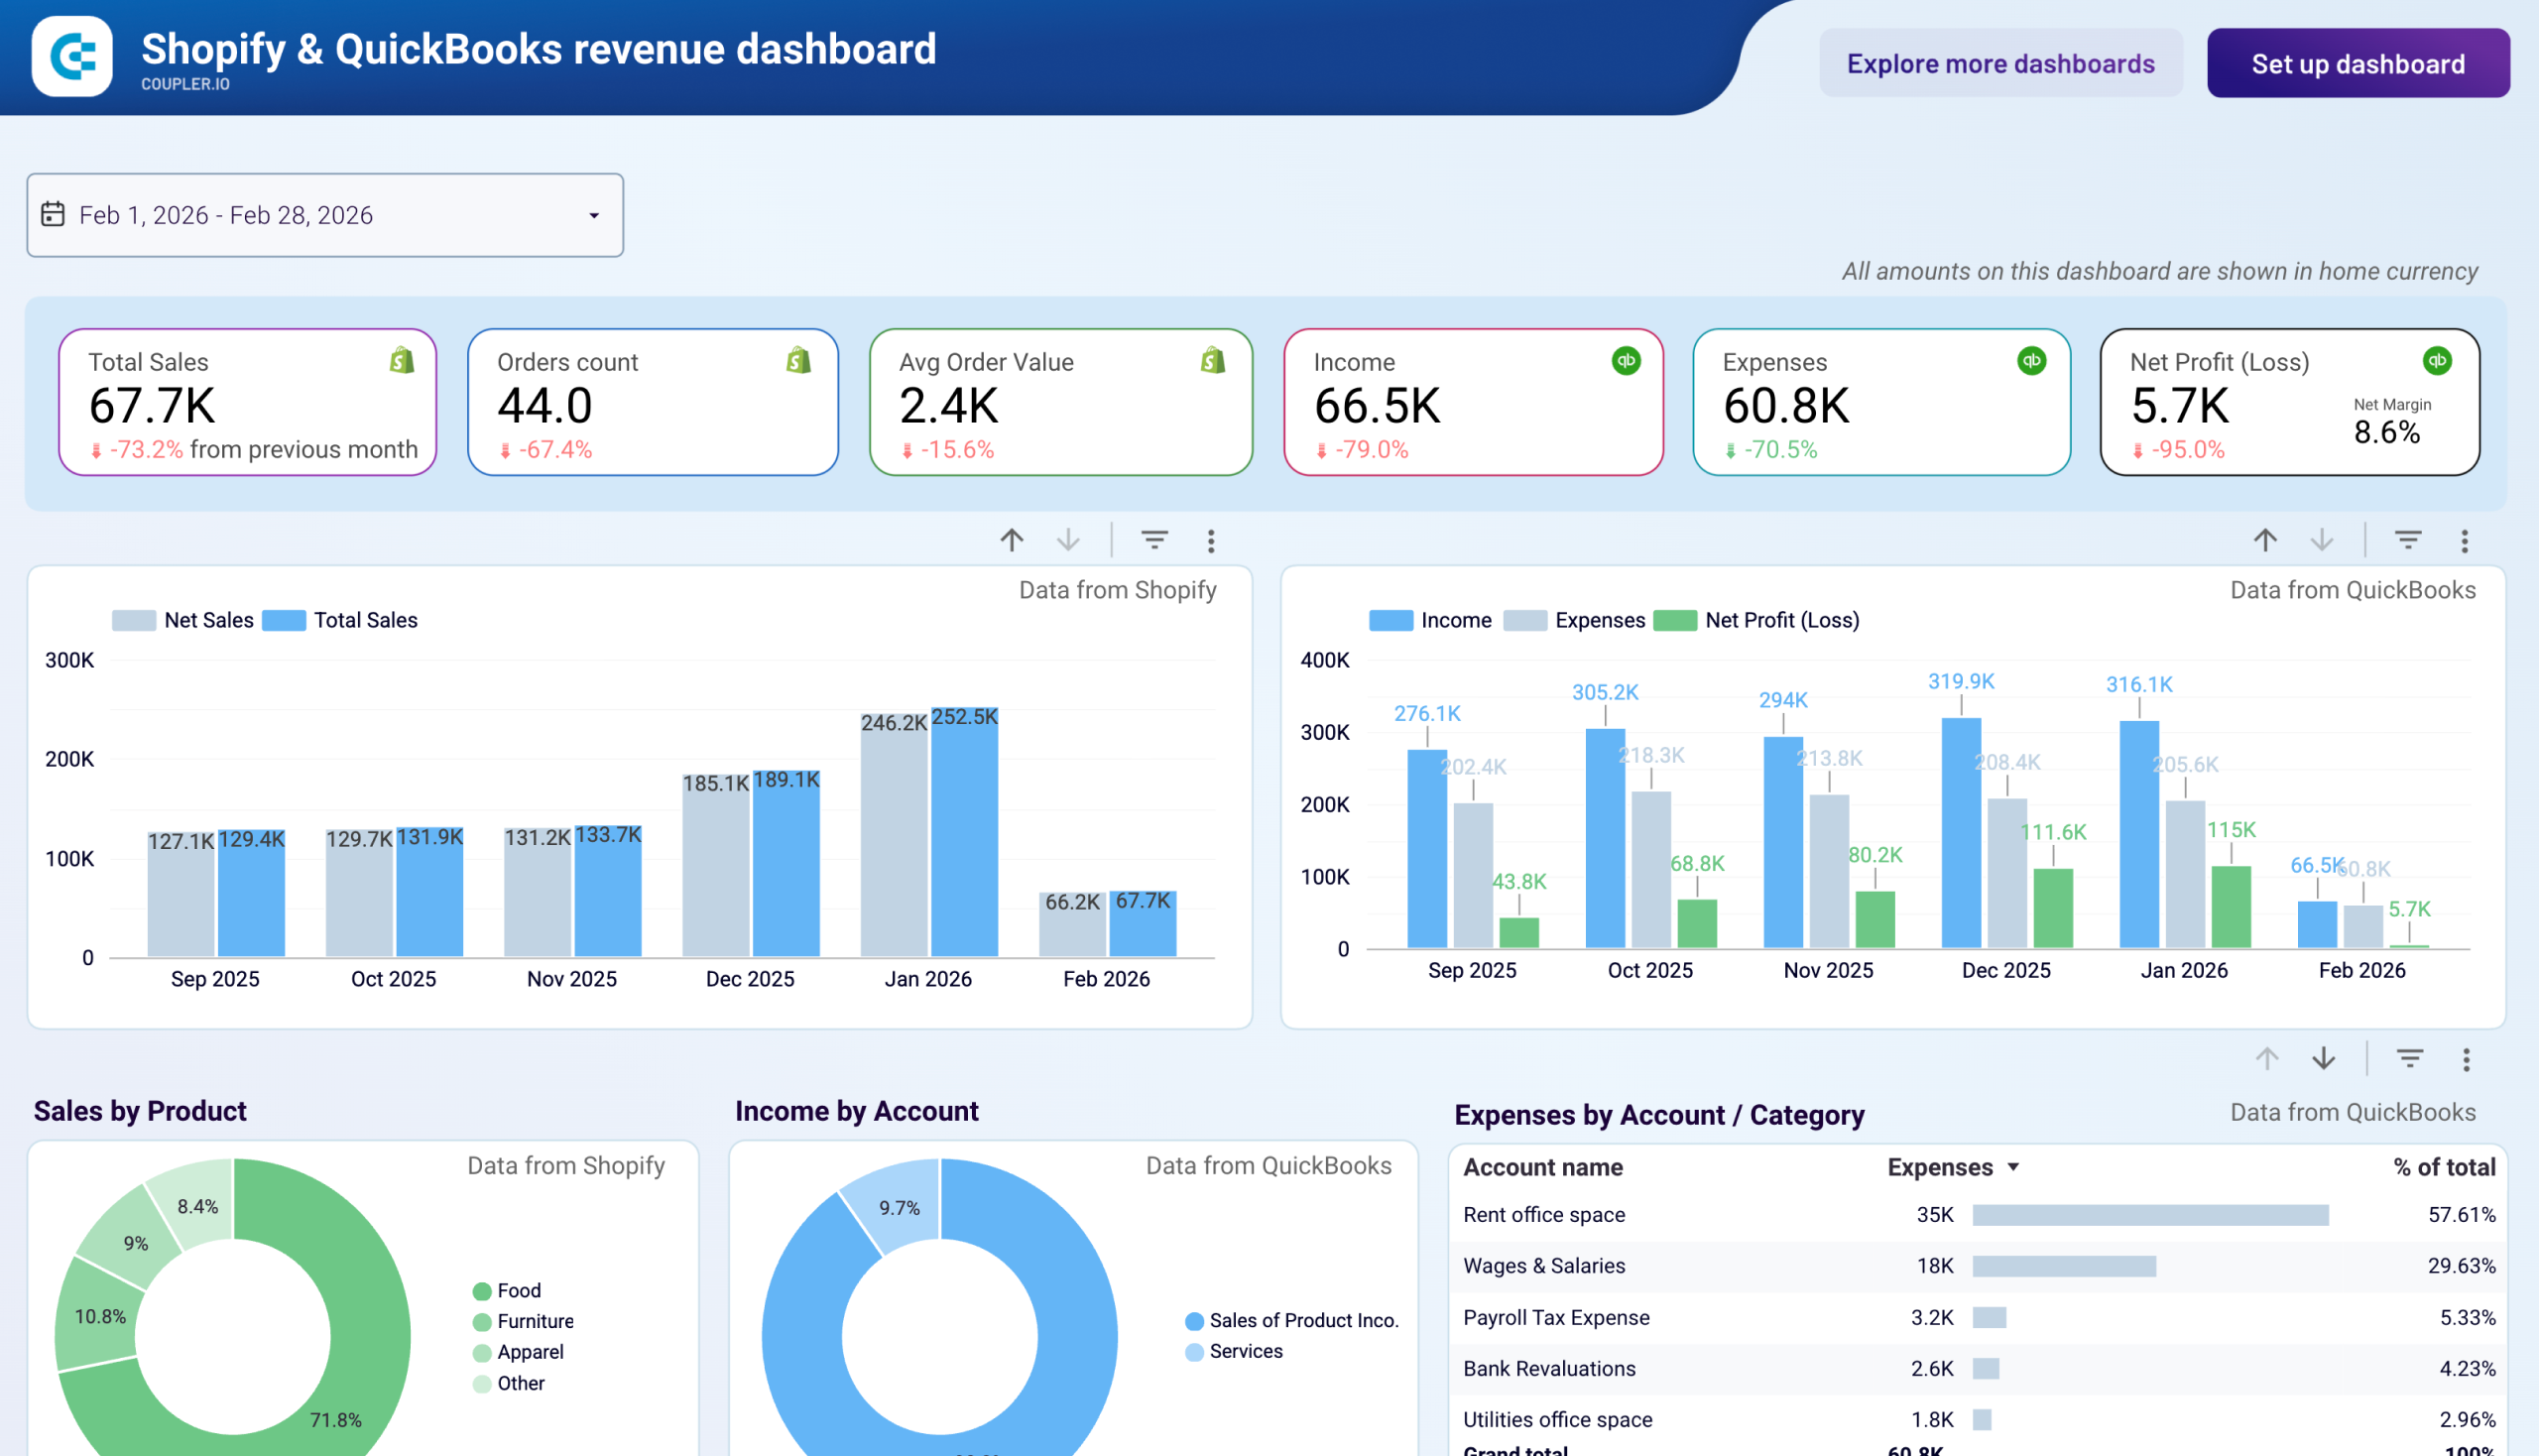
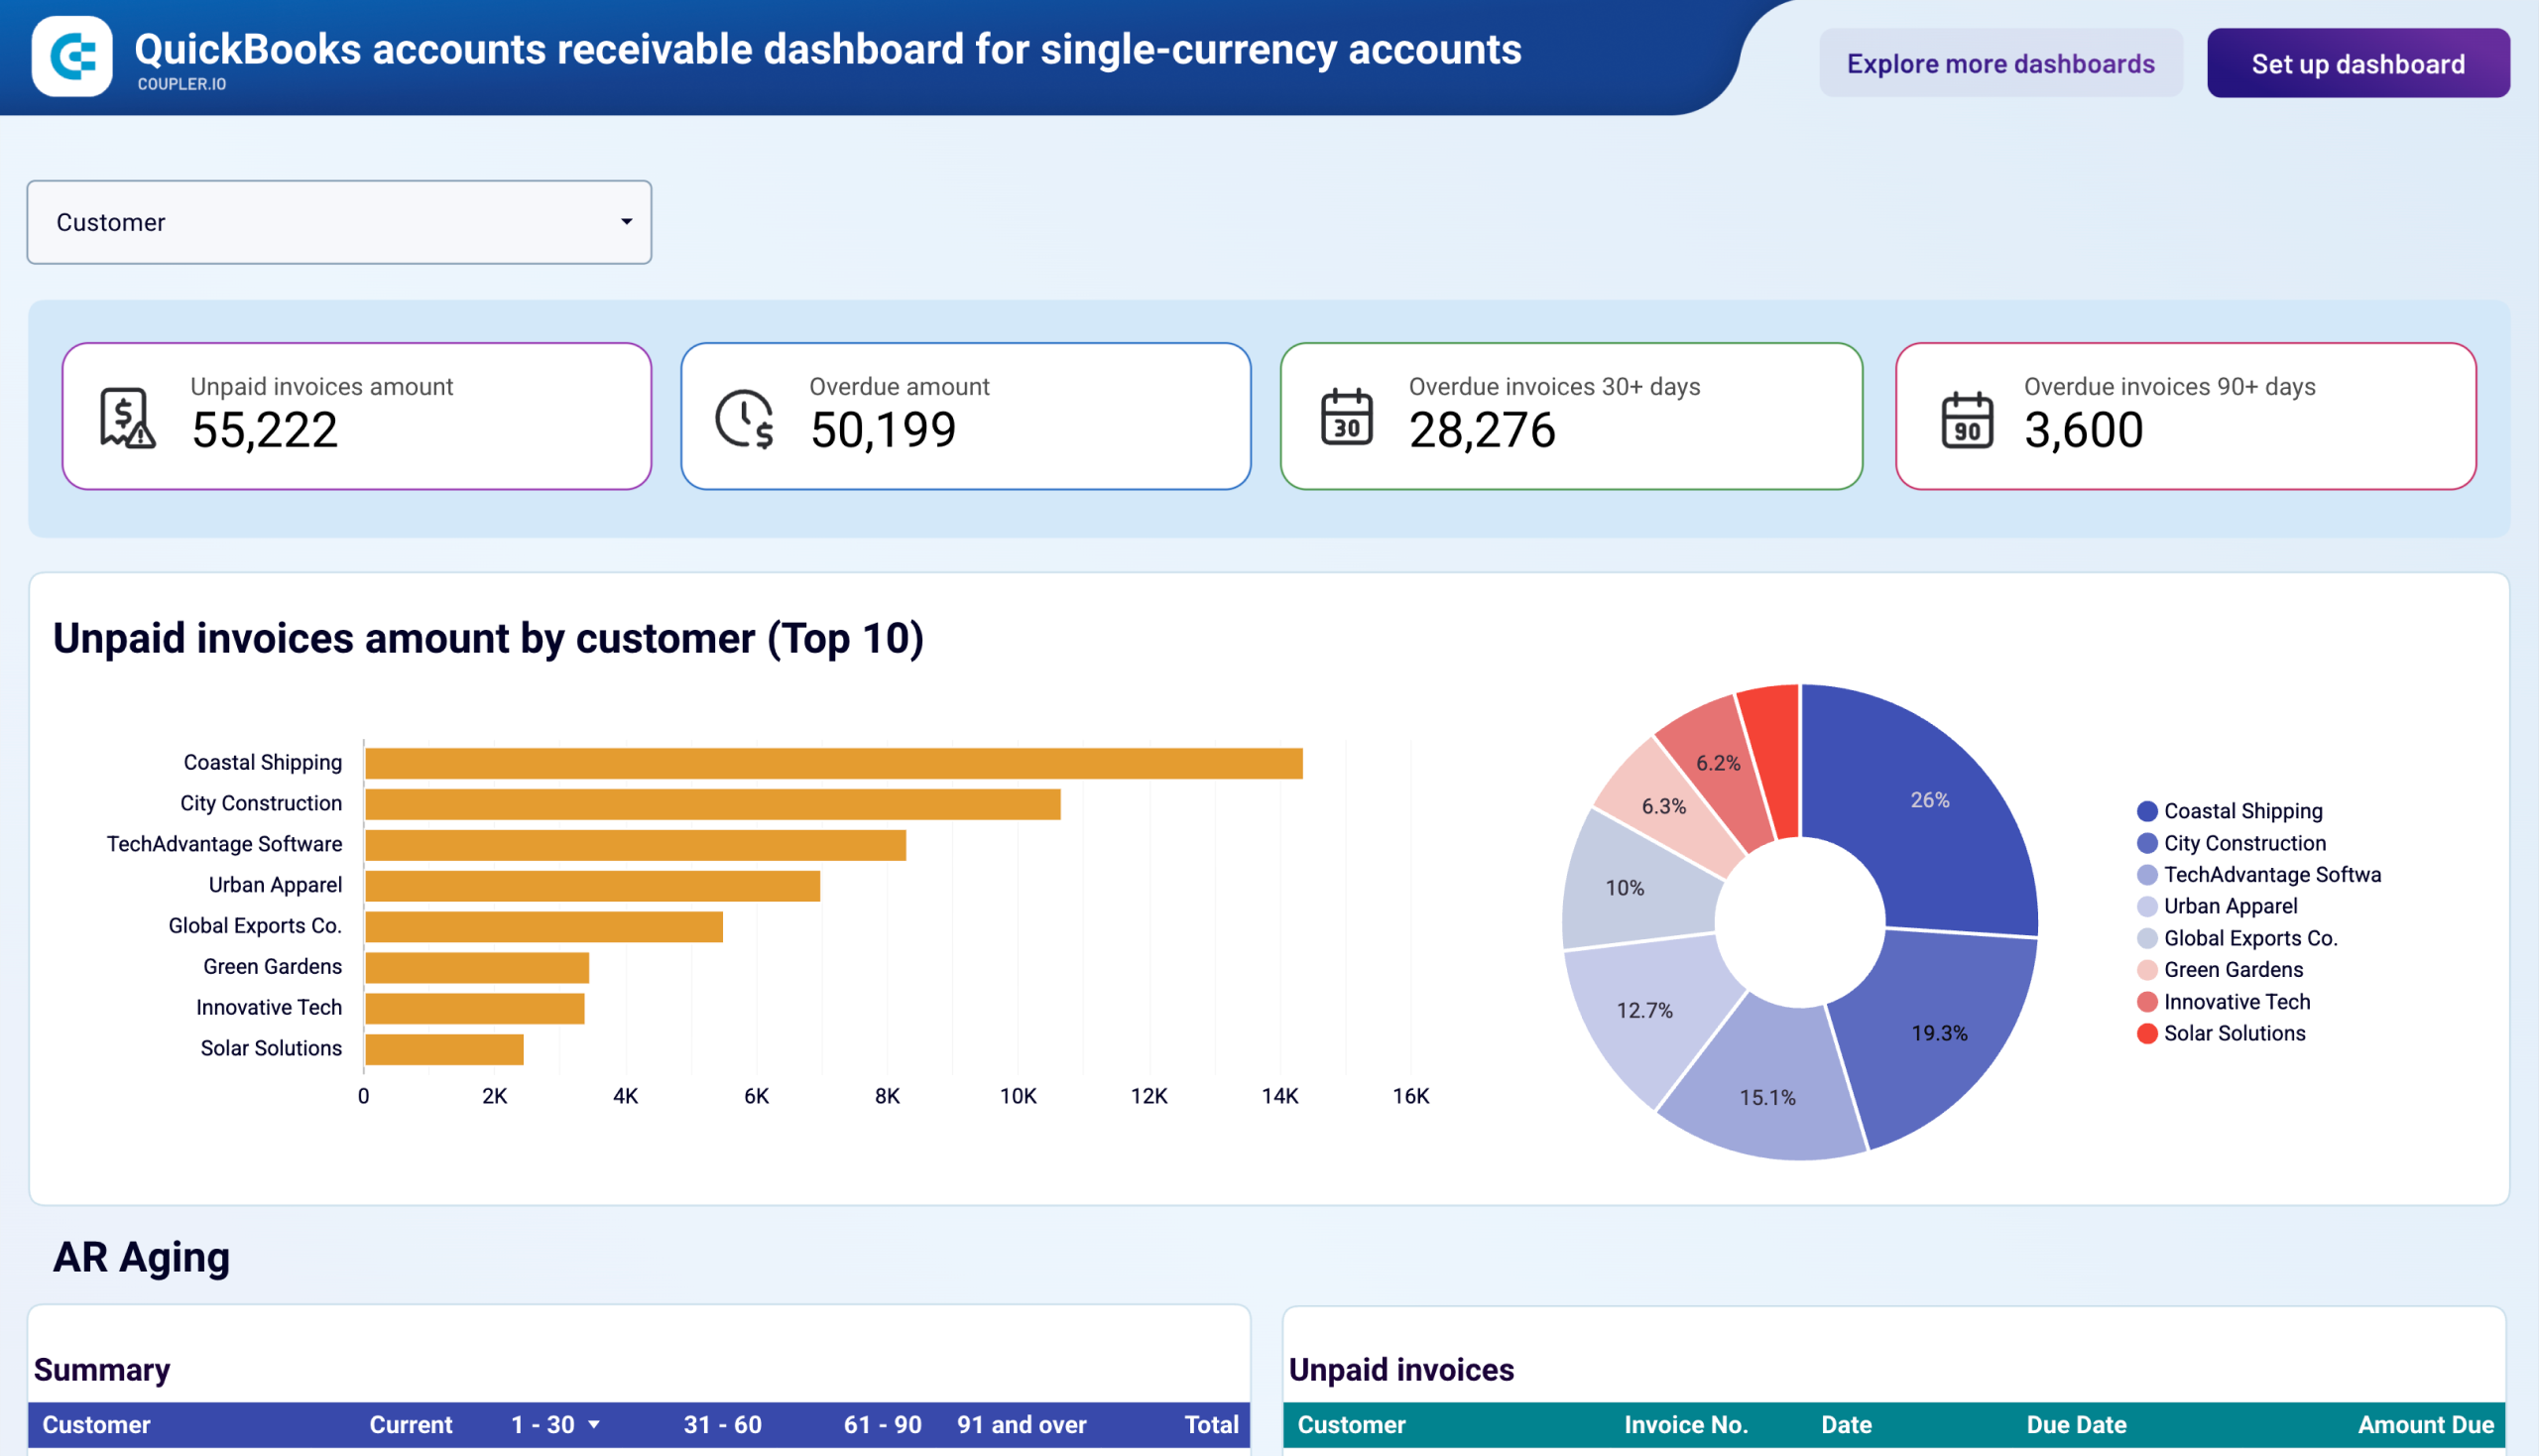
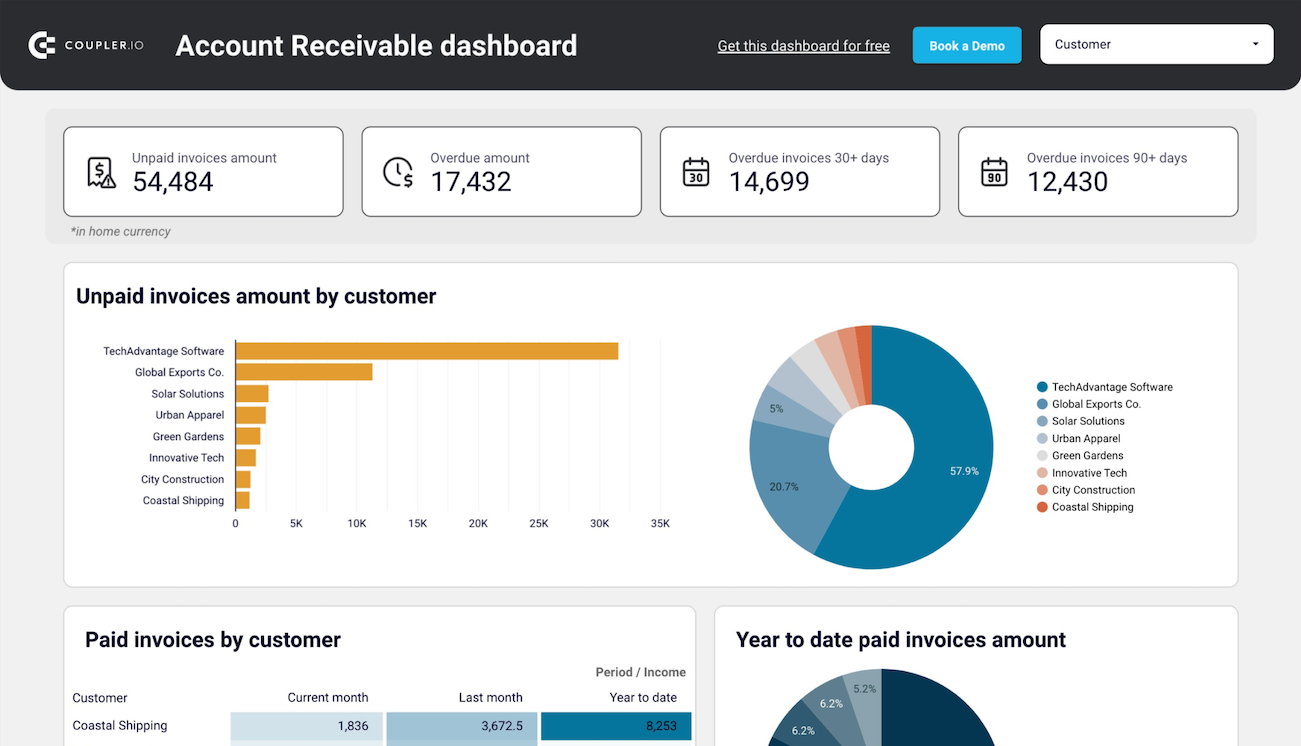
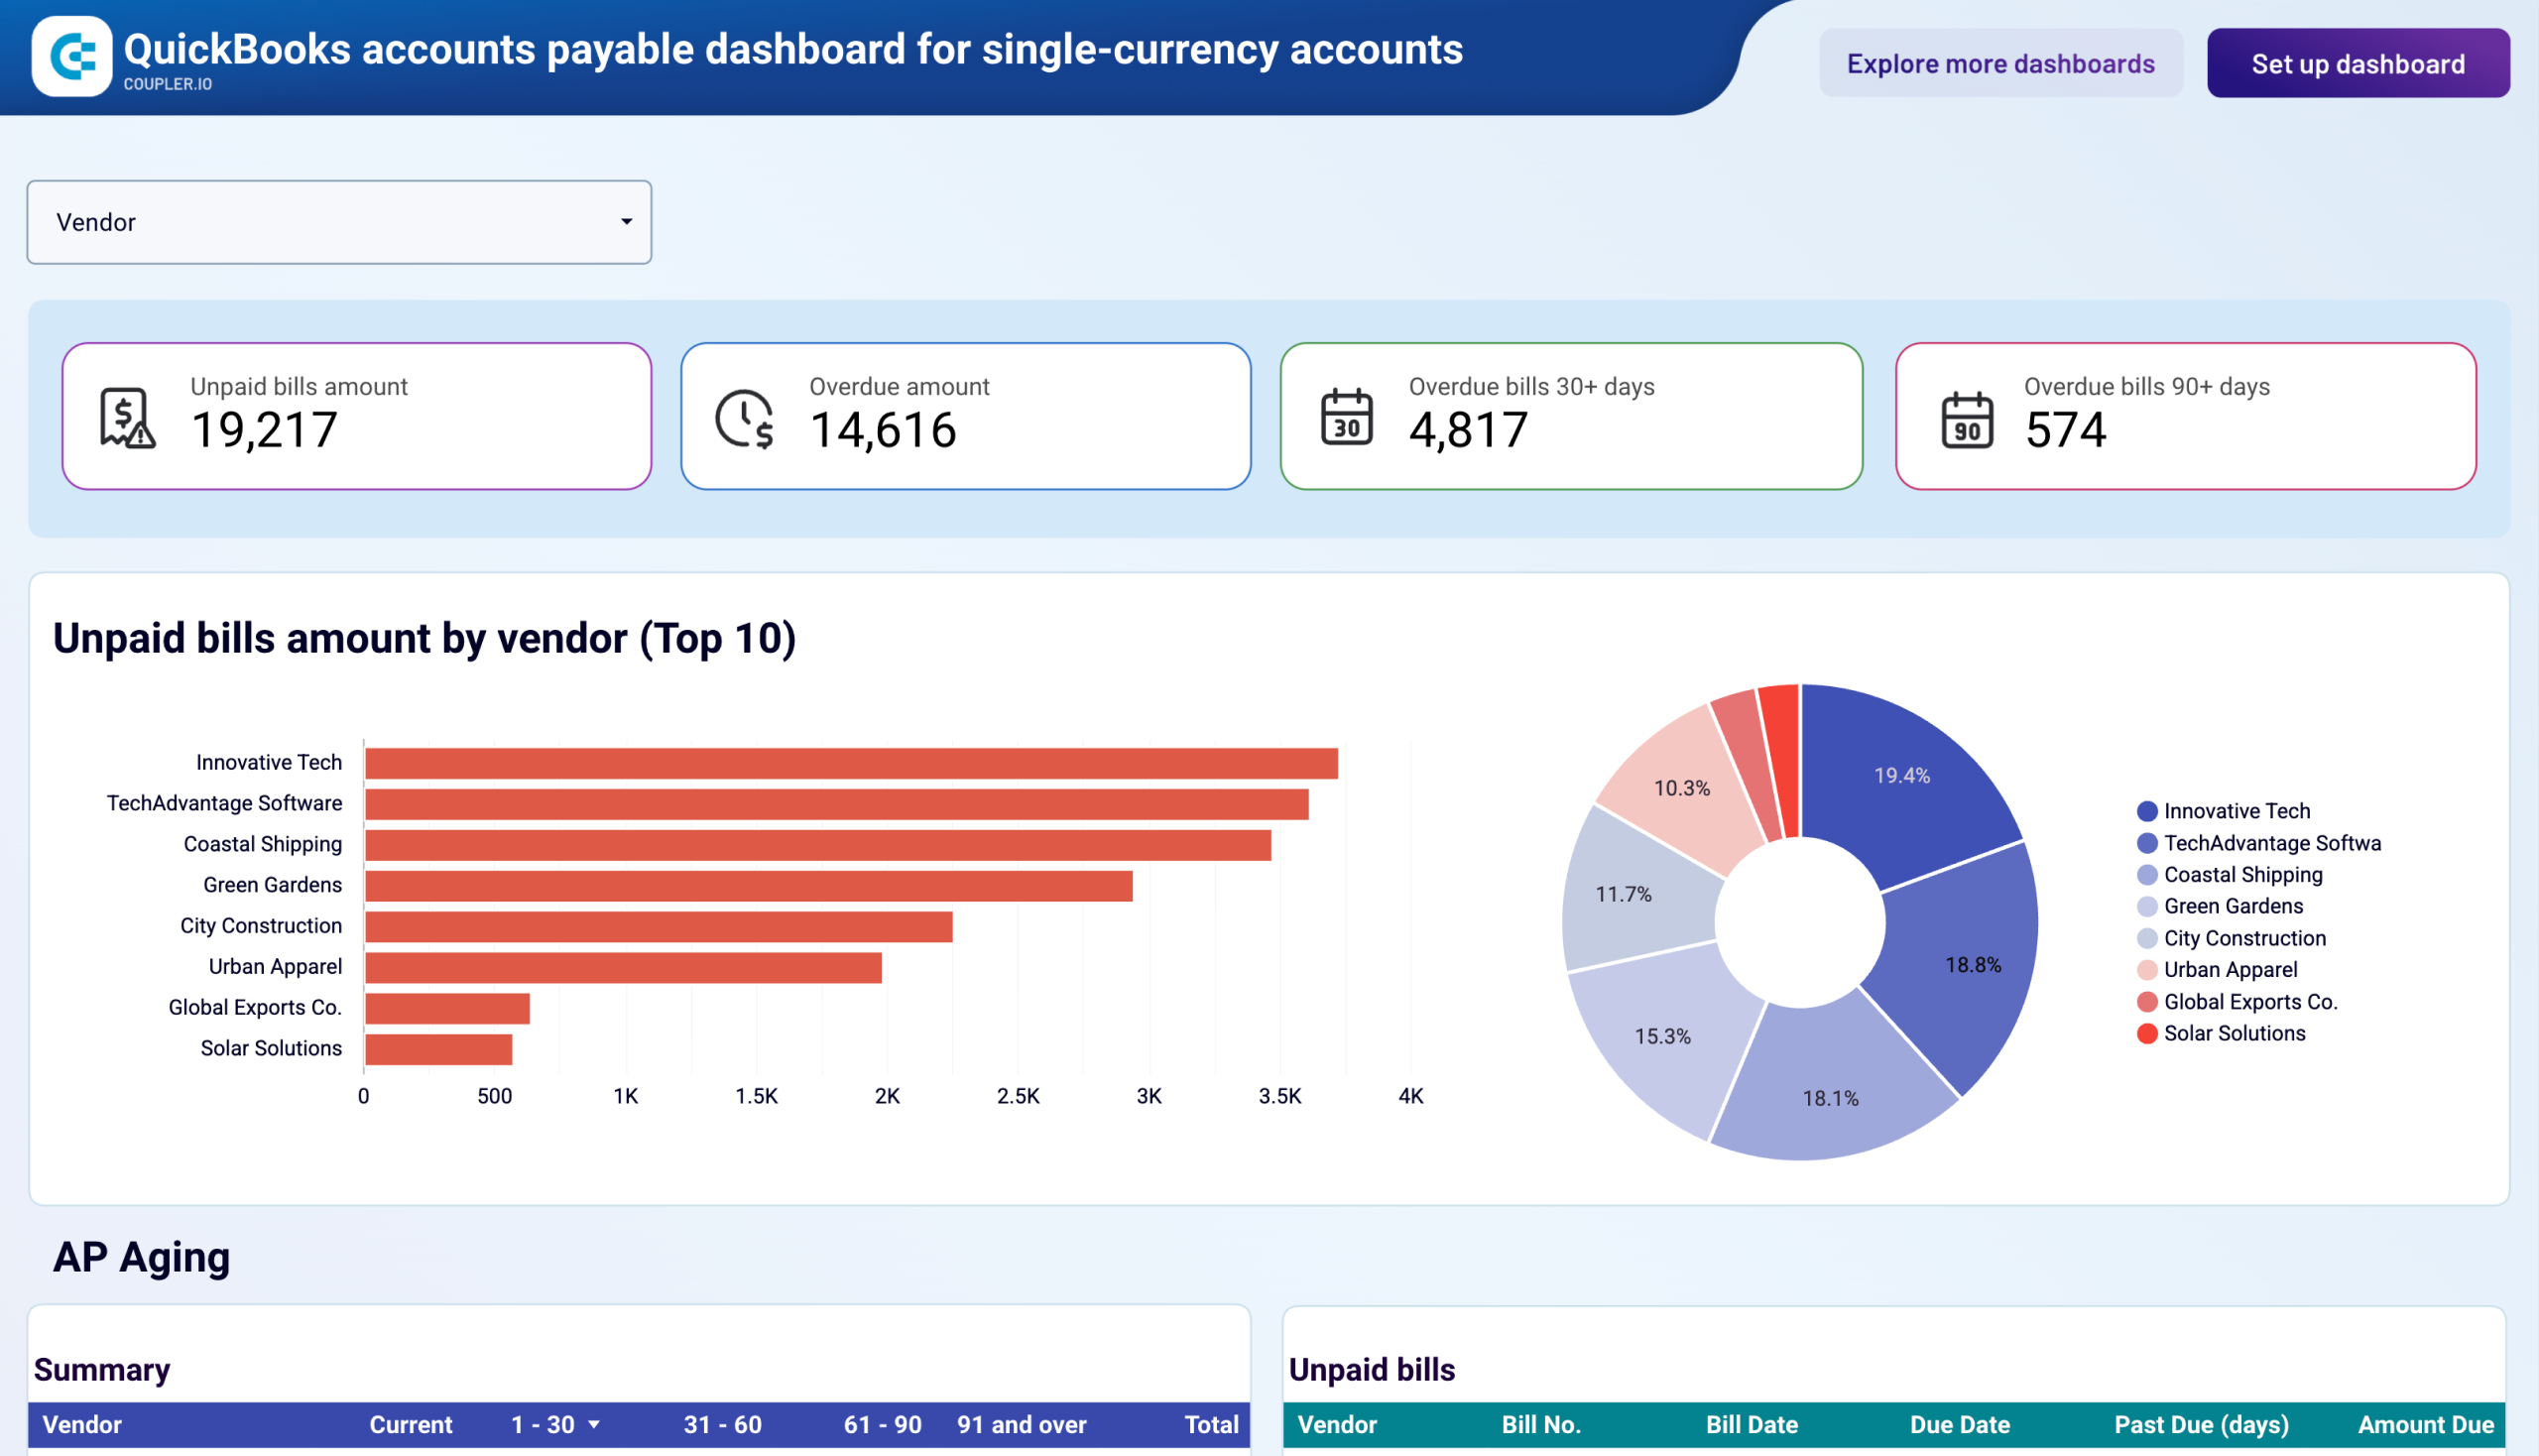
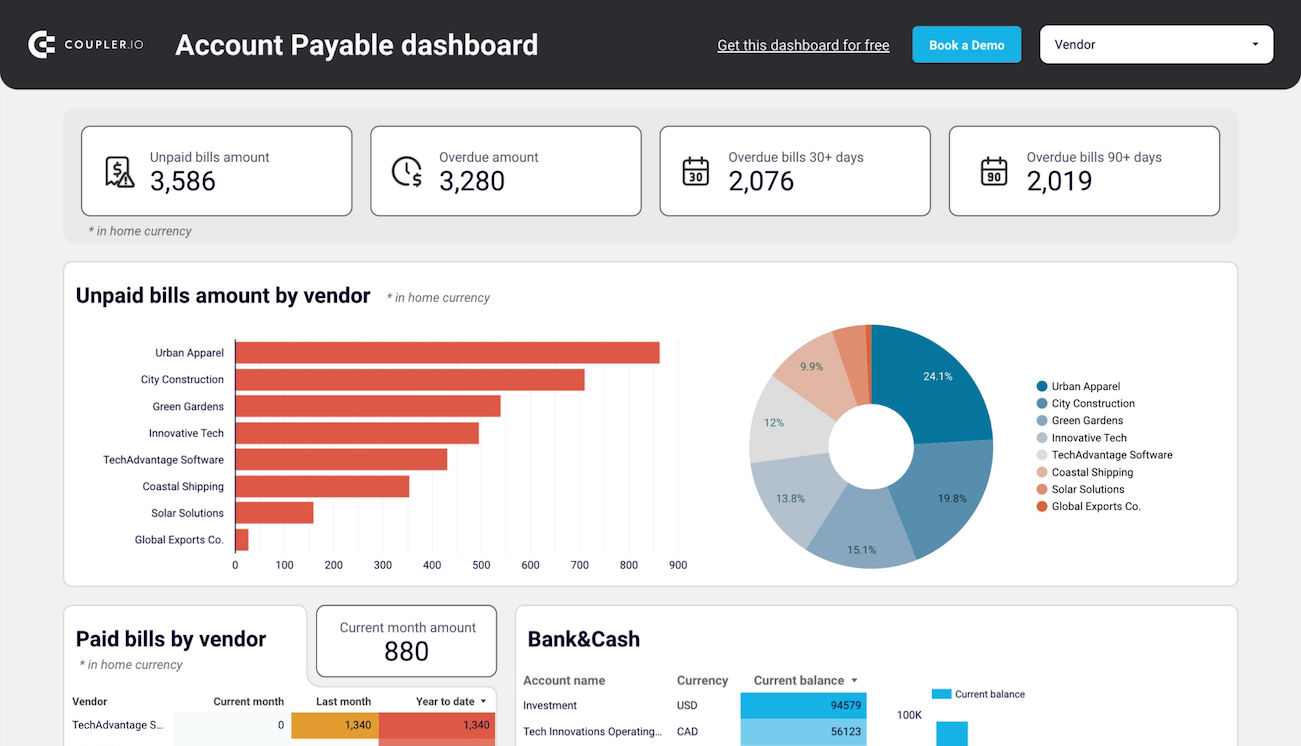
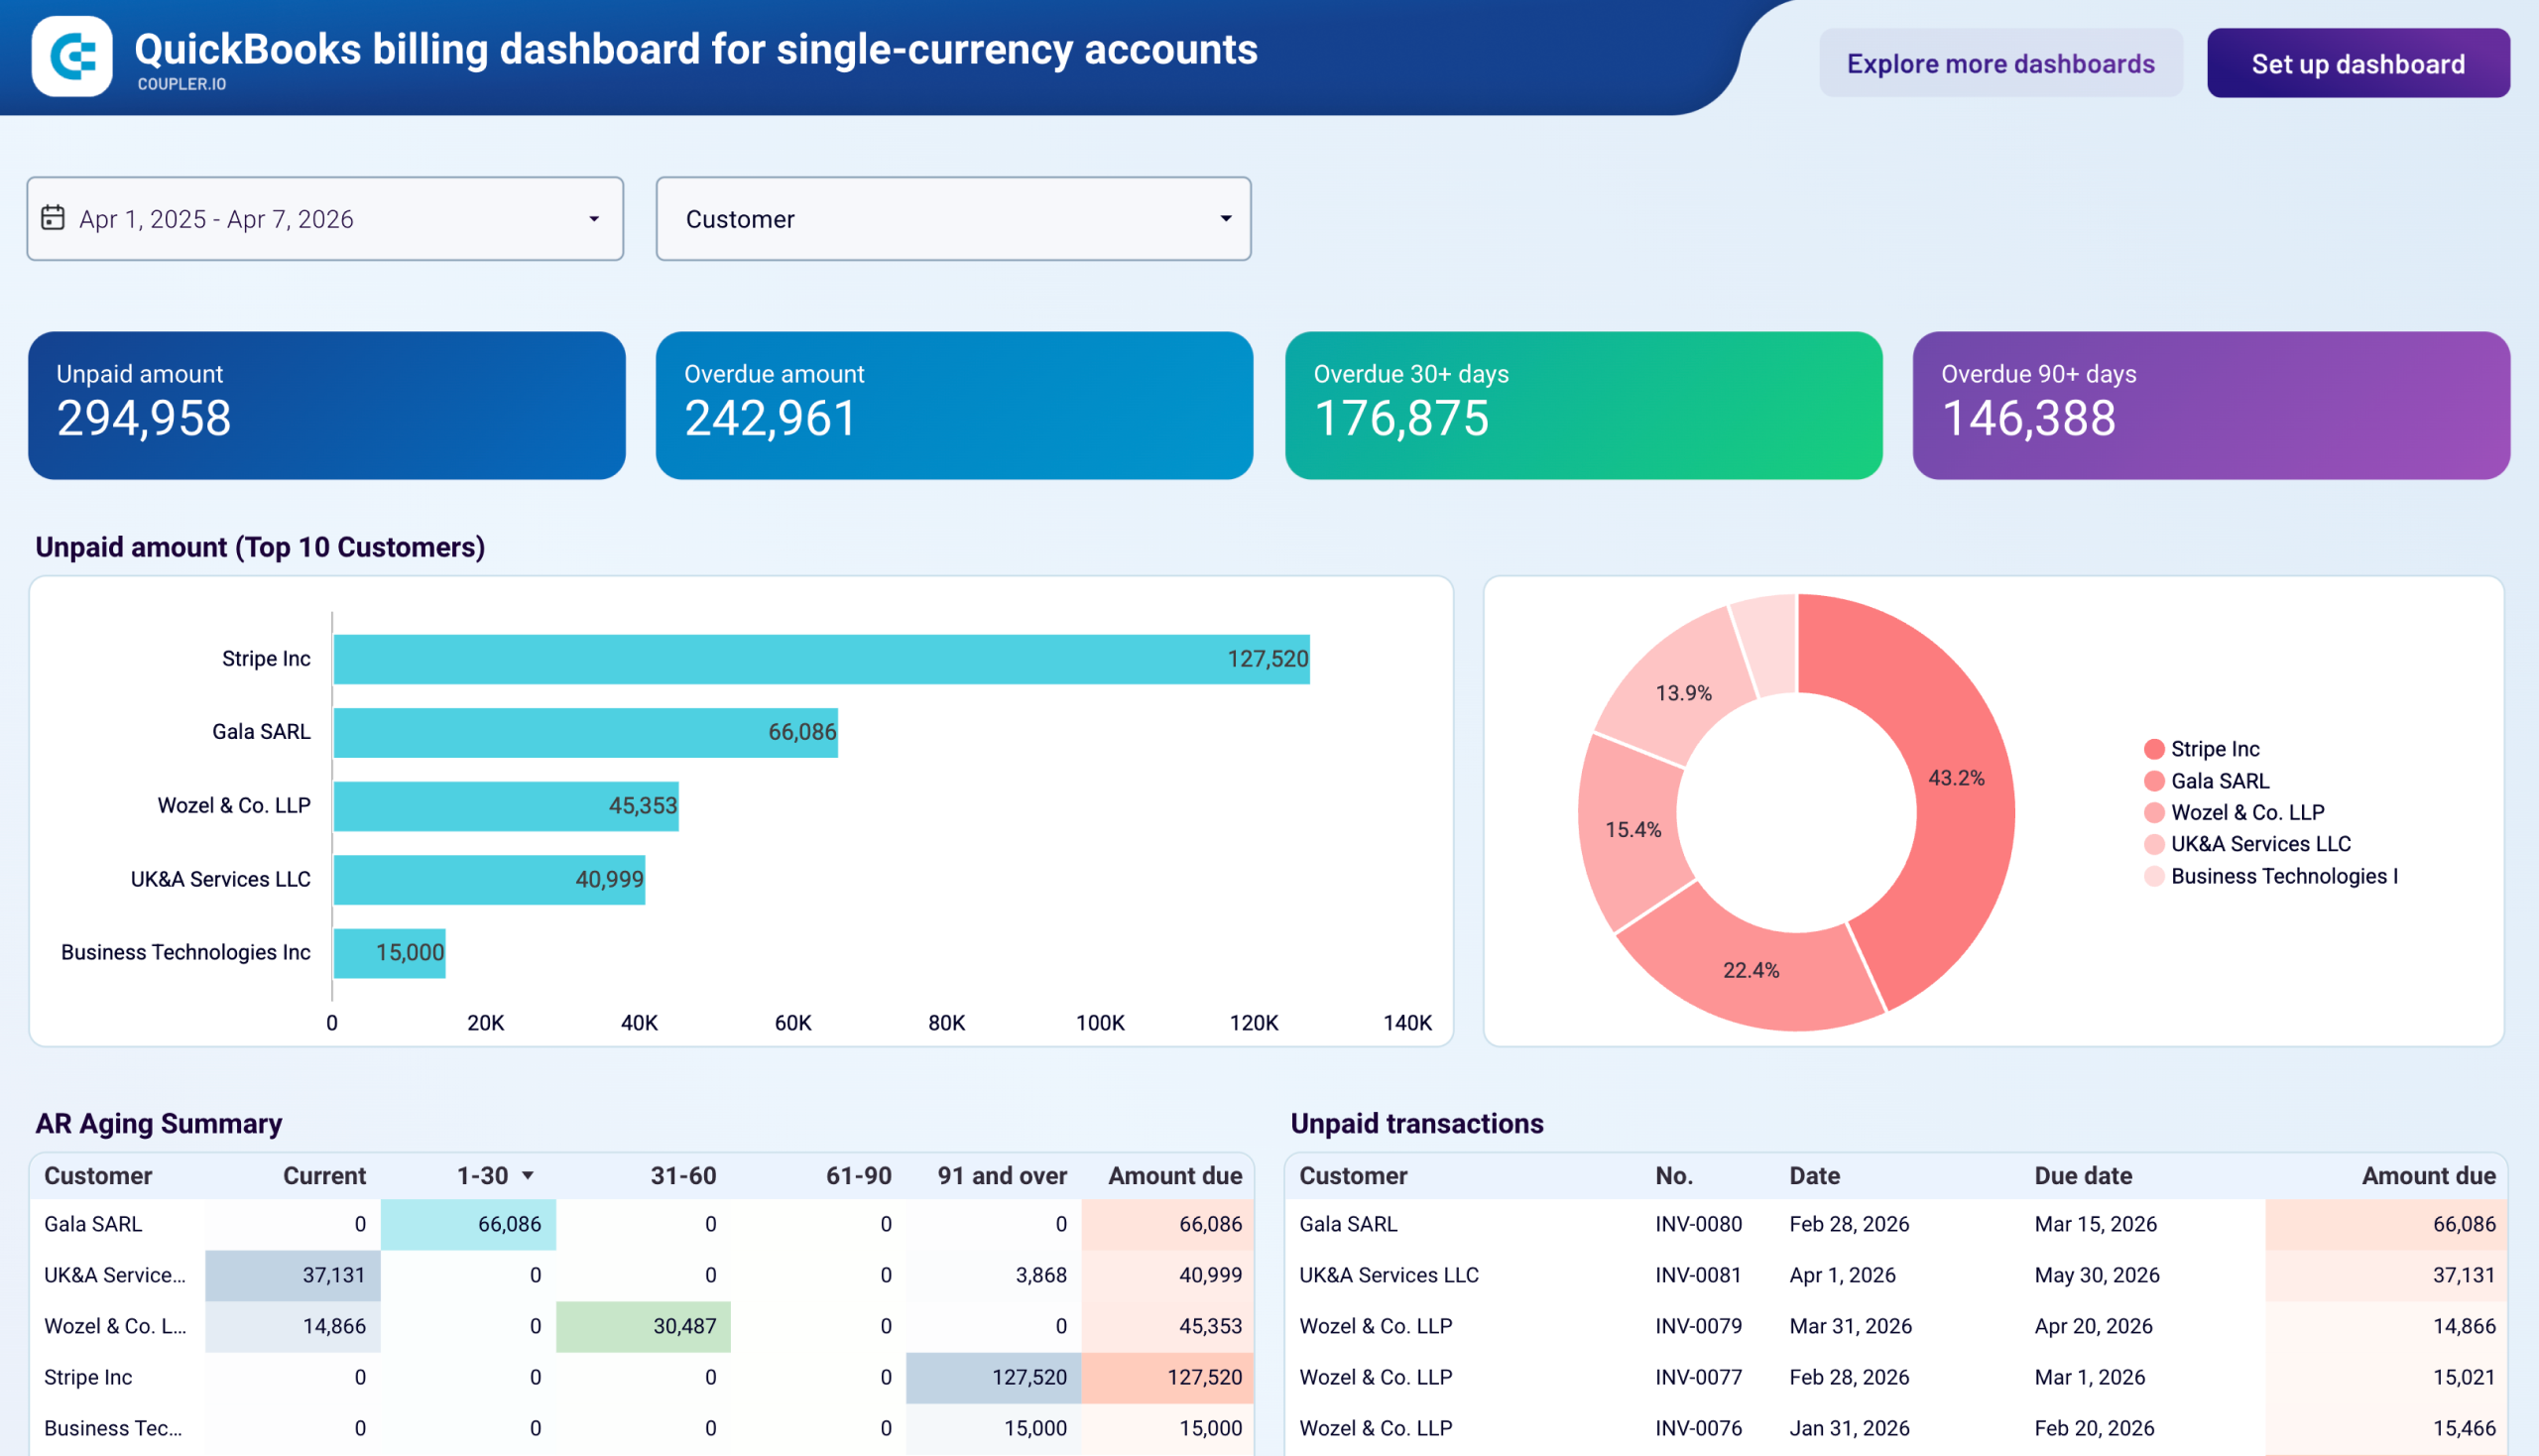
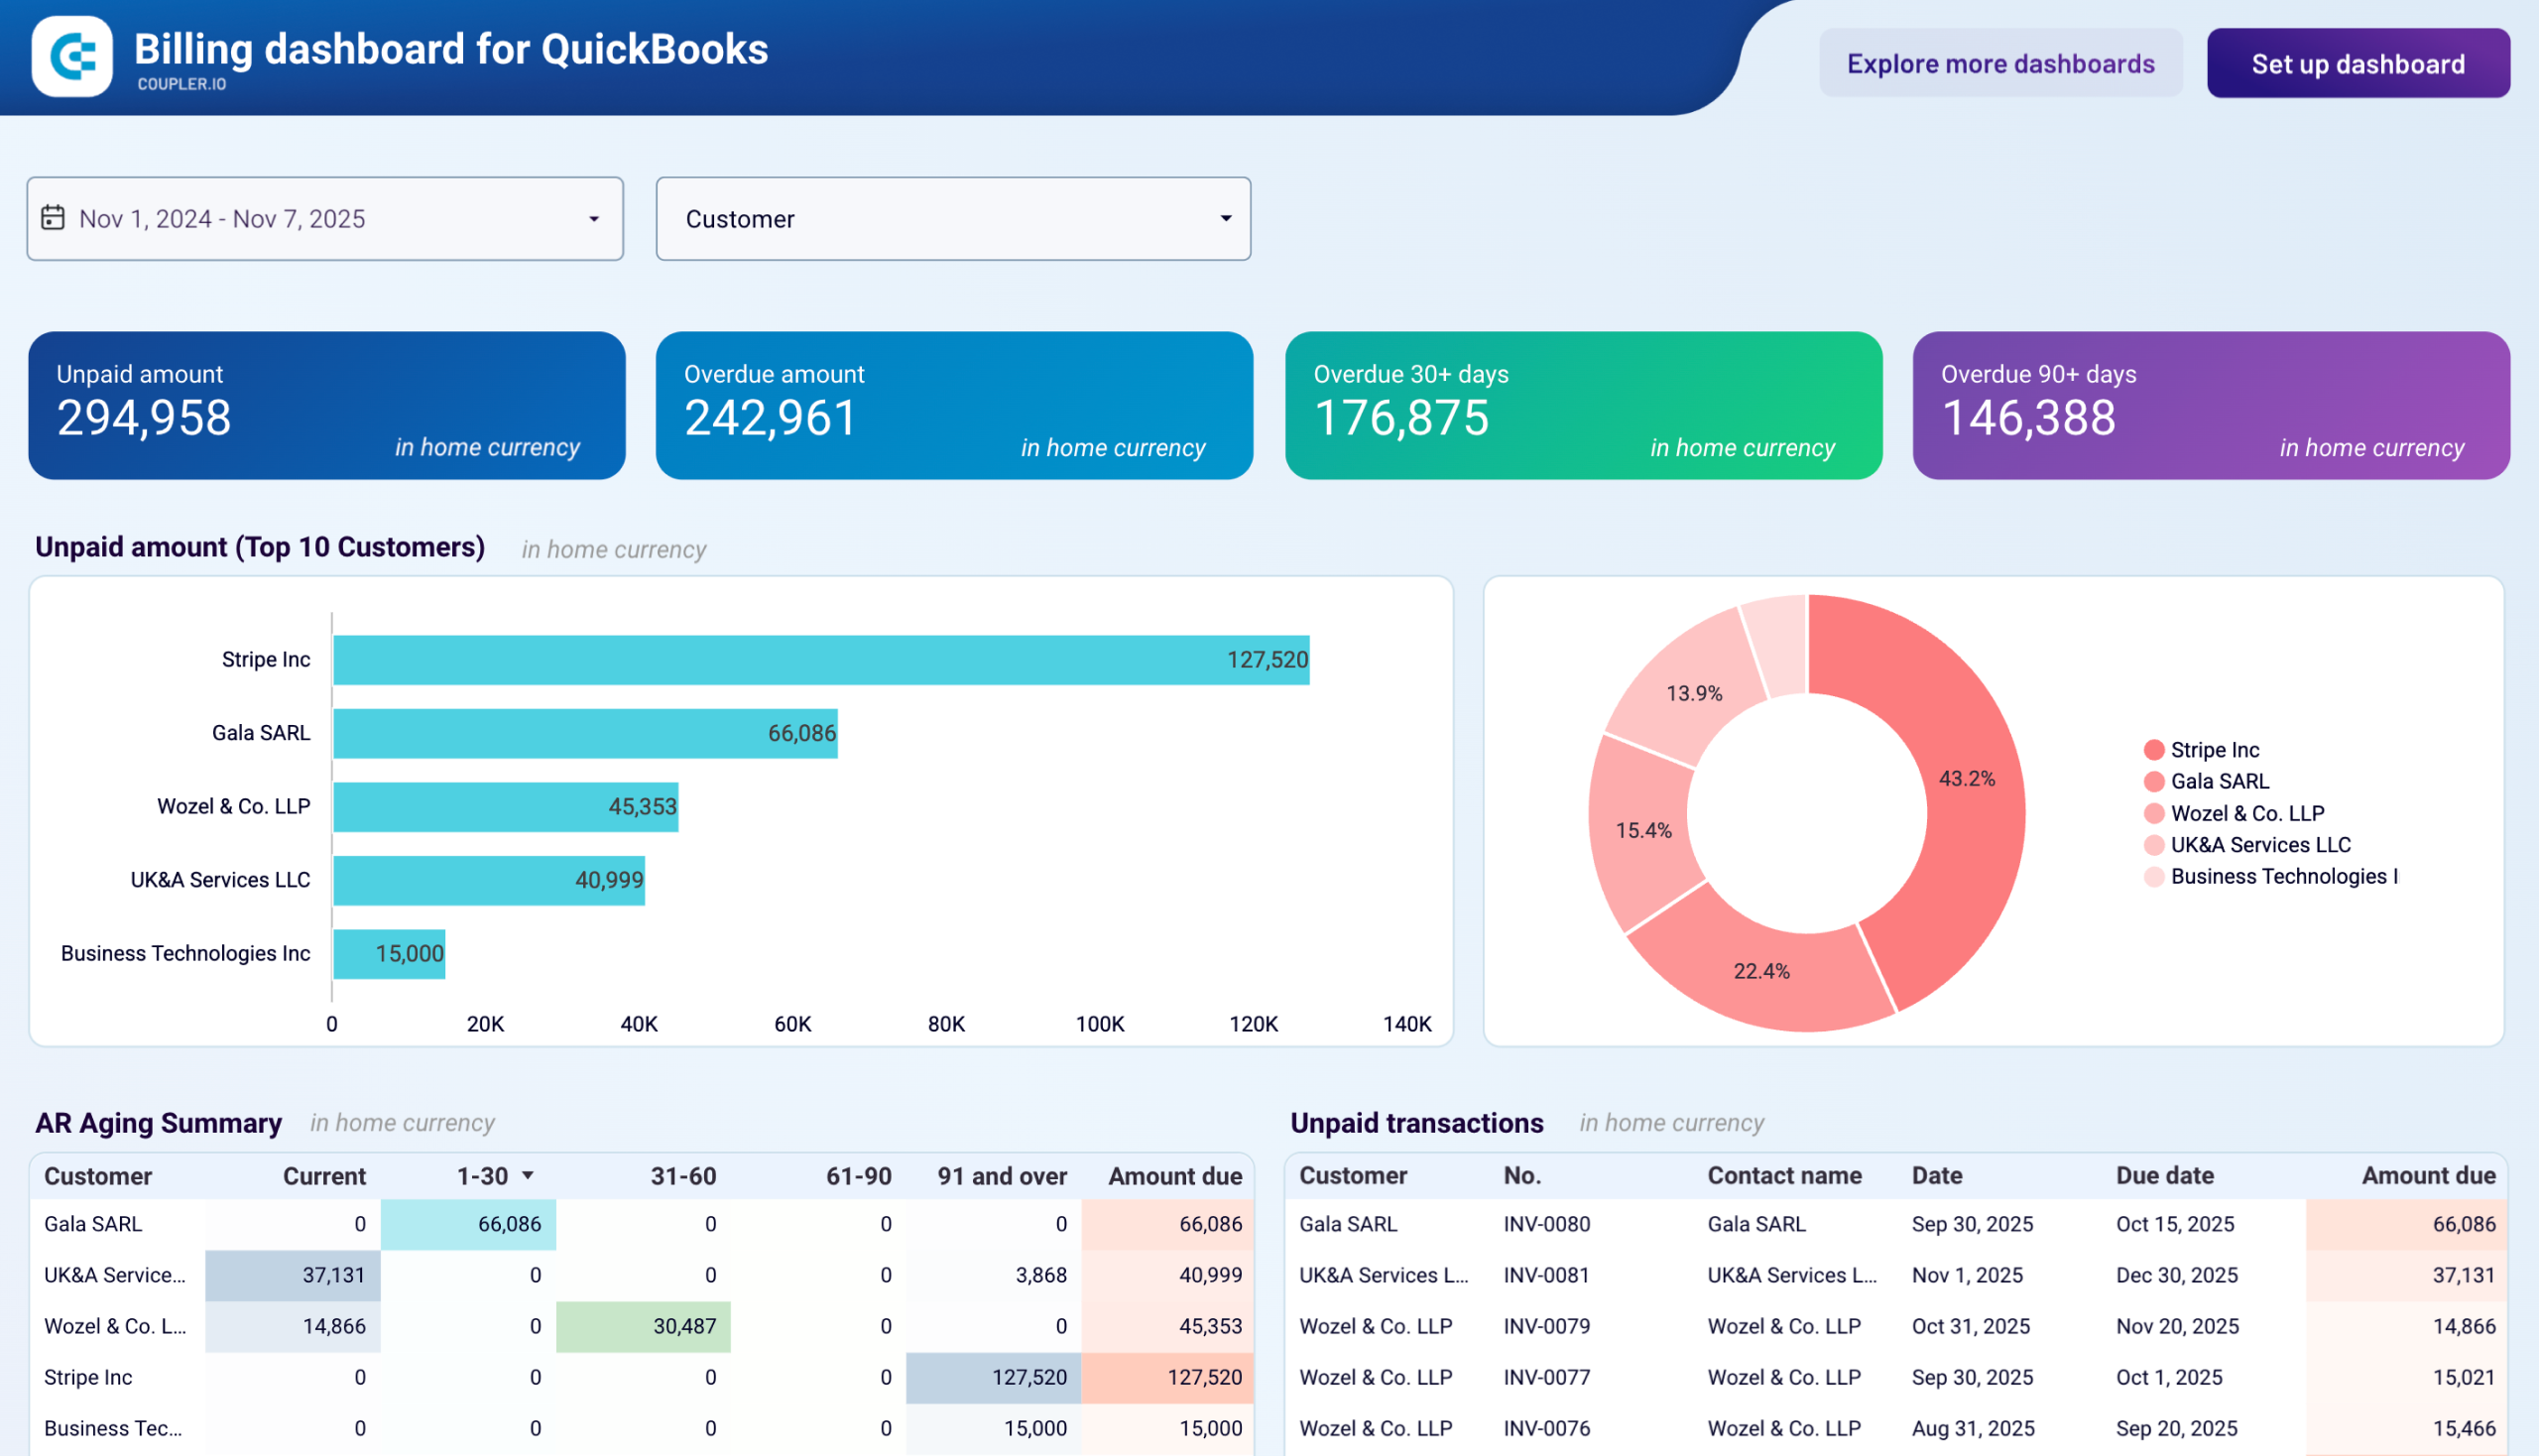
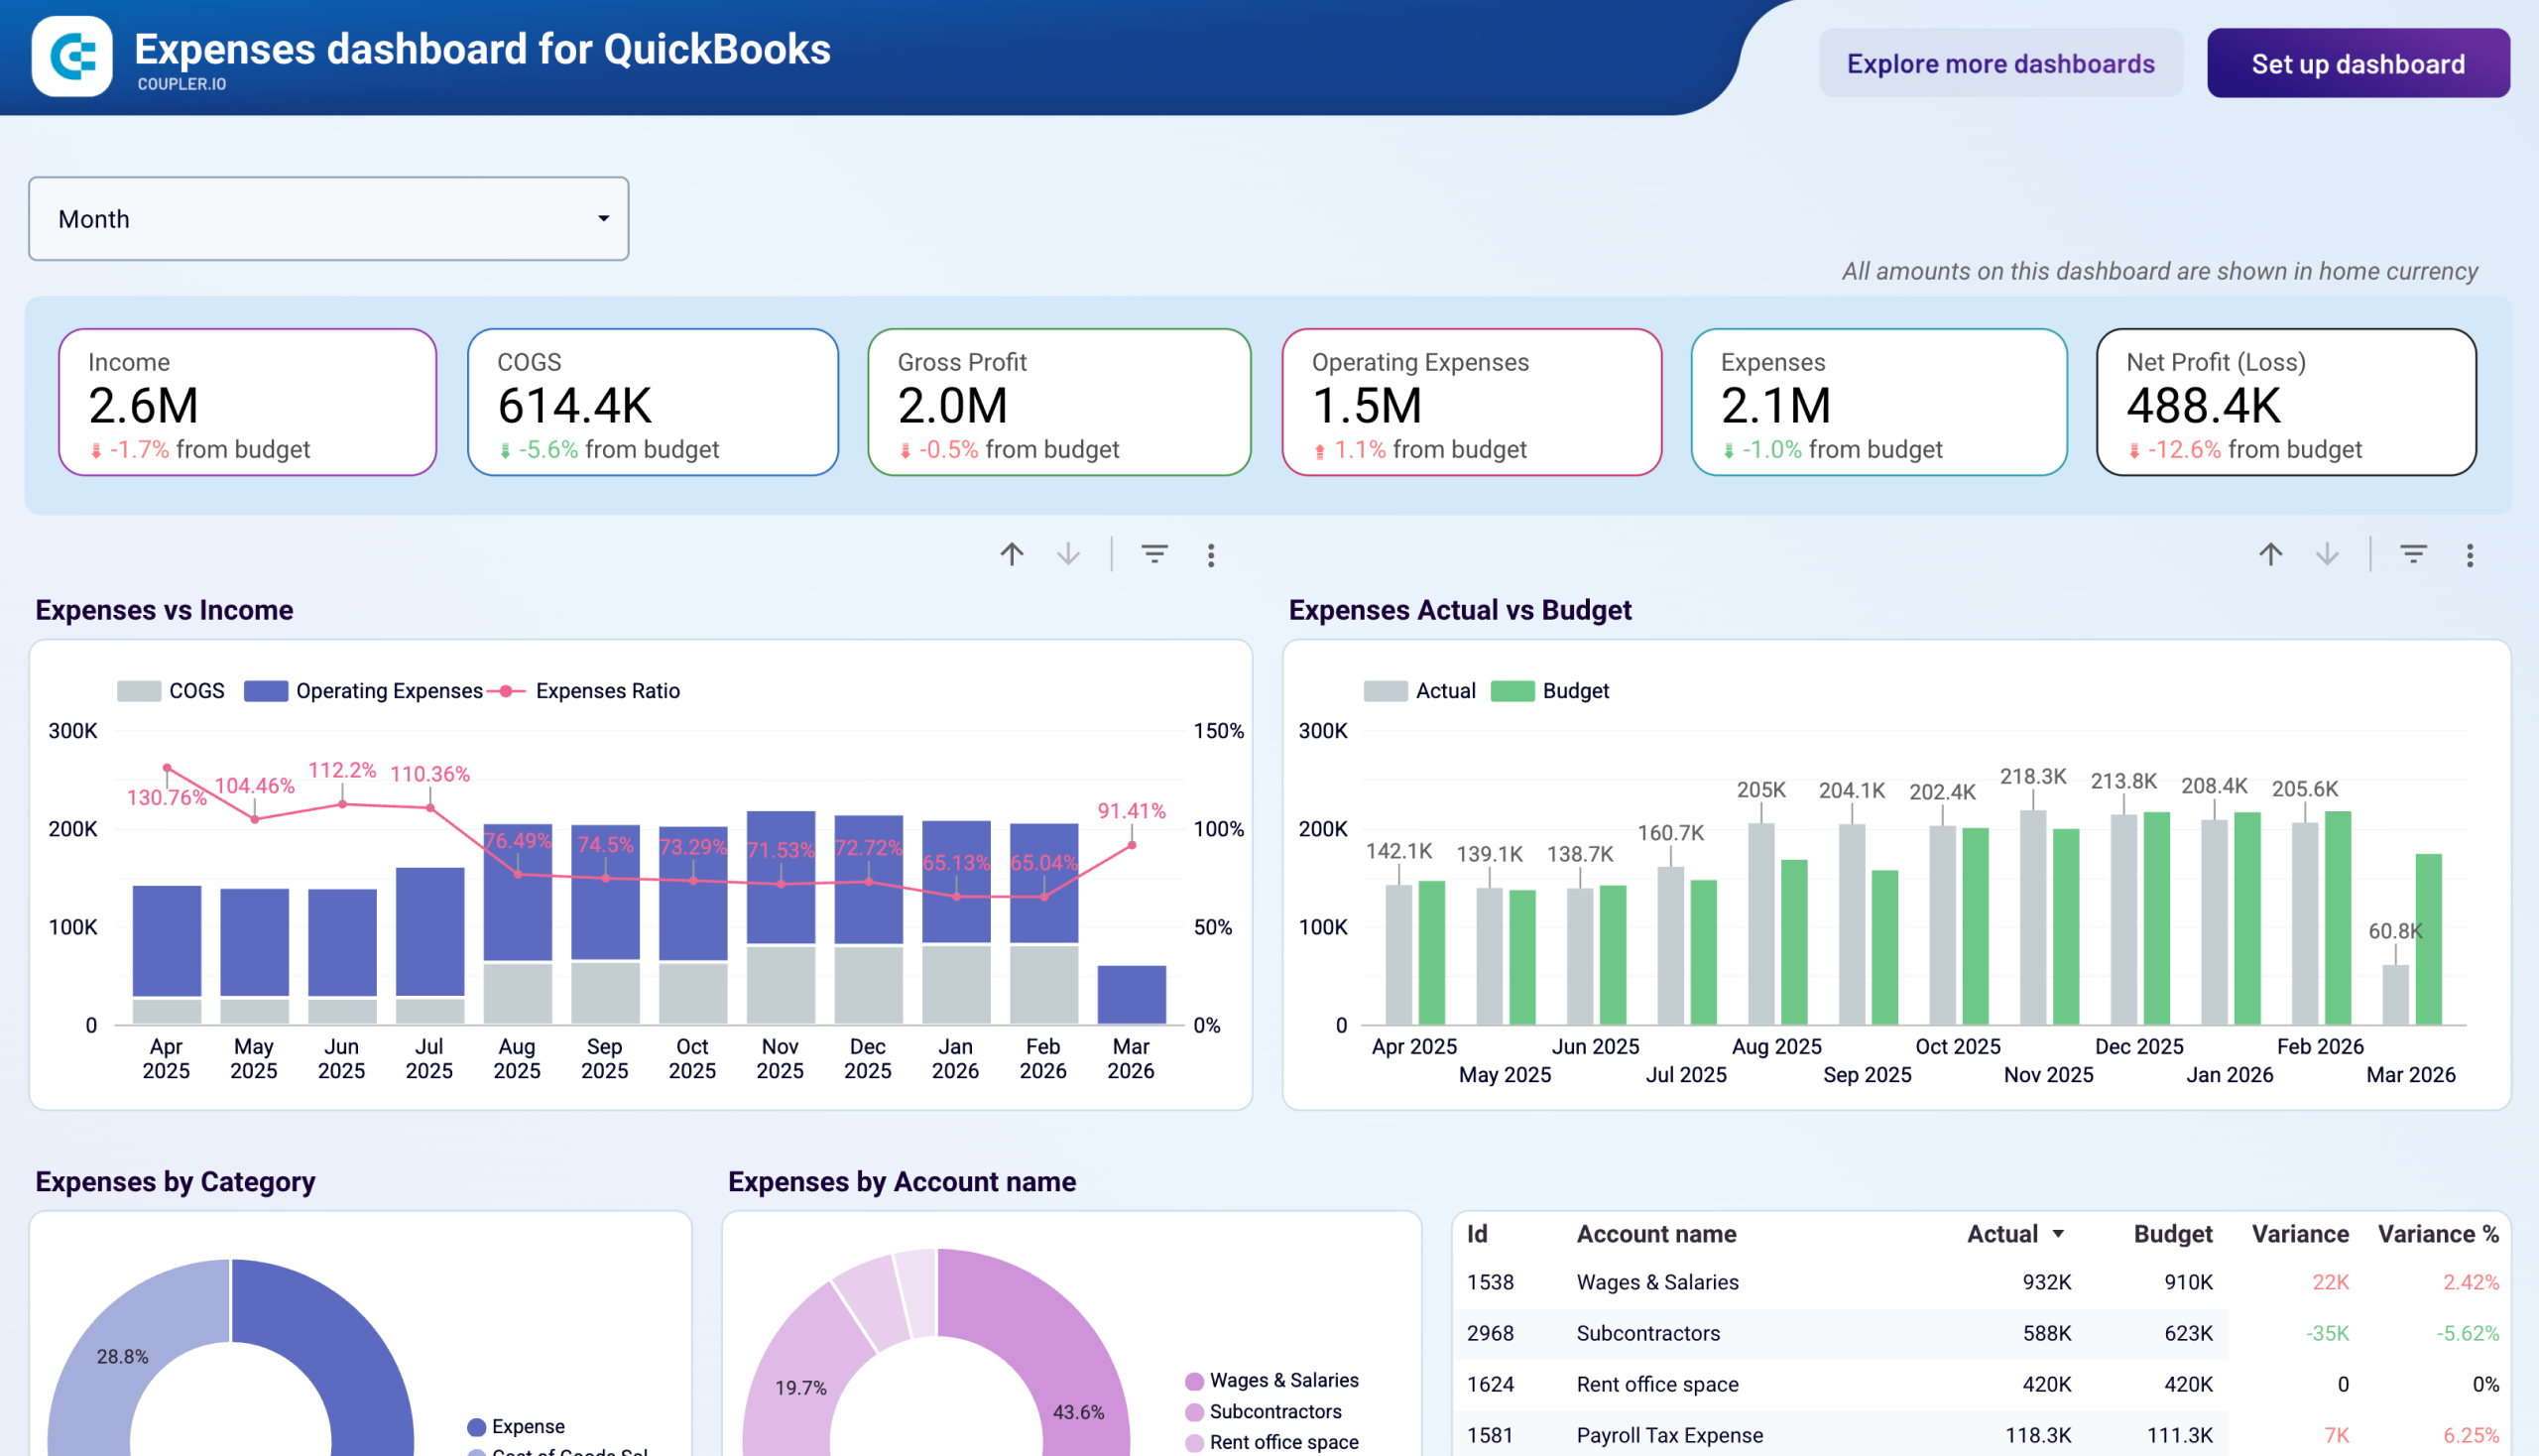
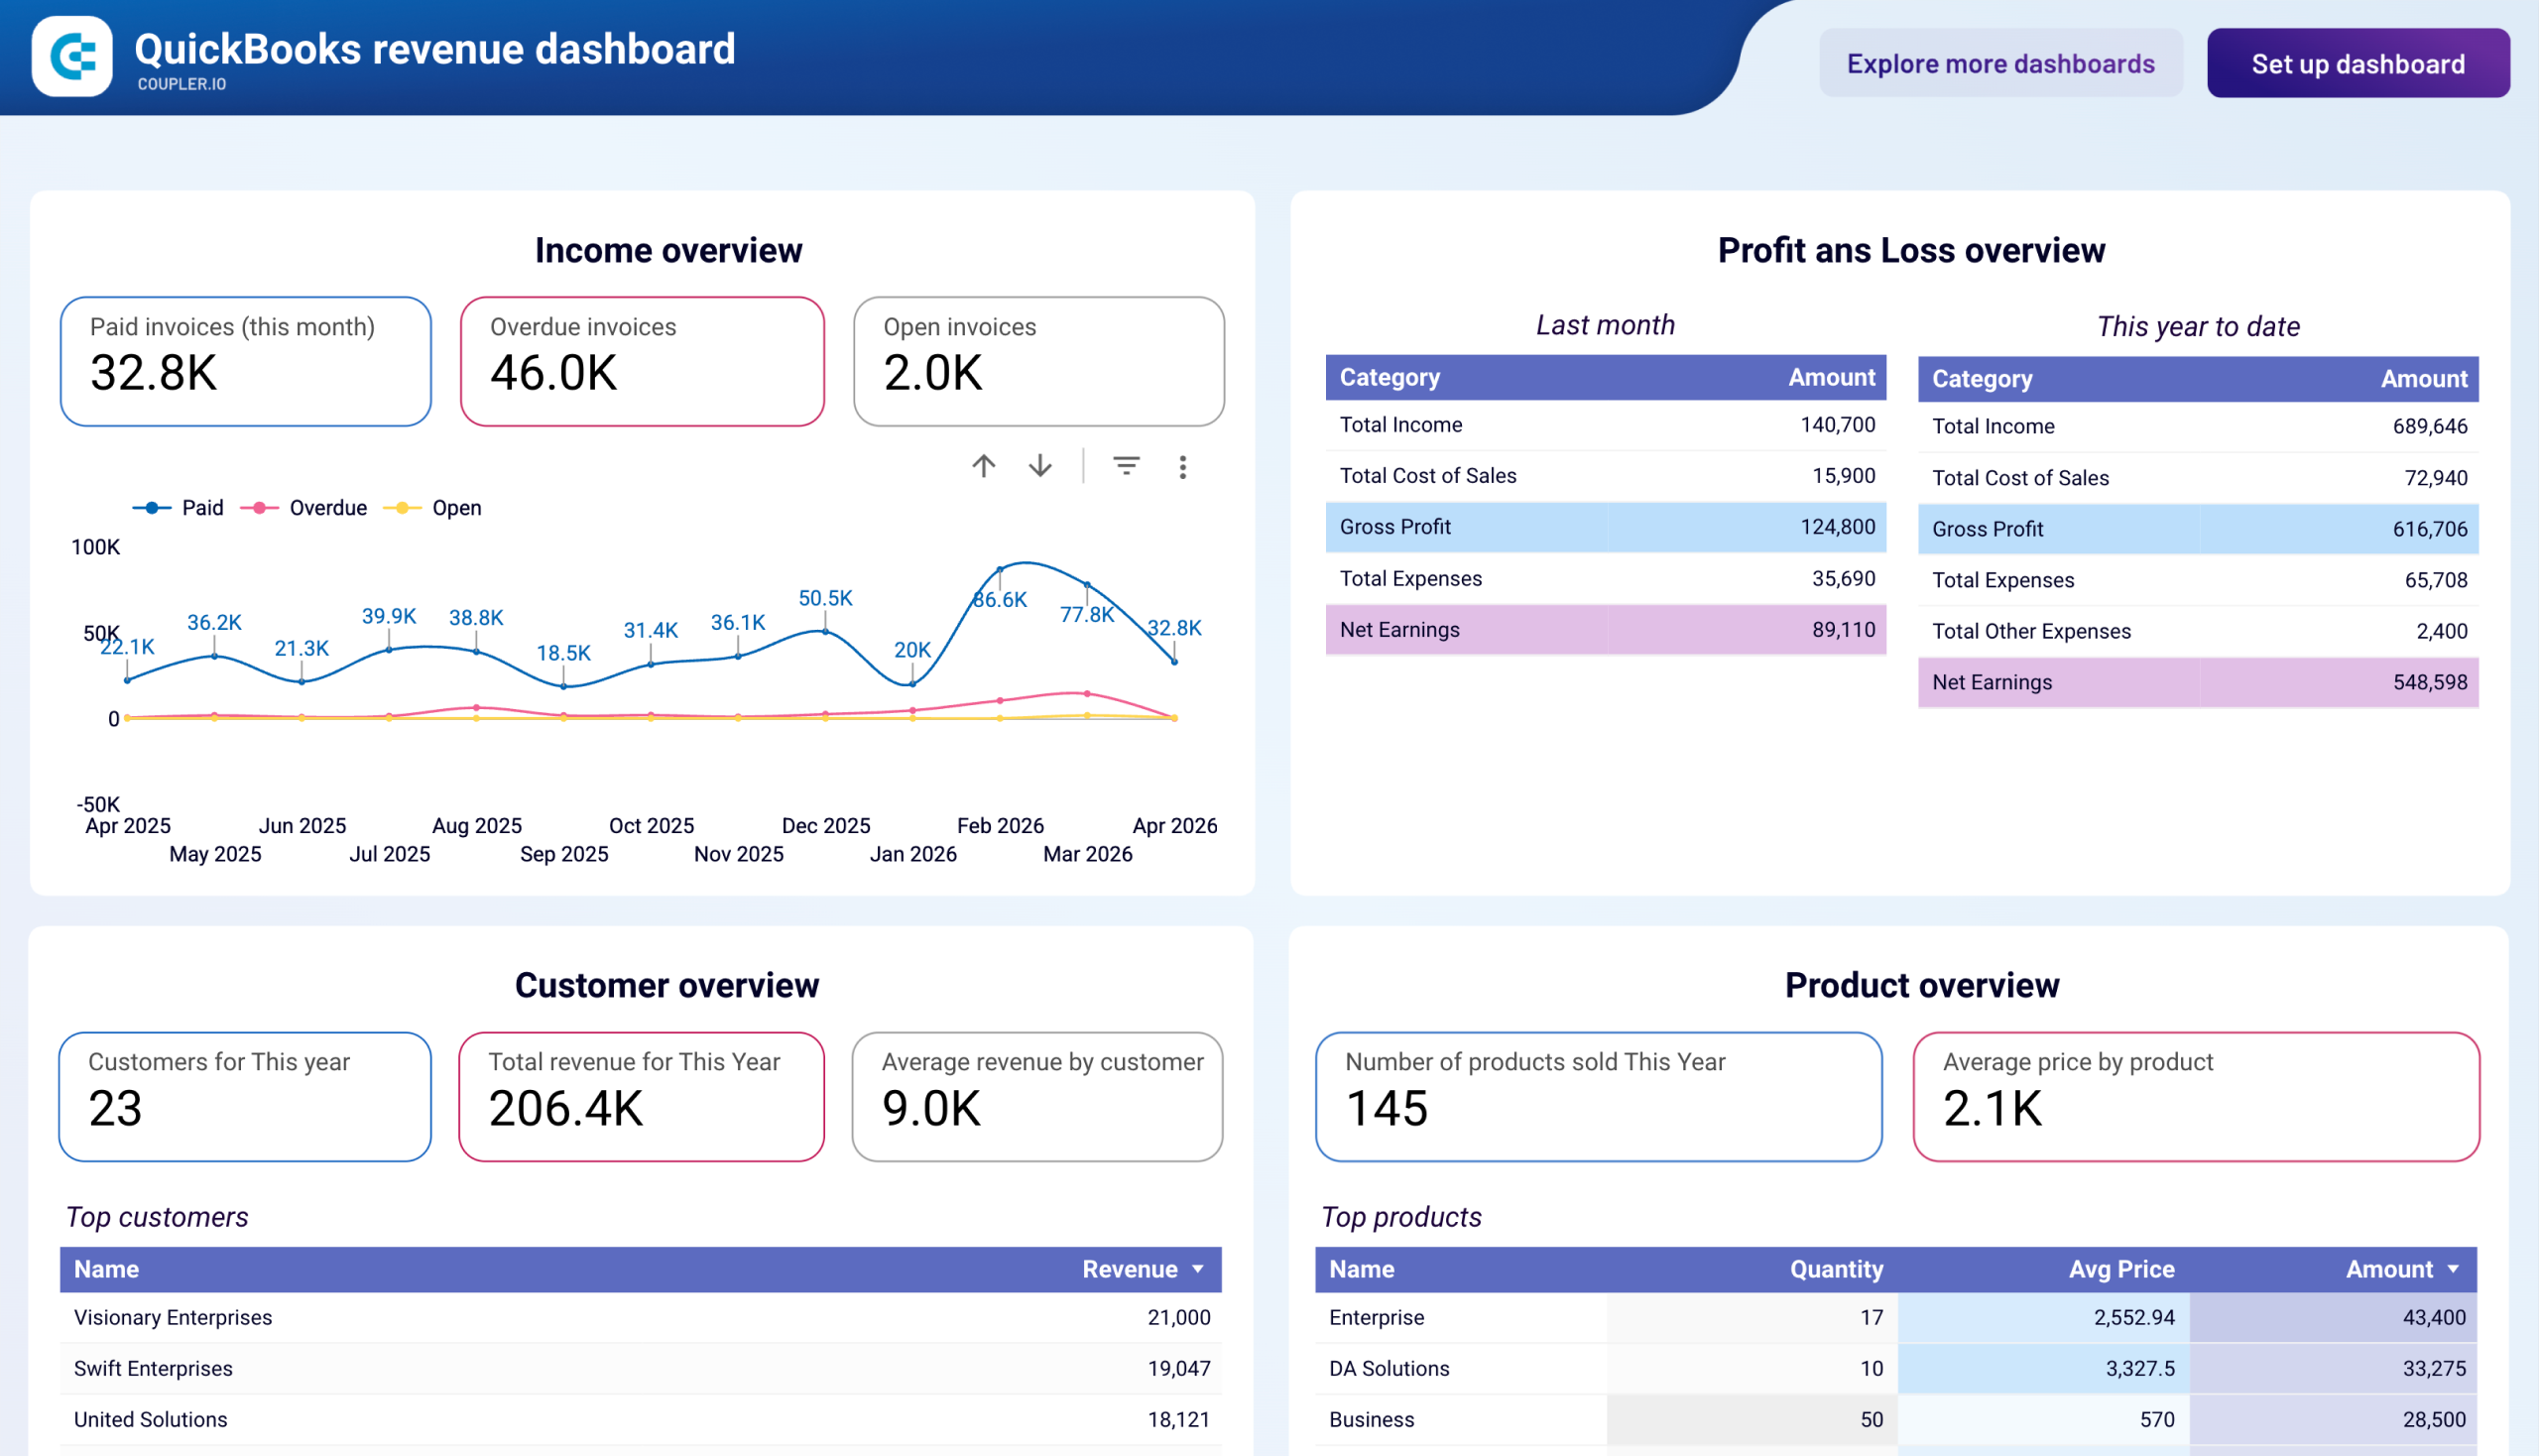
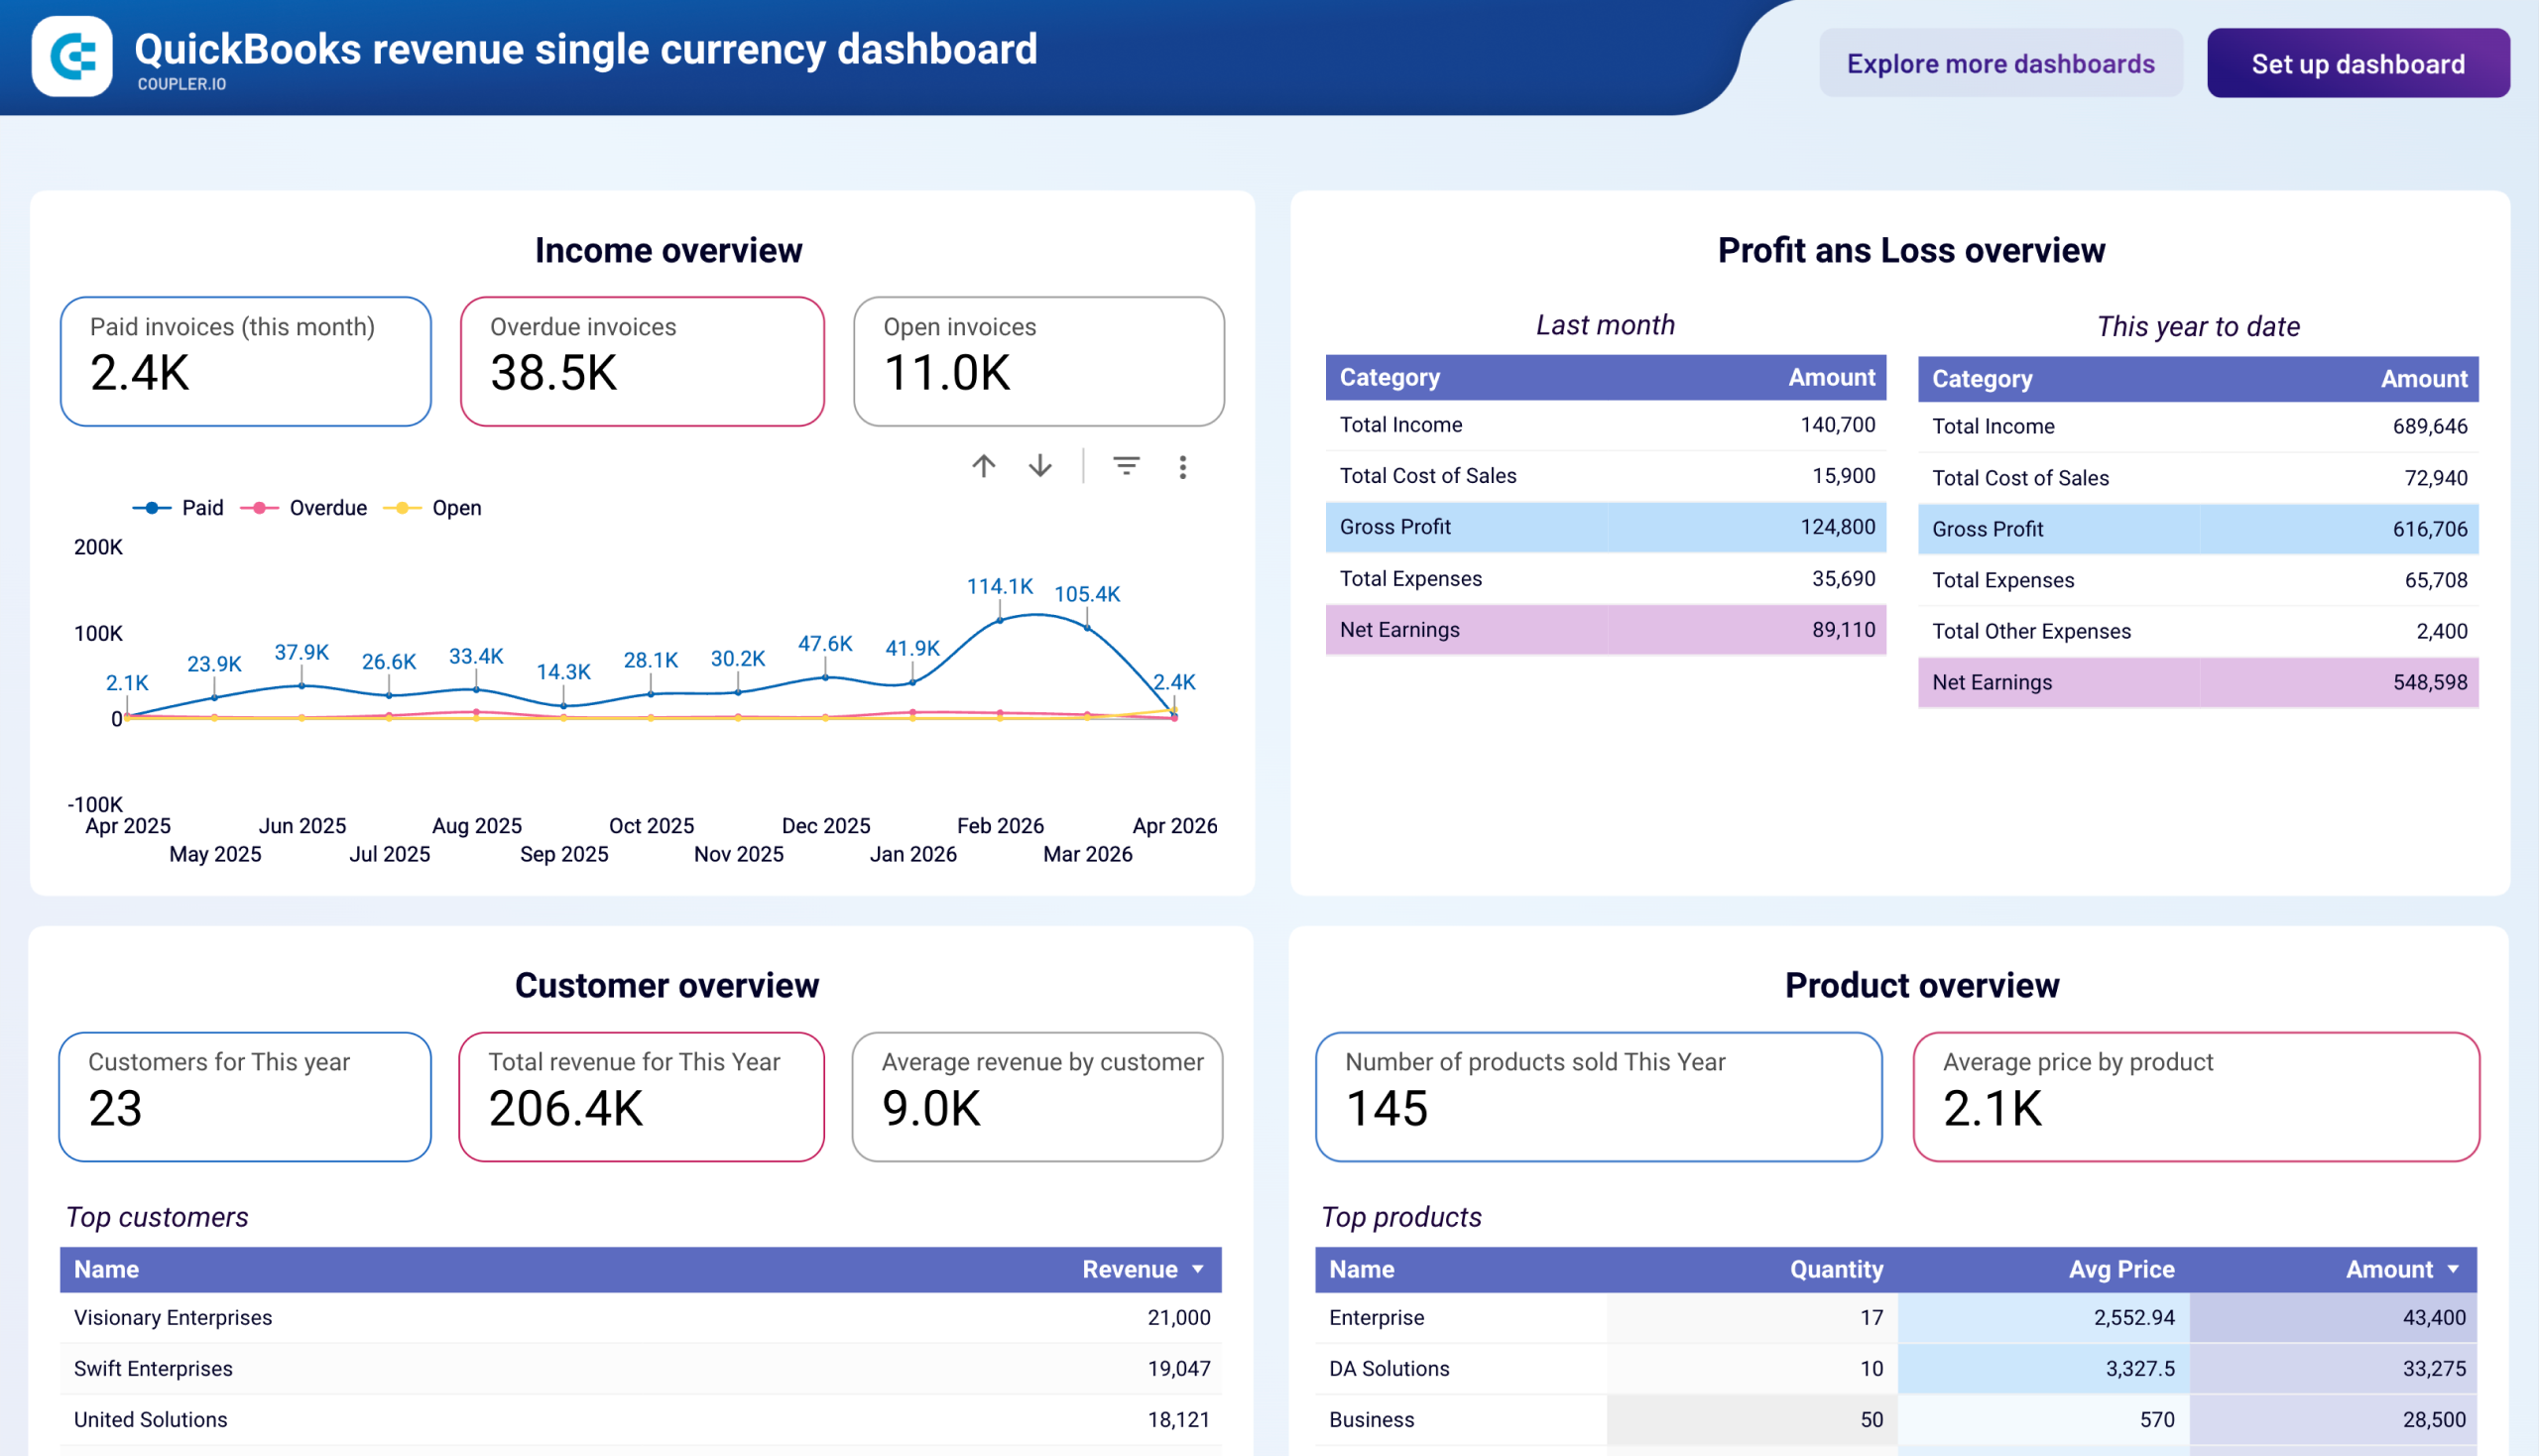
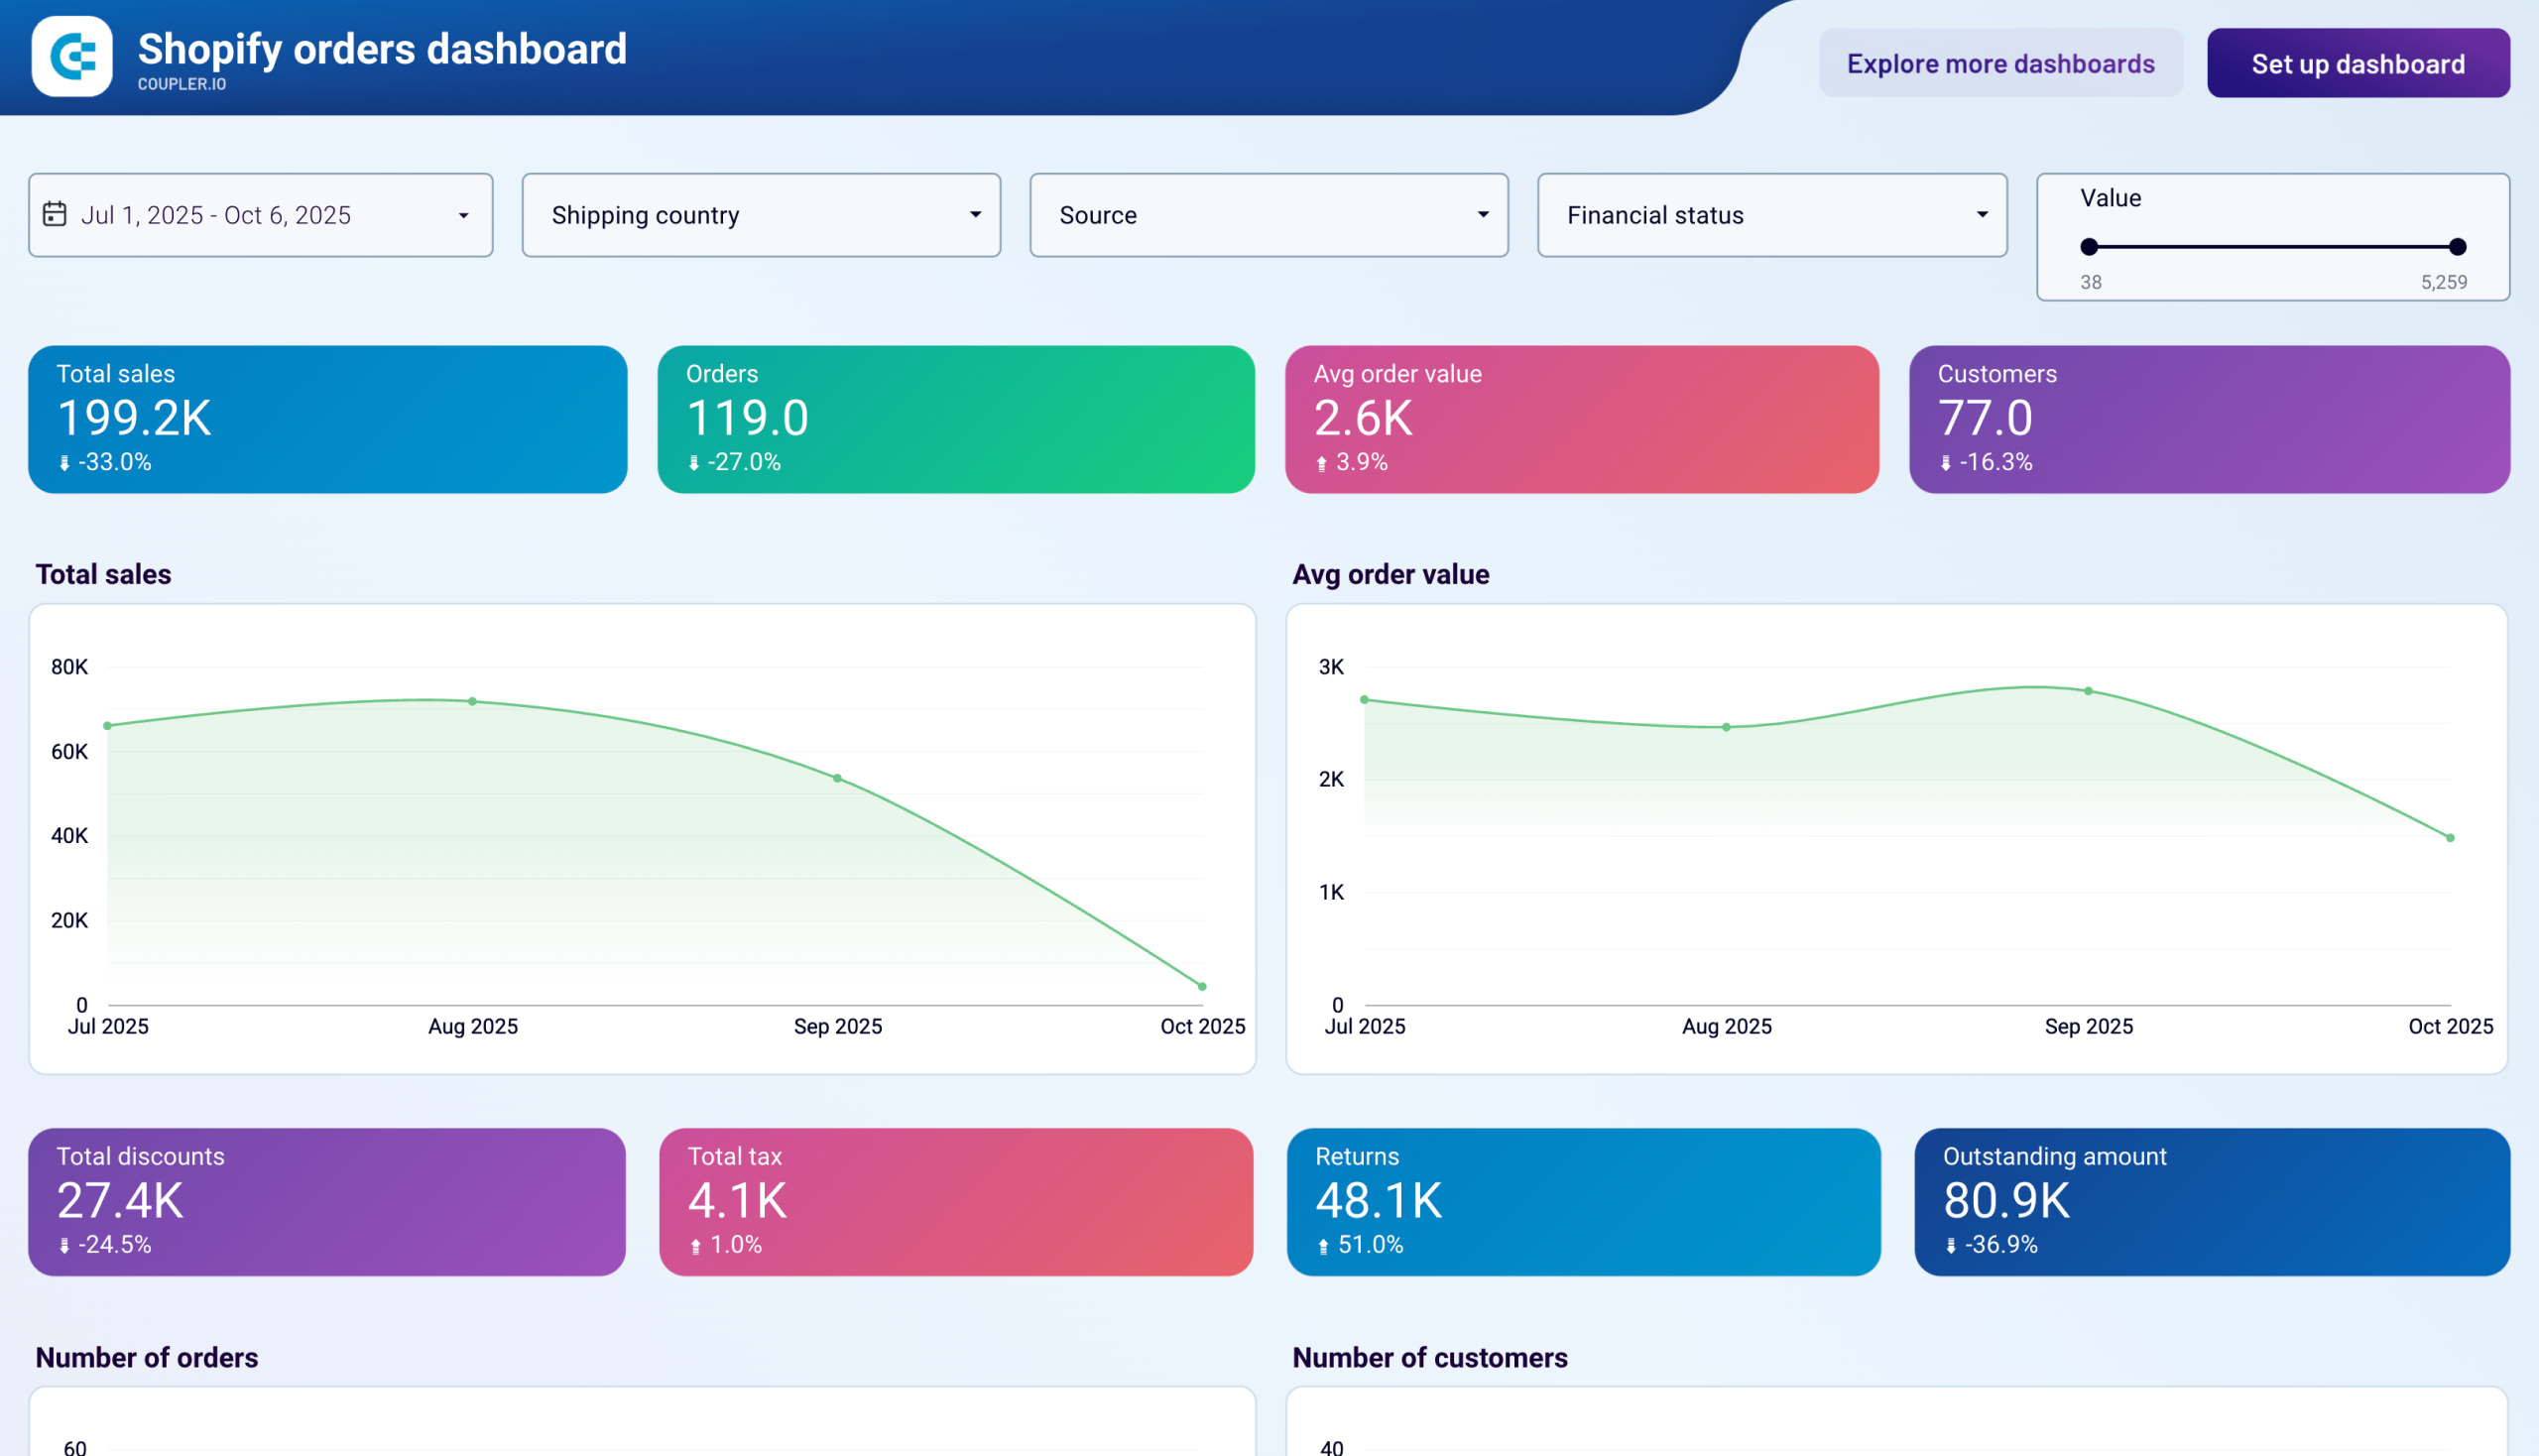
Financial performance reporting templates transform accounting data into executive-level insights. Revenue dashboards for QuickBooks and Xero track income trends across 12 months, analyze customer contribution patterns, and identify top-performing products. Accounts receivable templates monitor unpaid customer invoices by aging periods, which helps prioritize collection efforts and forecast cash inflows. Accounts payable dashboards display vendor payment obligations with aging breakdowns for strategic payment timing that maintains supplier relationships while optimizing cash position. The billing dashboard combines receivables and payables perspectives and compares overdue amounts on both sides to predict cash crunches before they materialize.

Sales and CRM performance report

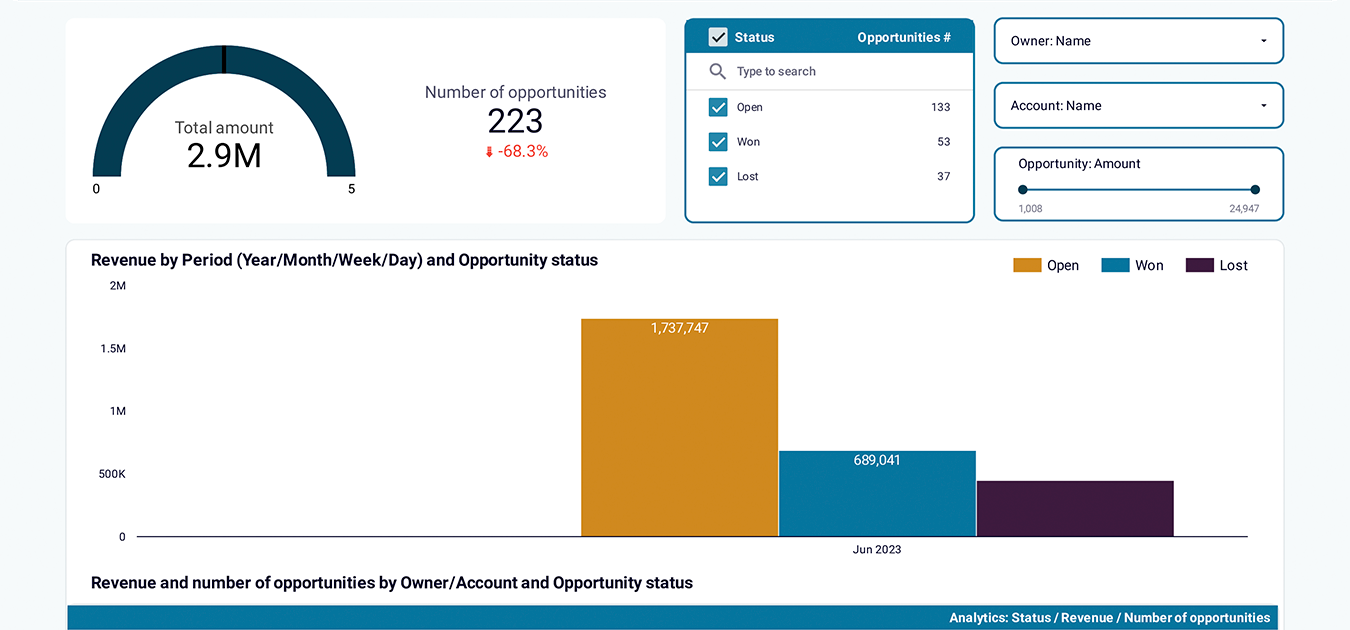
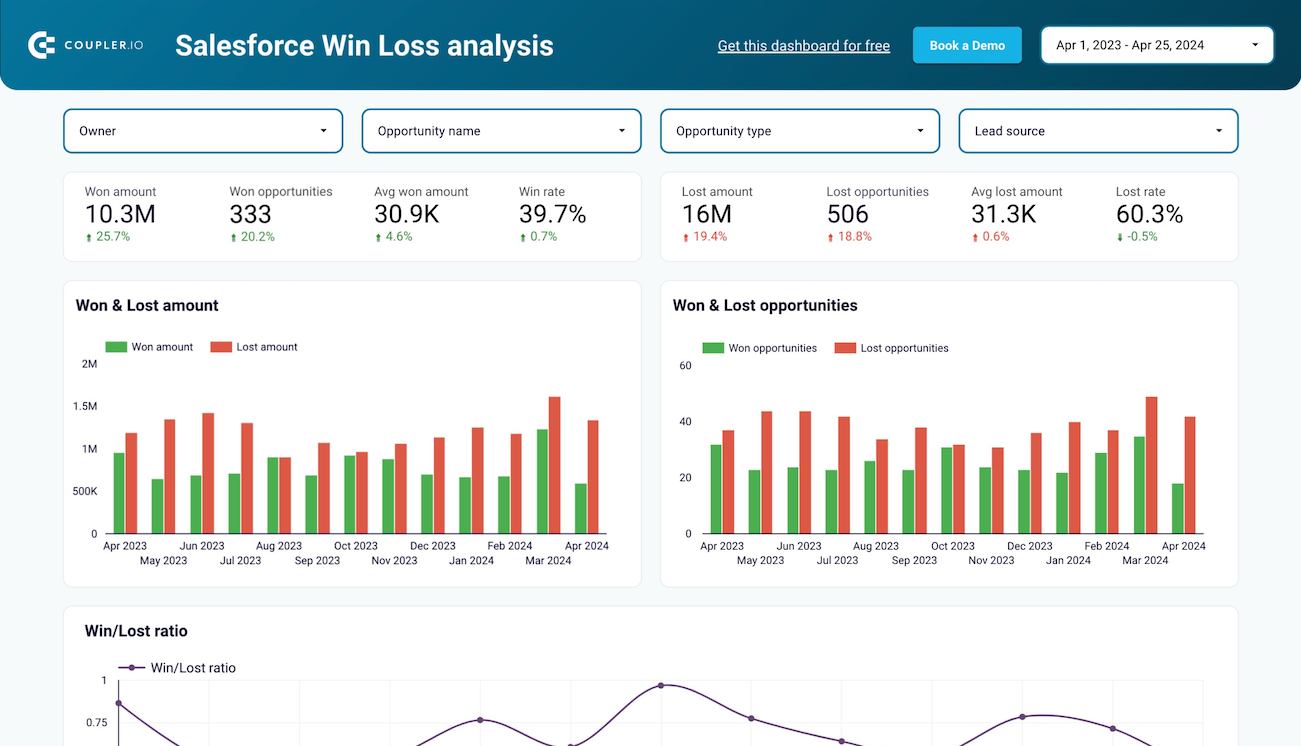
Sales and CRM templates provide visibility into pipeline health and deal progression. The Salesforce CRM template breaks down opportunities across deal stages, compares sales rep performance through win rates and close times, and identifies stalled opportunities that require intervention. HubSpot marketing dashboards combine website visitor data with sales funnel metrics, tracking the complete journey from initial page view through subscriber, lead, and customer stages with channel attribution. Win-loss analysis templates segment deals by industry, owner, and lead source to identify the most productive acquisition patterns.

Web analytics and content performance report

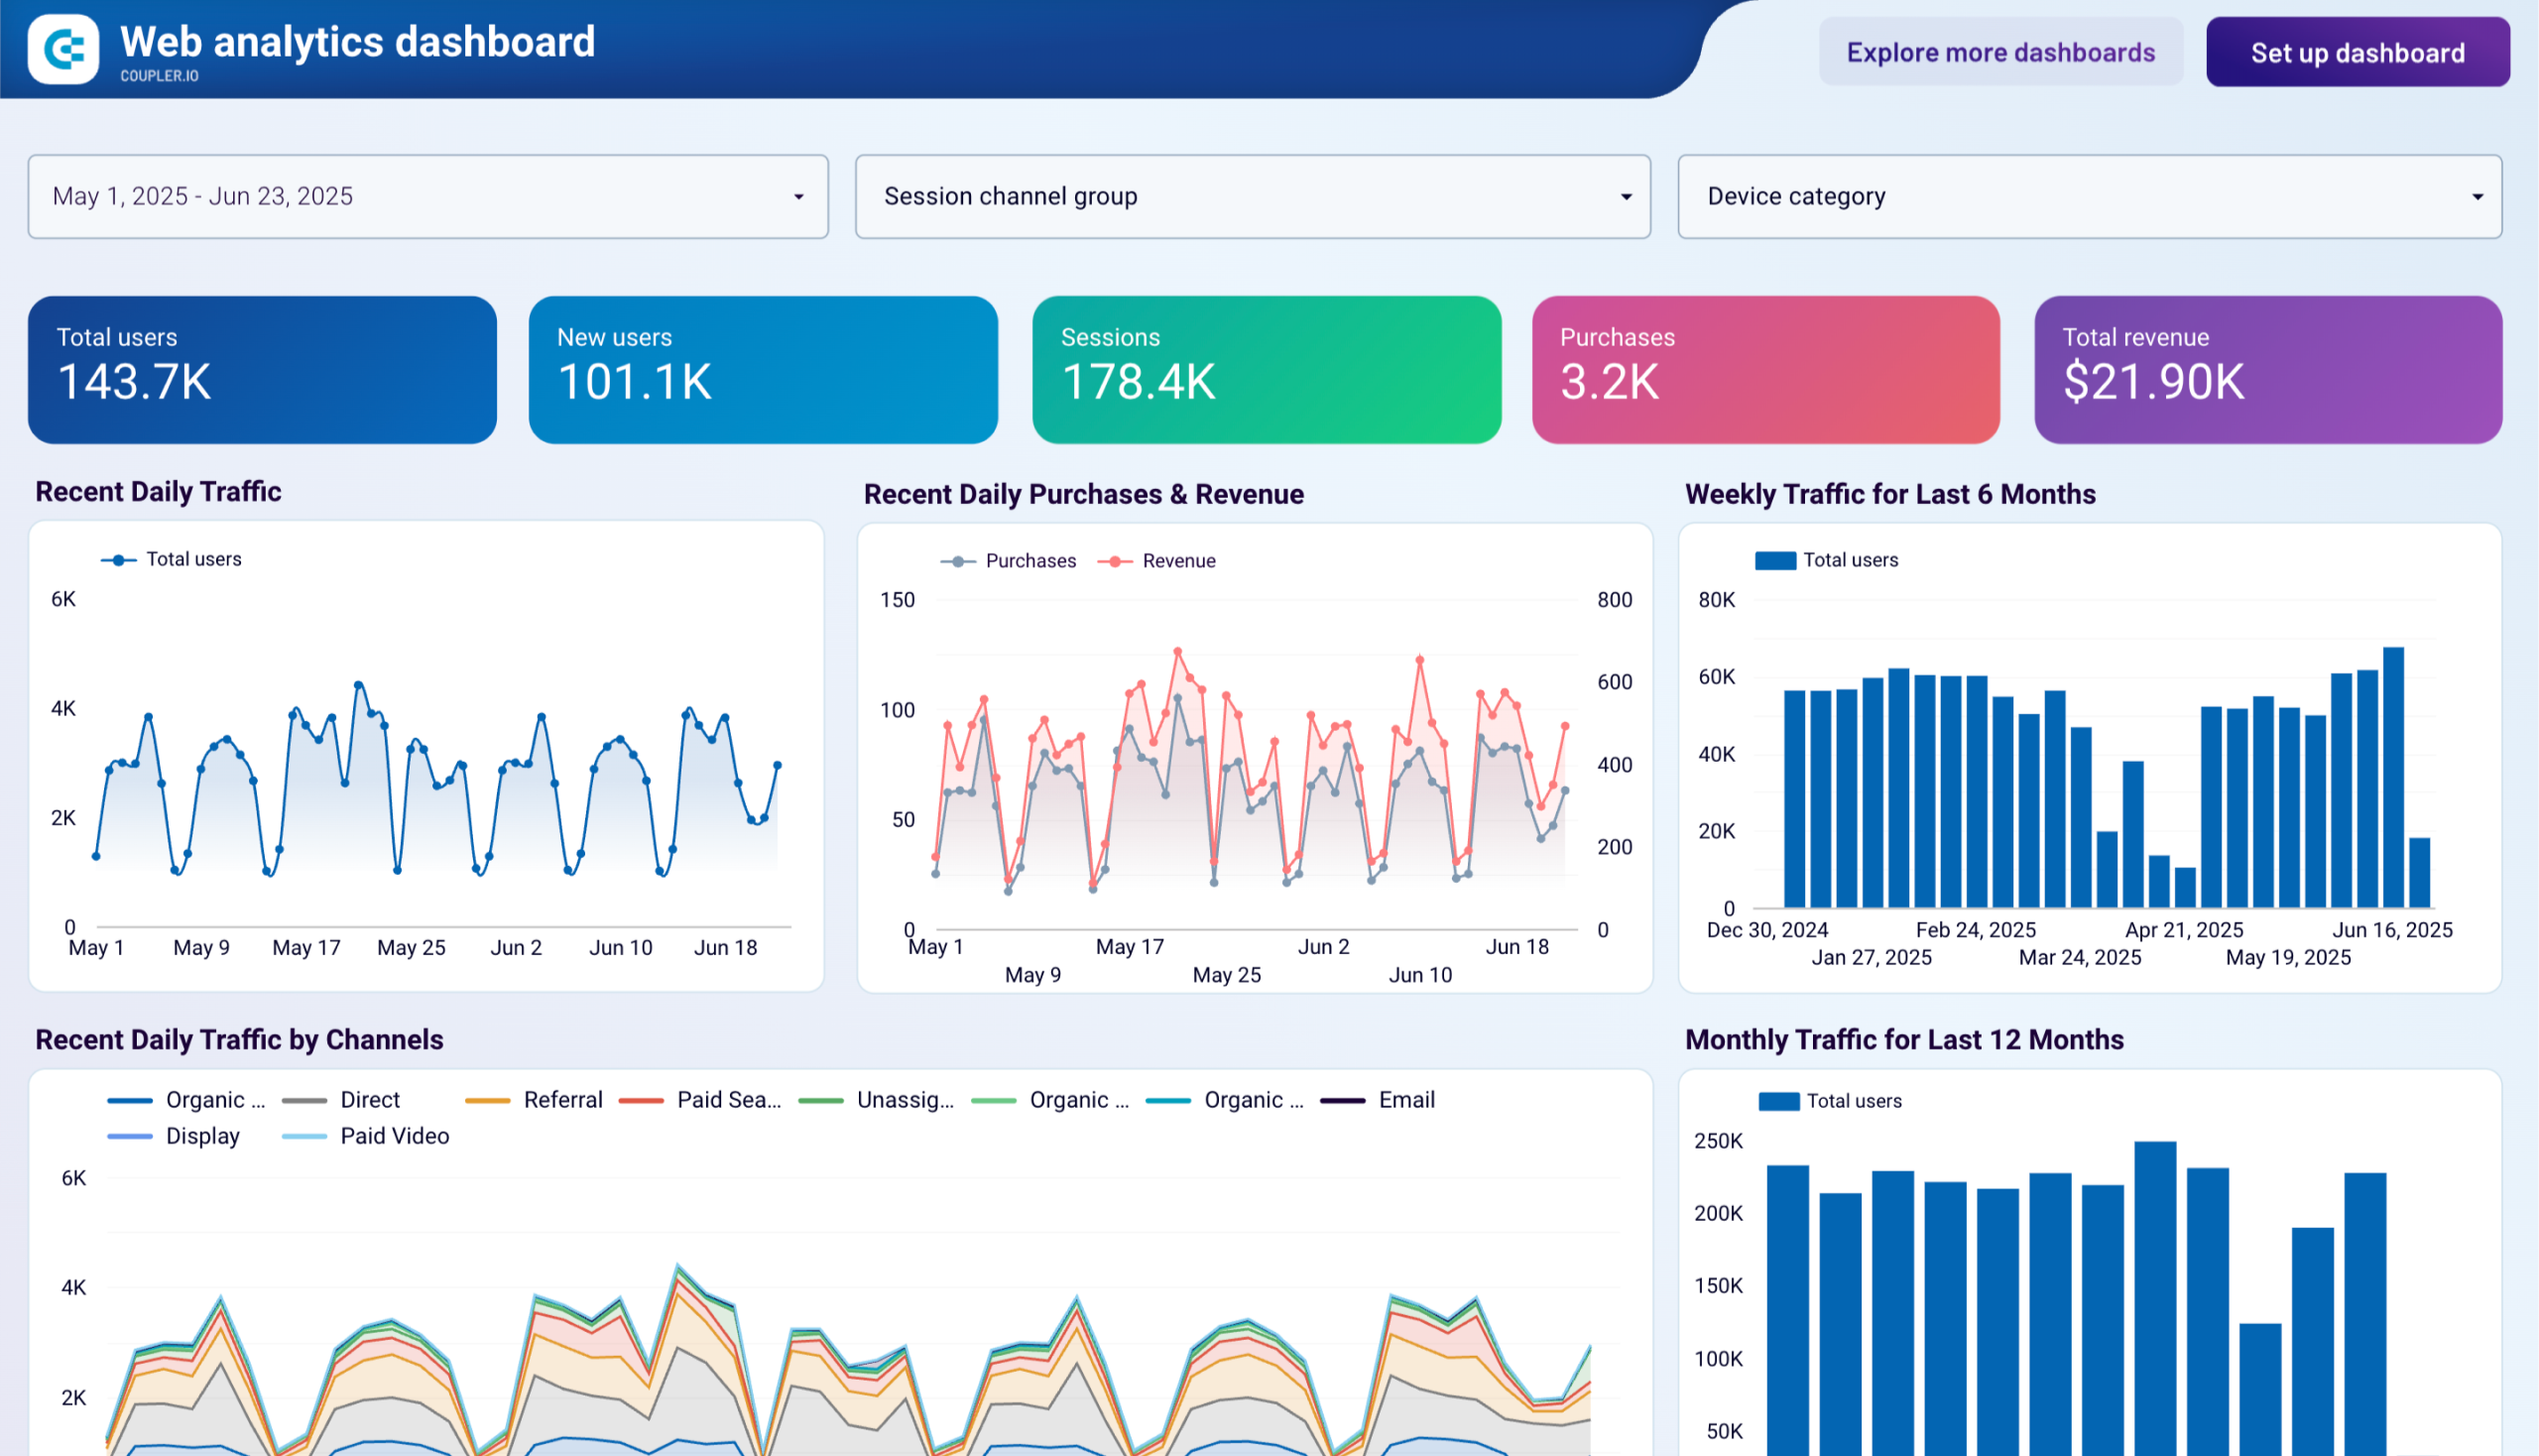
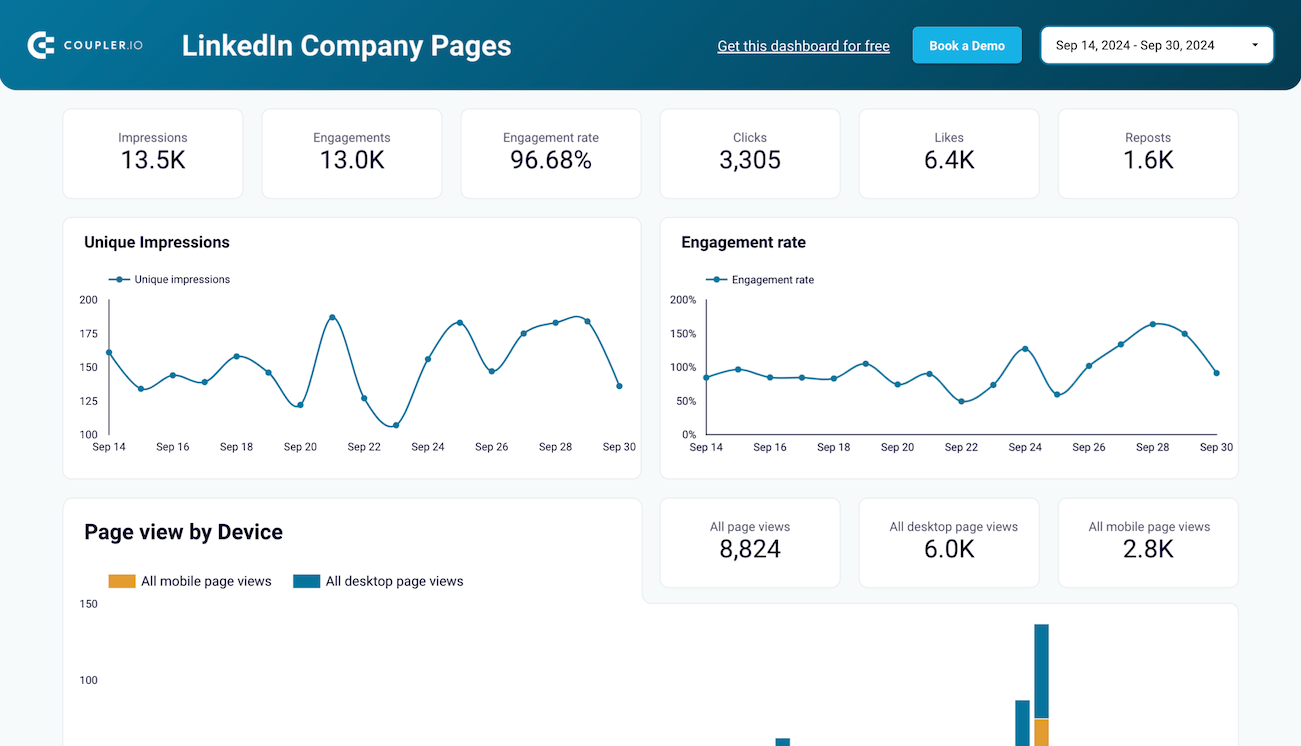
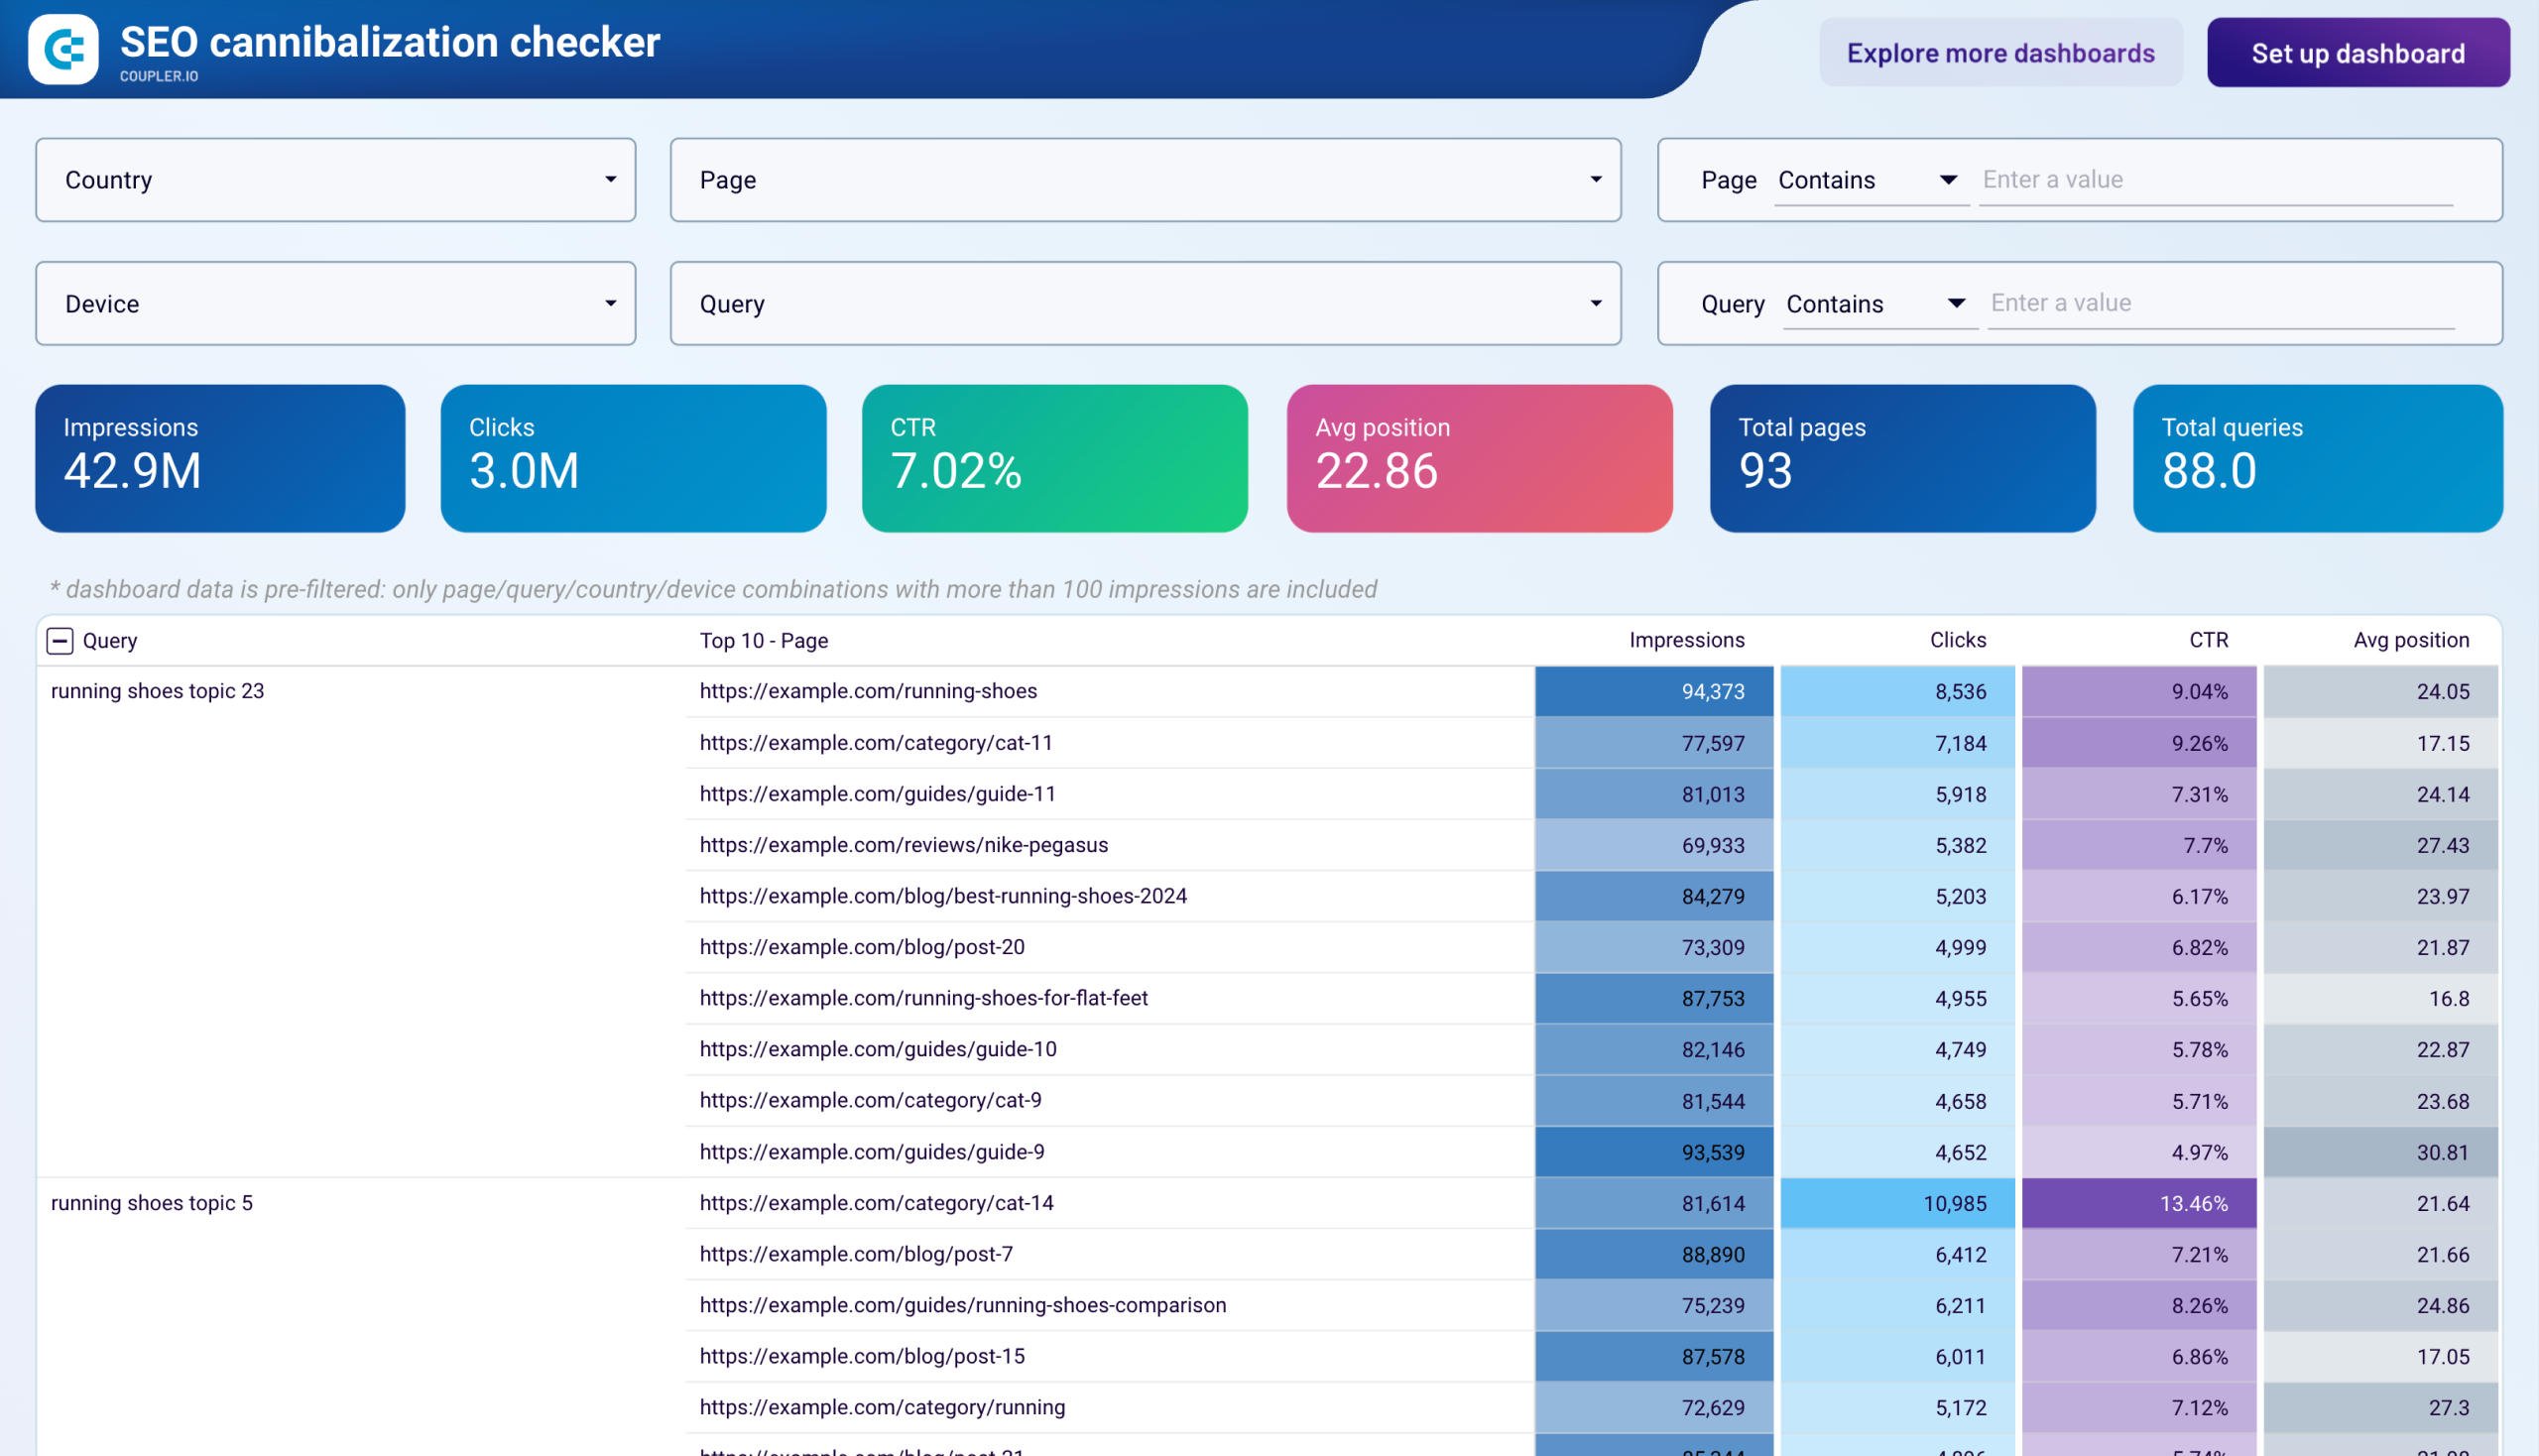
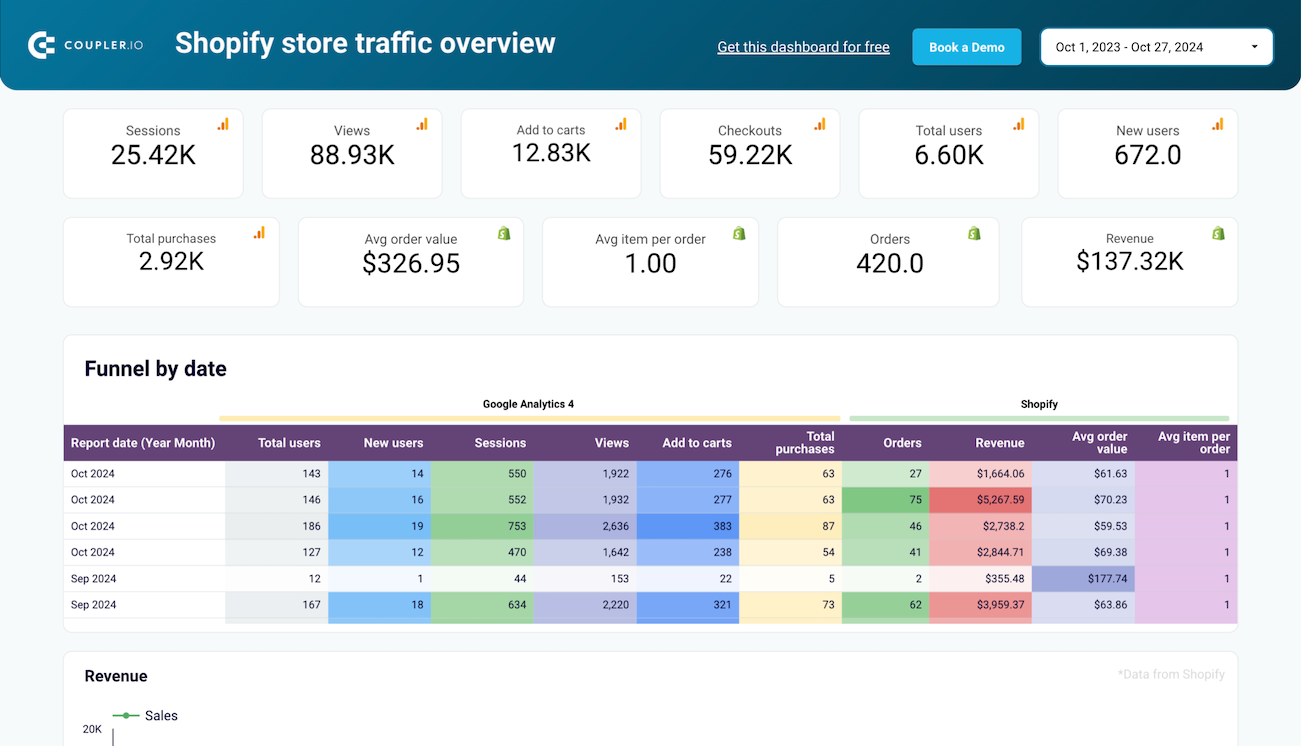
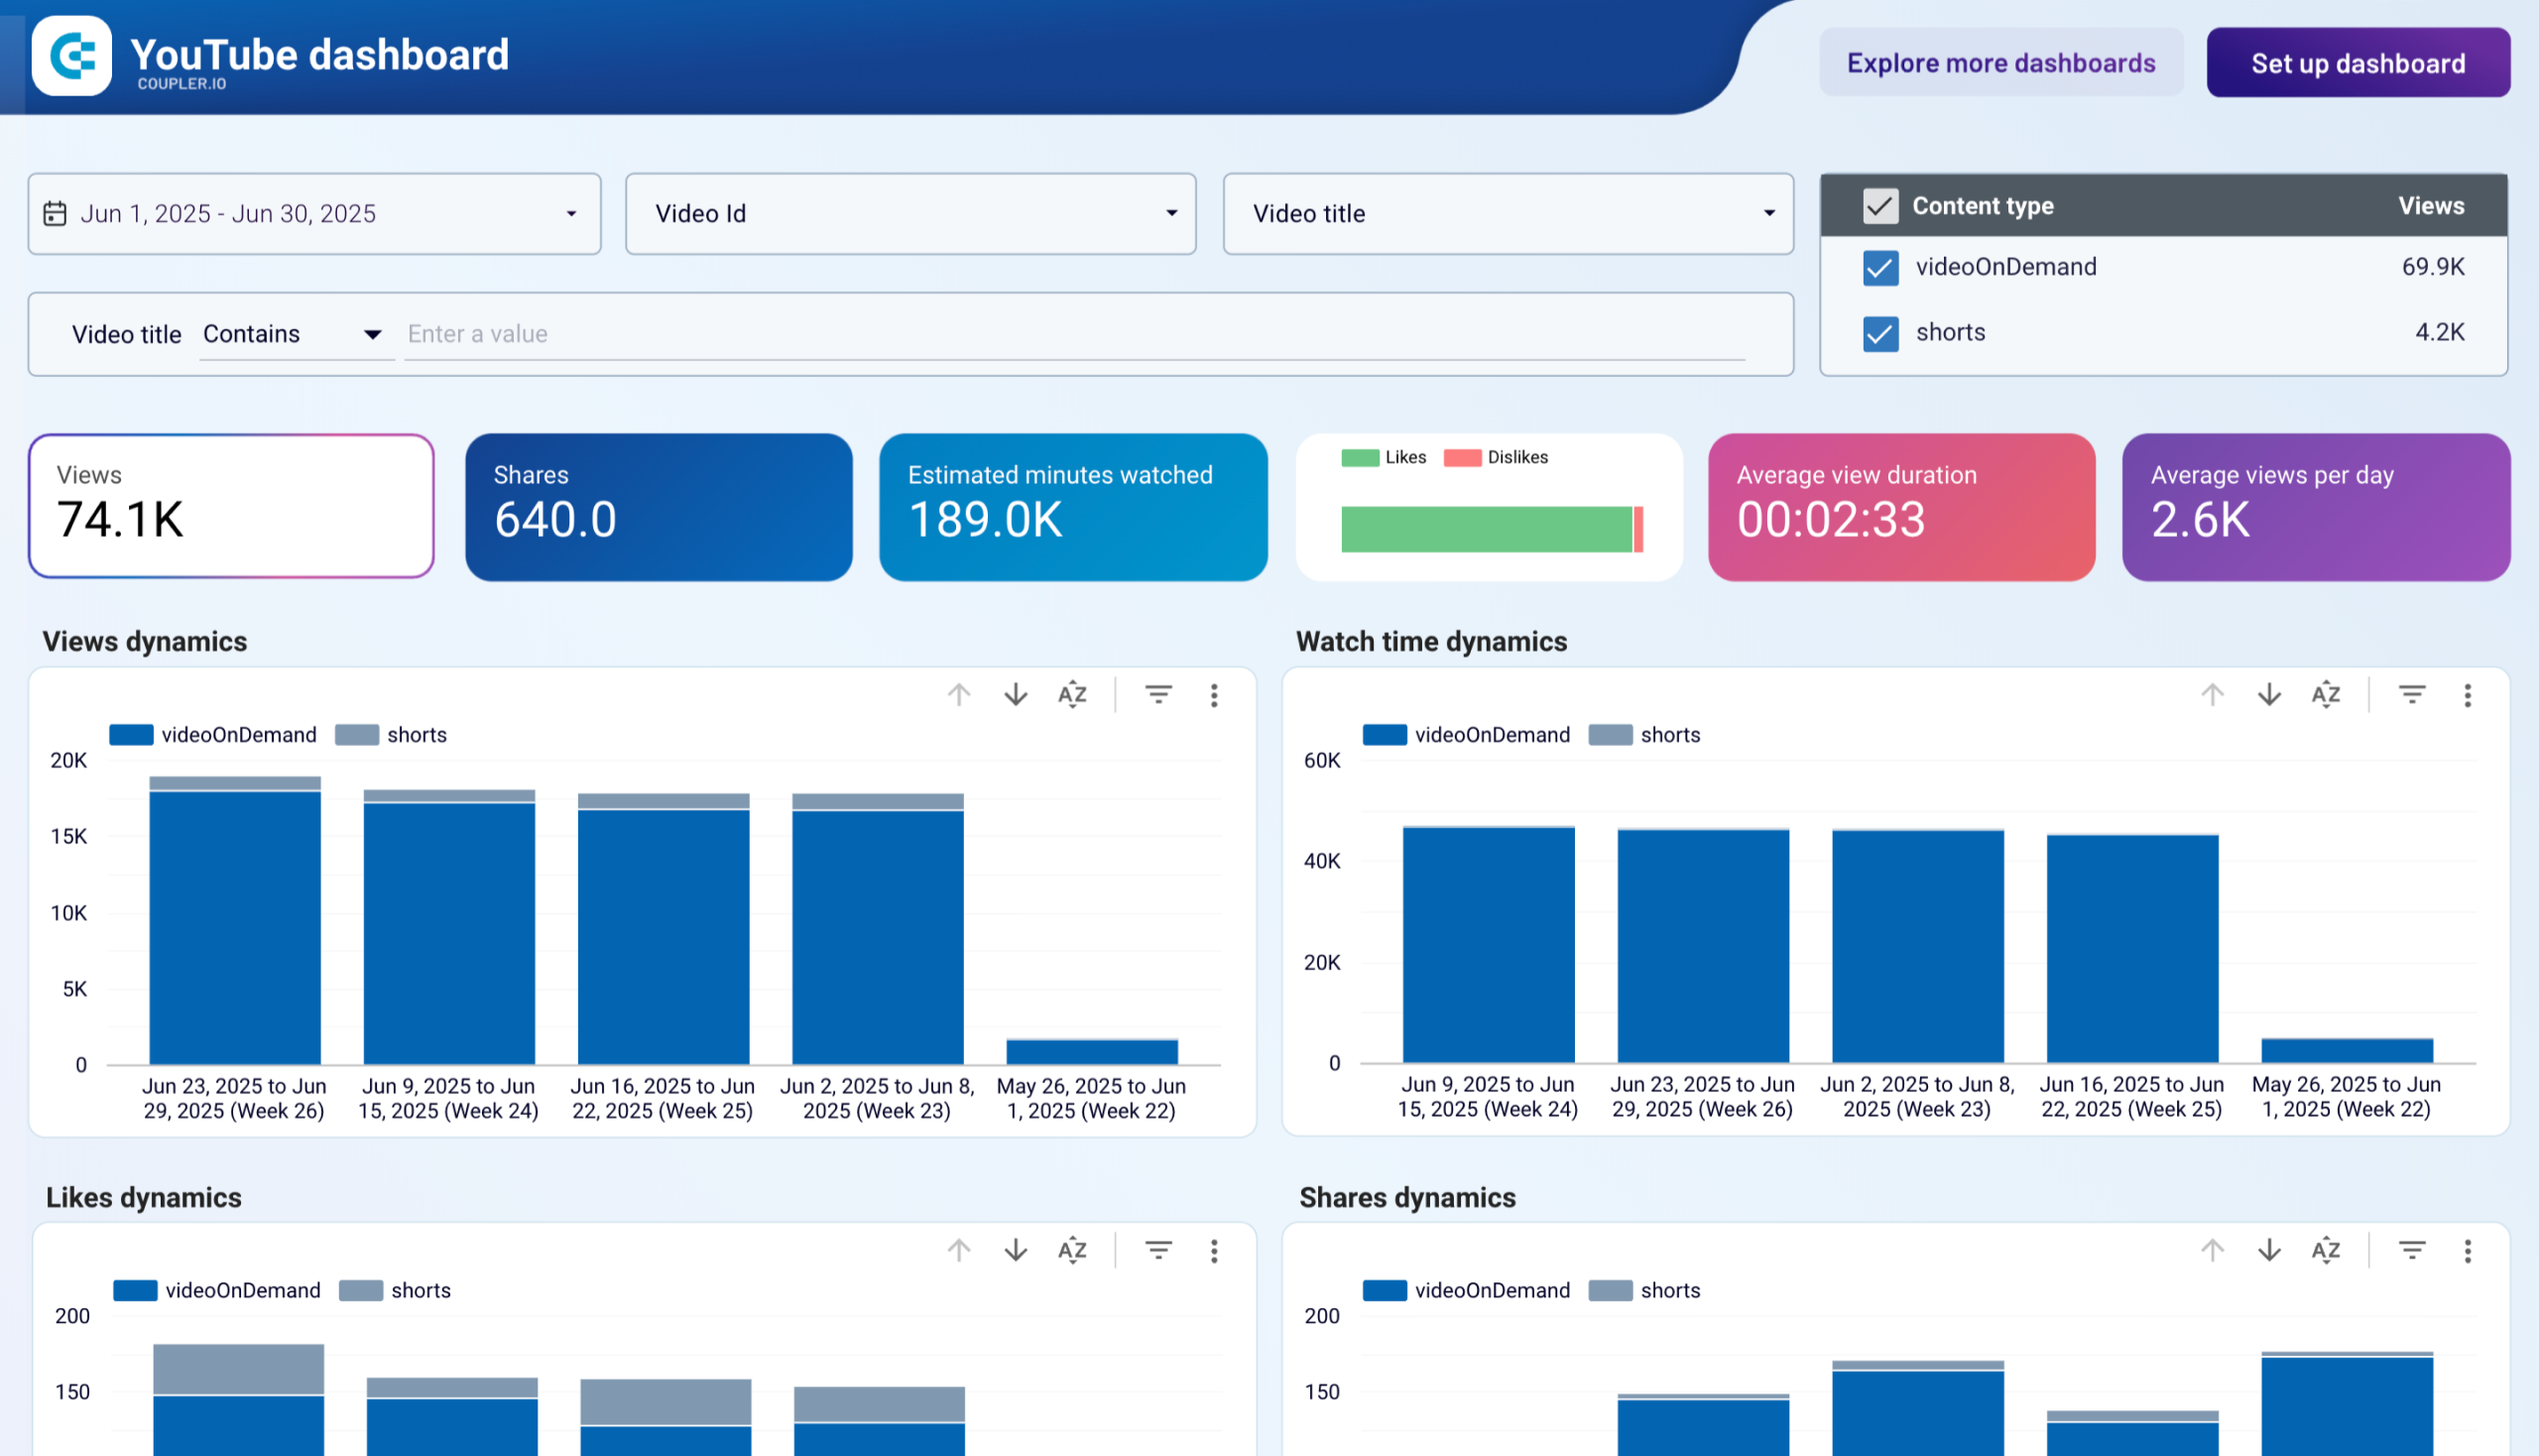
Web analytics and content performance reports evaluate digital property effectiveness. The web analytics template built on Google Analytics 4 data tracks user acquisition, engagement metrics, and conversion performance with daily updates on traffic growth. Landing page performance dashboards merge Google Search Console data with GA4 metrics to analyze how pages drive traffic, engage visitors, and convert them into customers. These templates identify optimization opportunities by revealing pages with high impressions but low click-through rates or strong traffic but weak conversion performance.

What insights you can get with the Looker Studio templates examples

Evaluate advertising performance across all channels
looker-studio-templates-1.png
Find this insight in the PPC Multi-Channel Dashboard template.

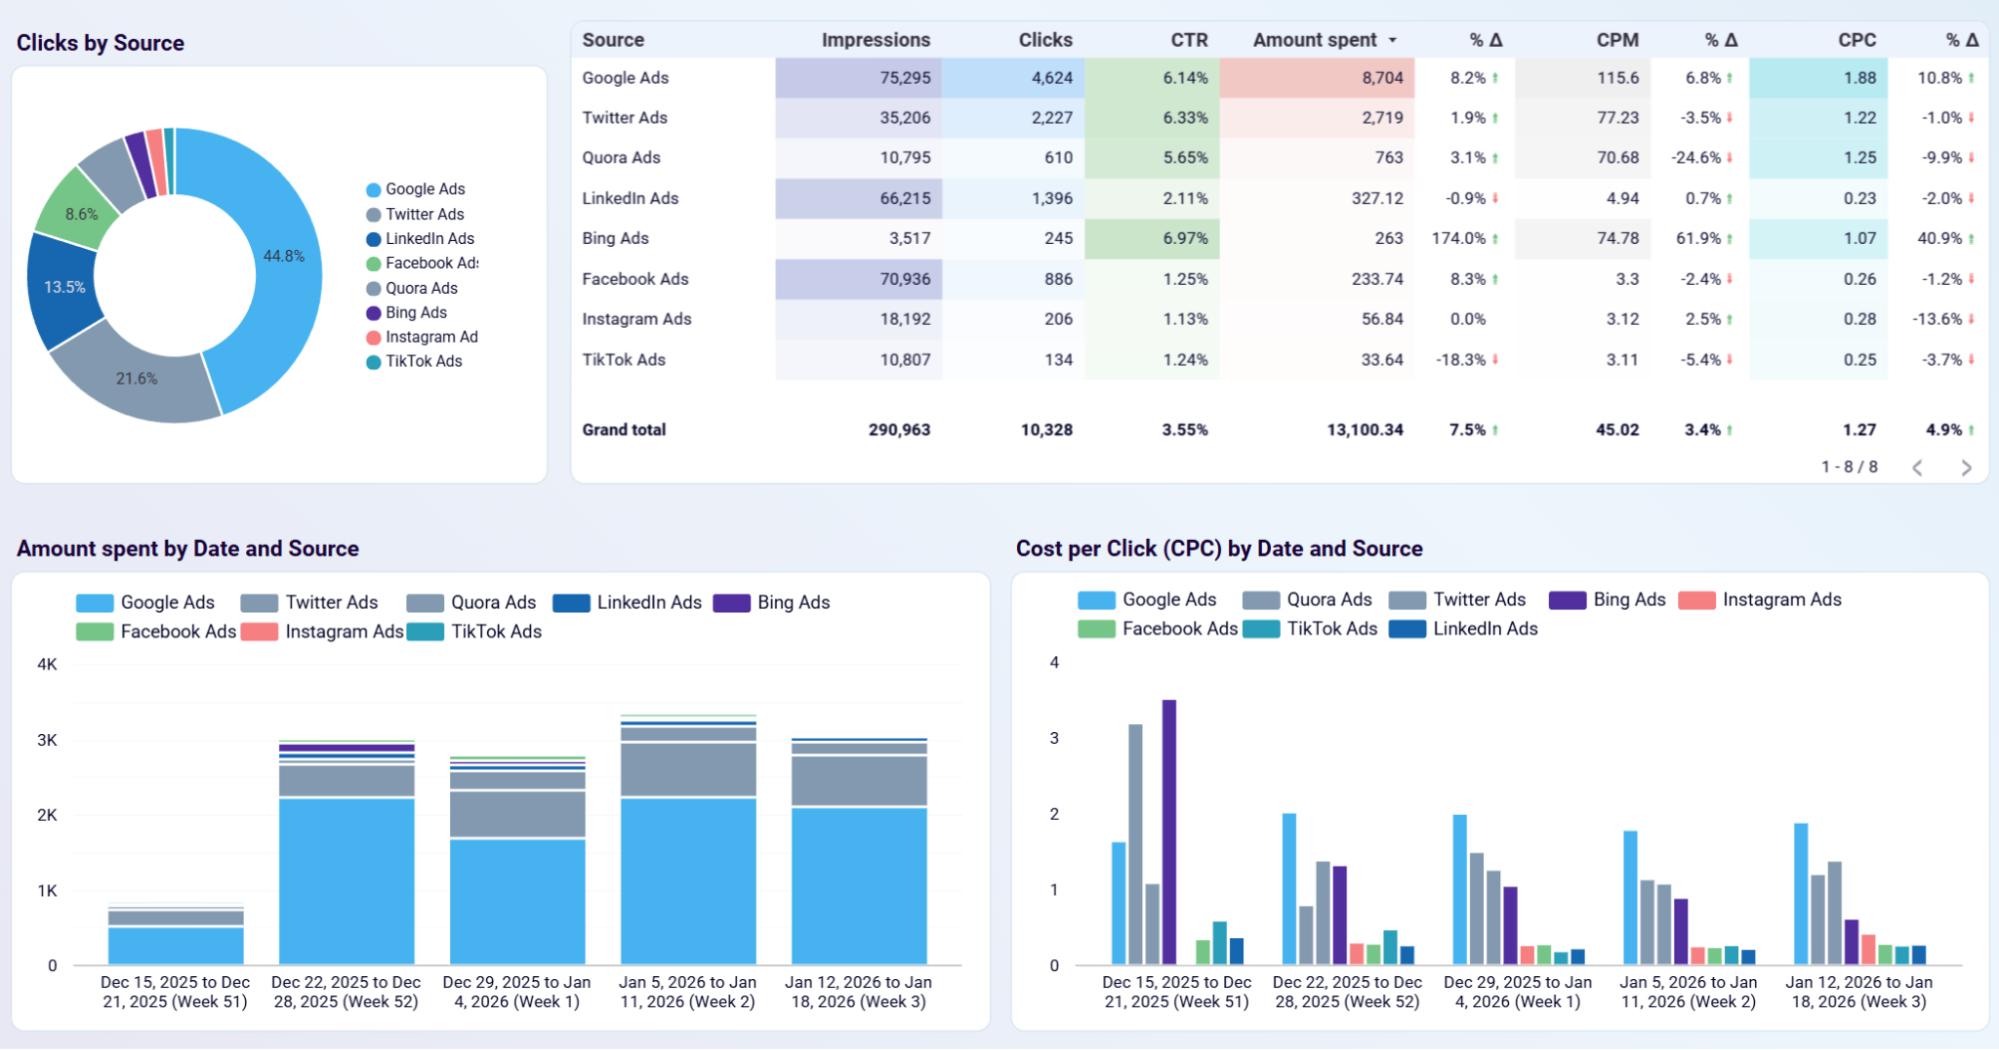
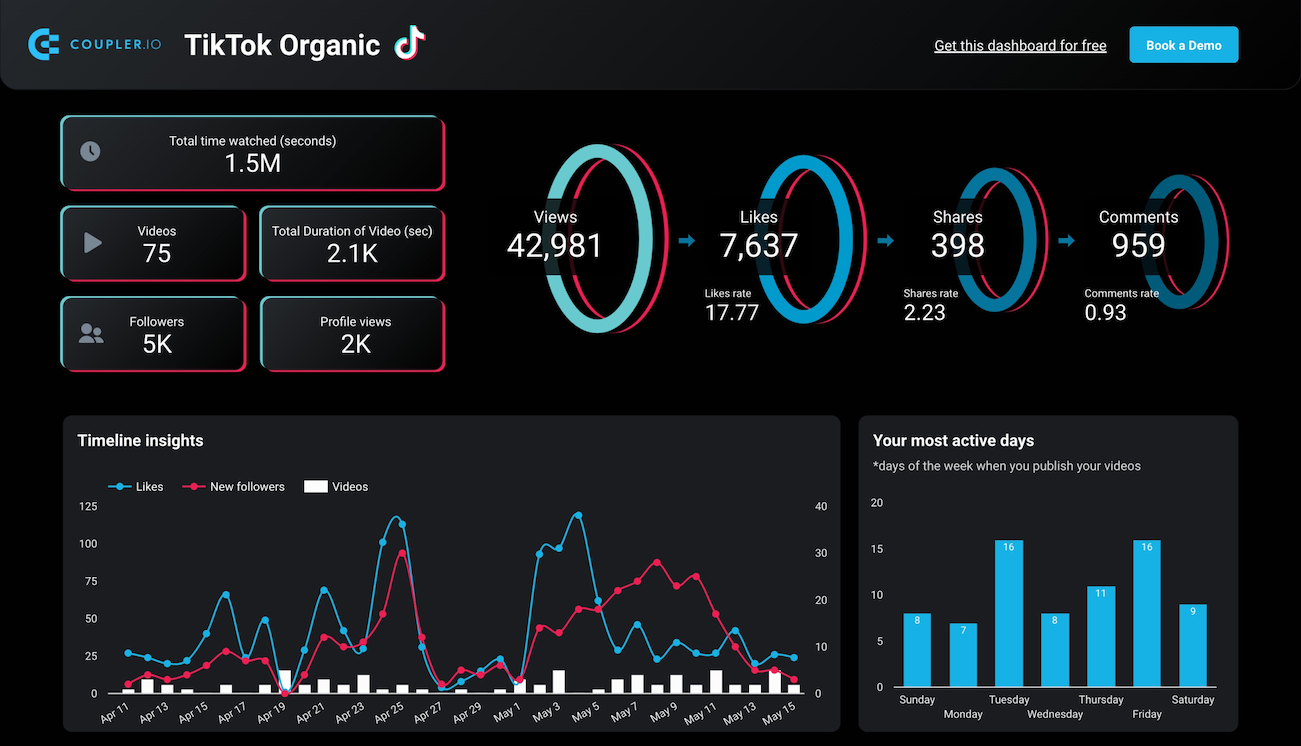
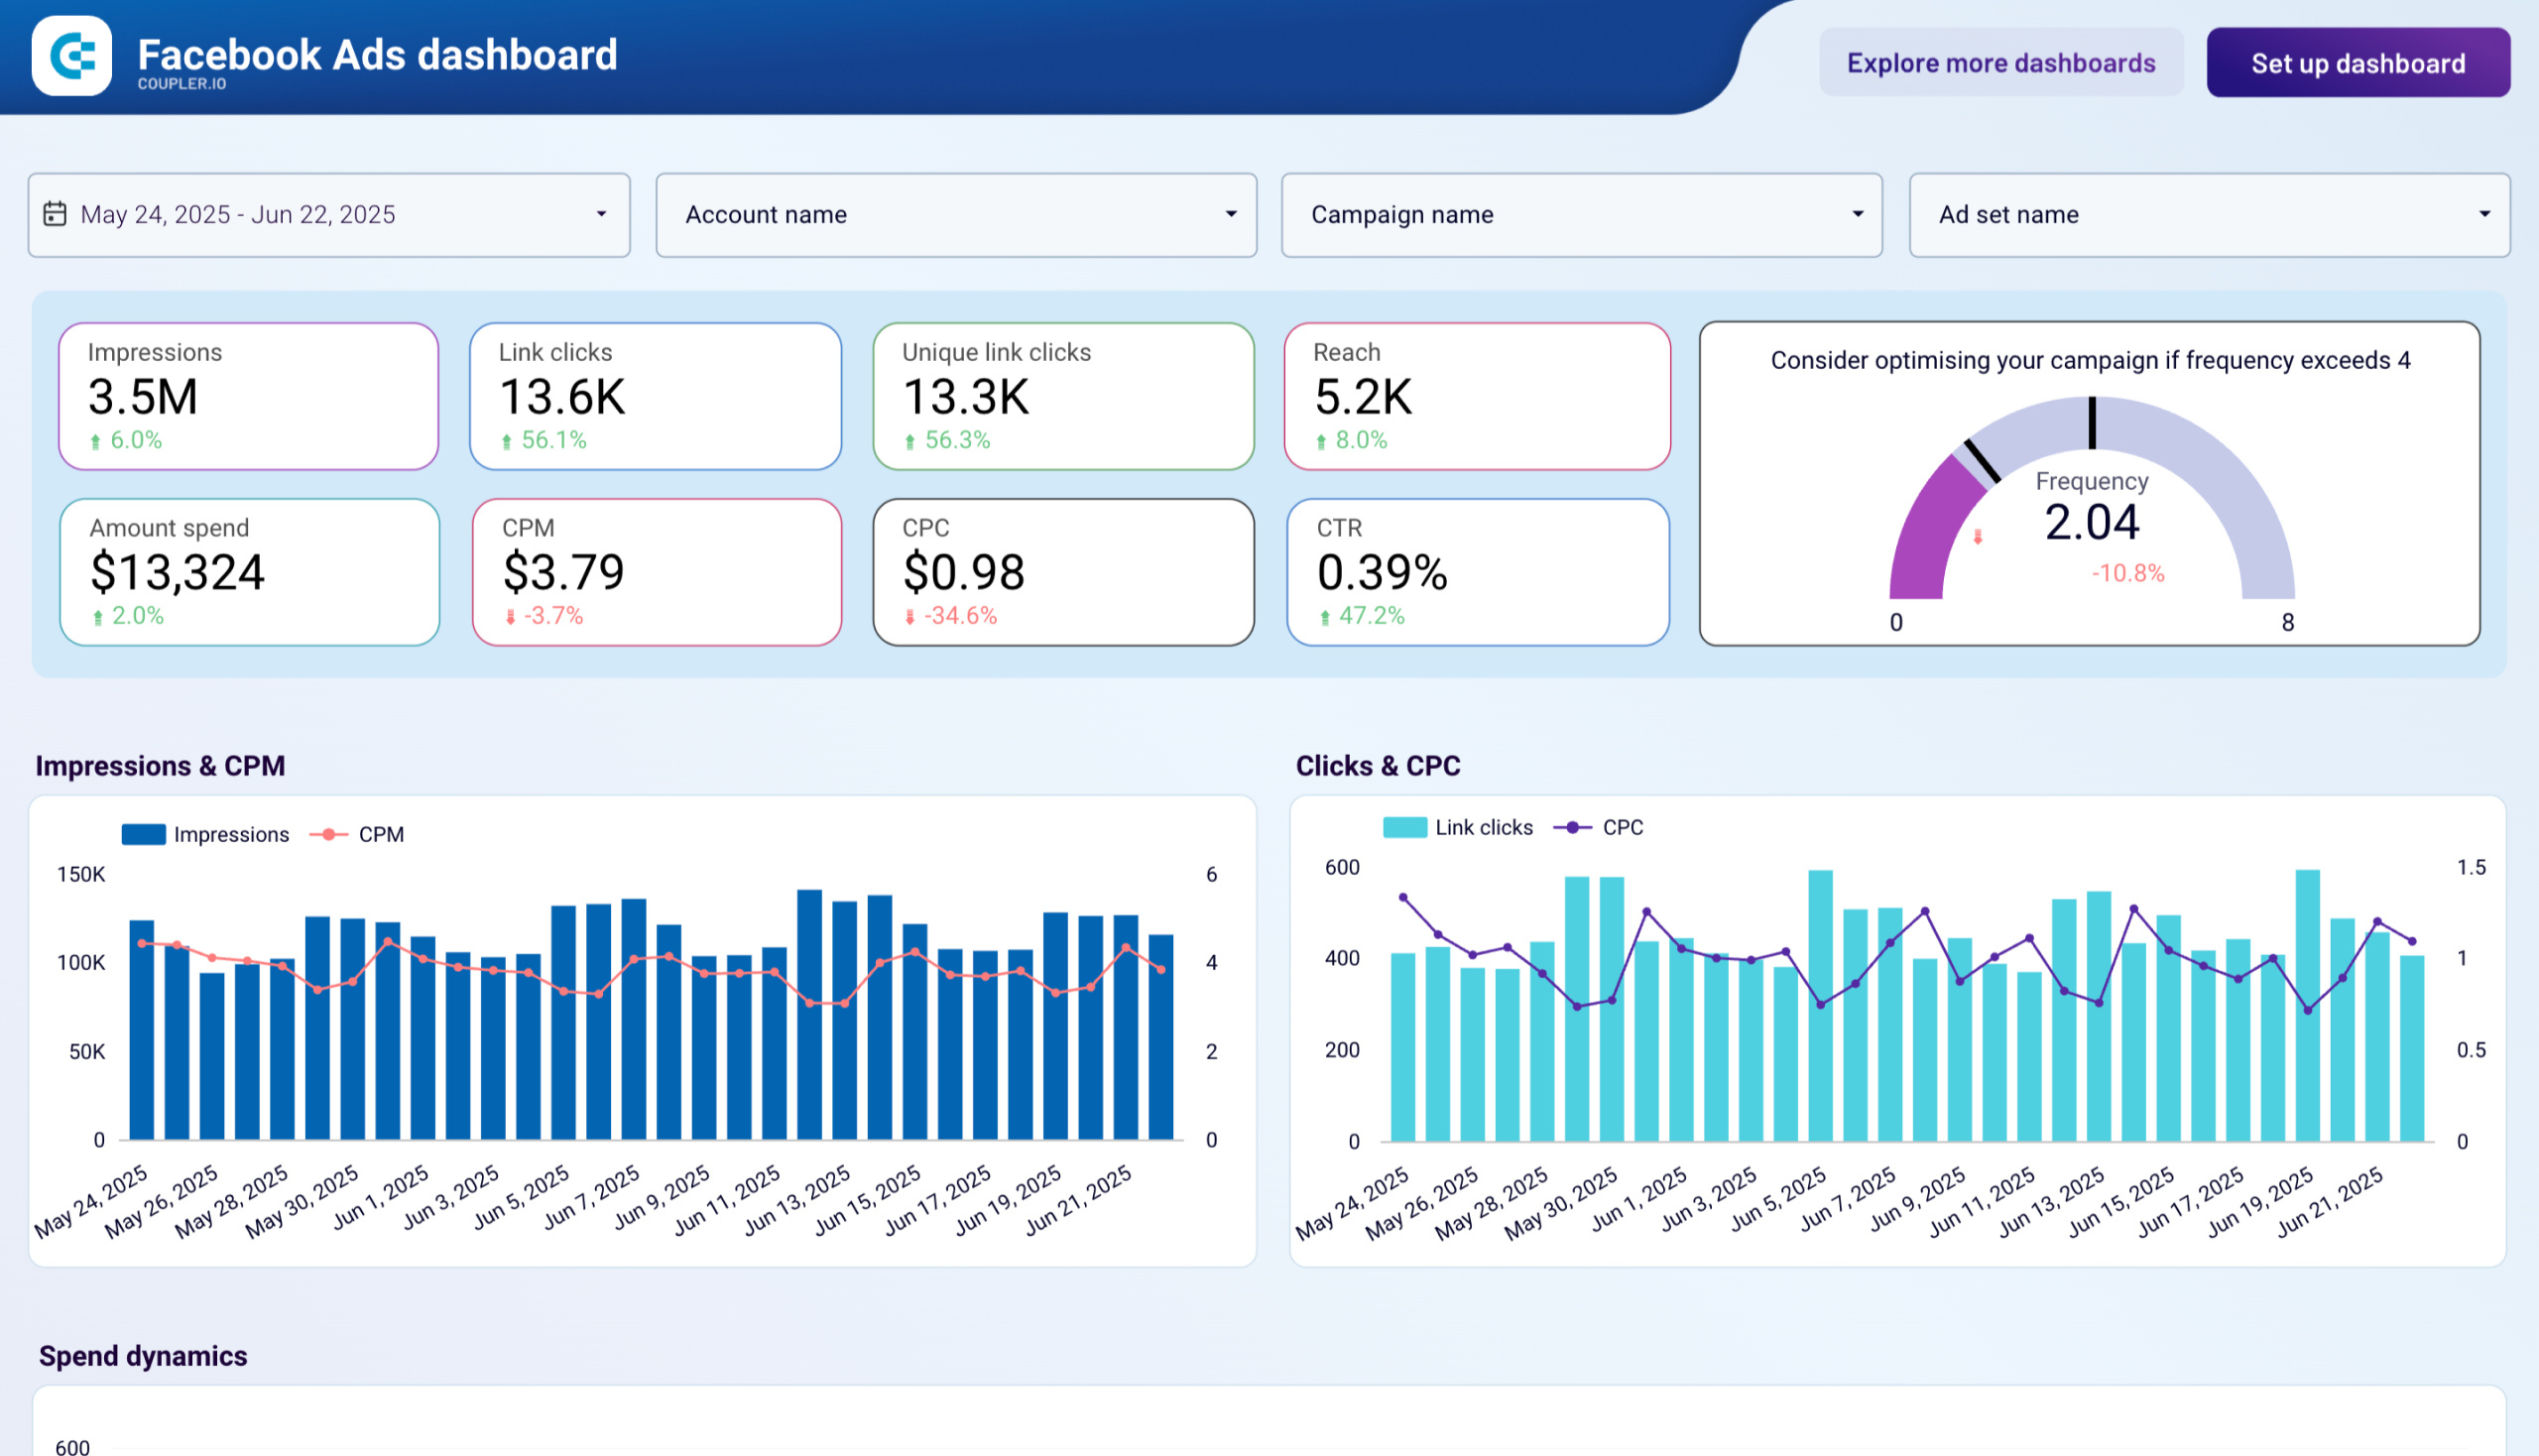
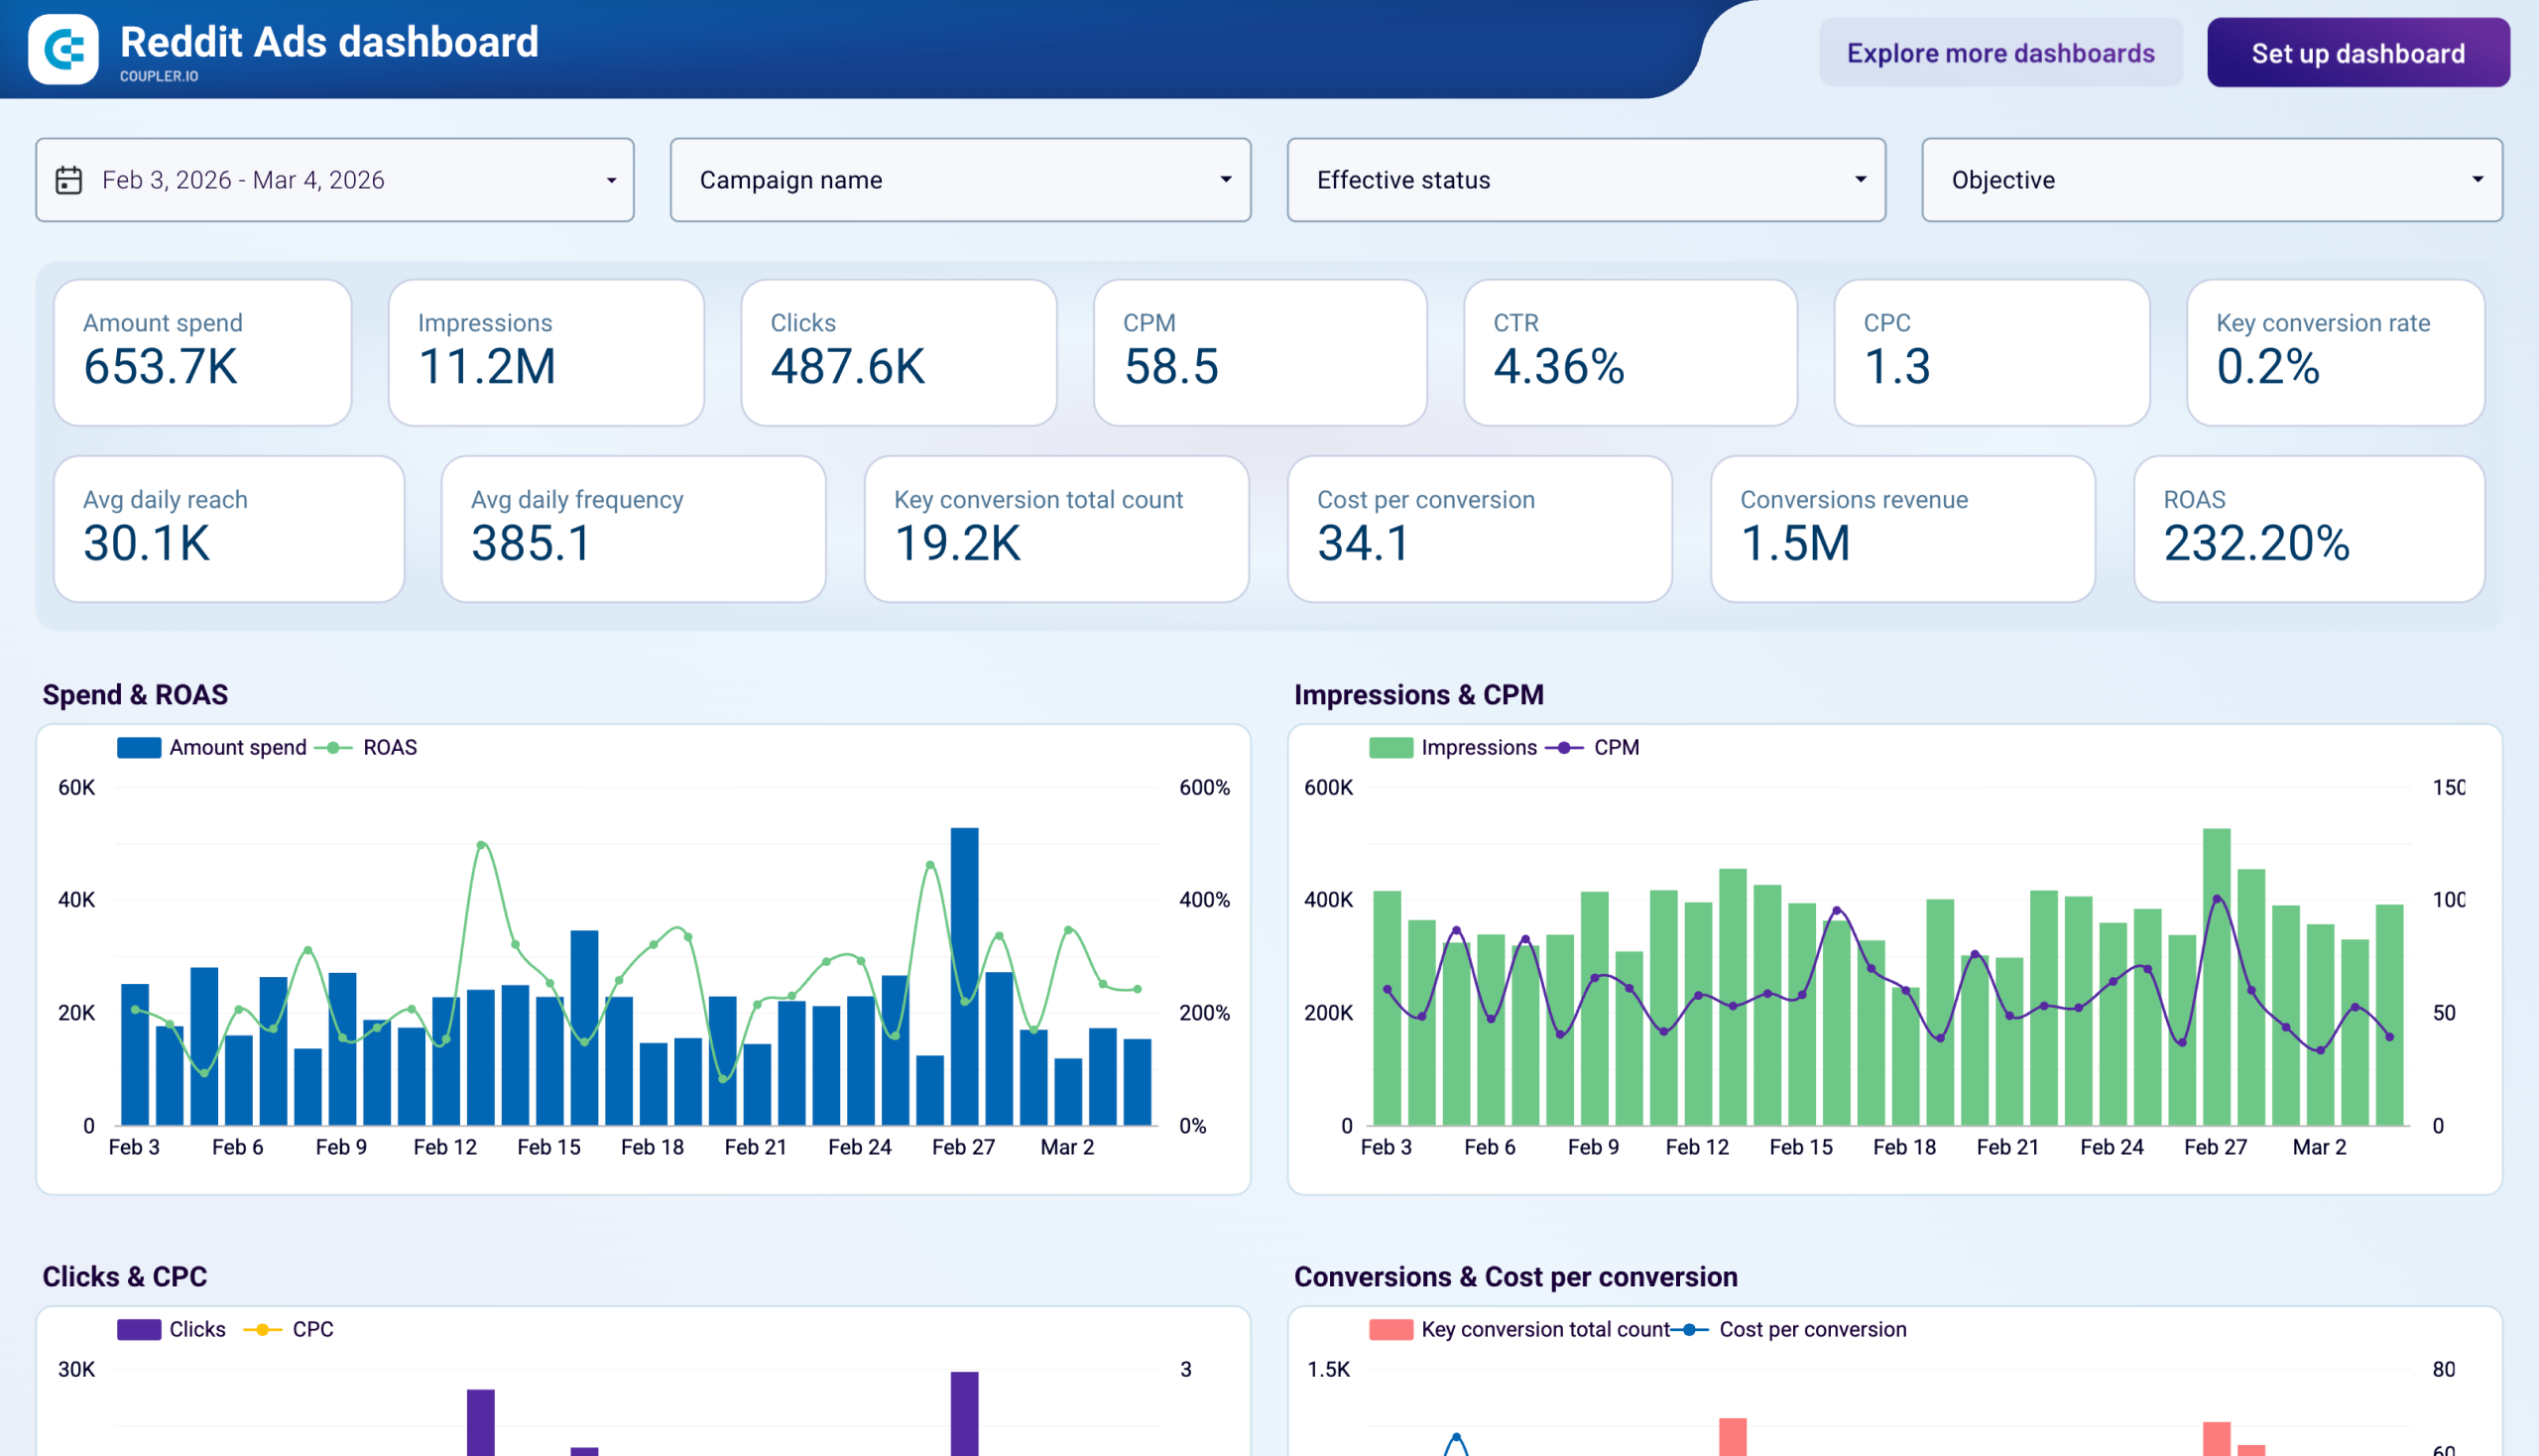
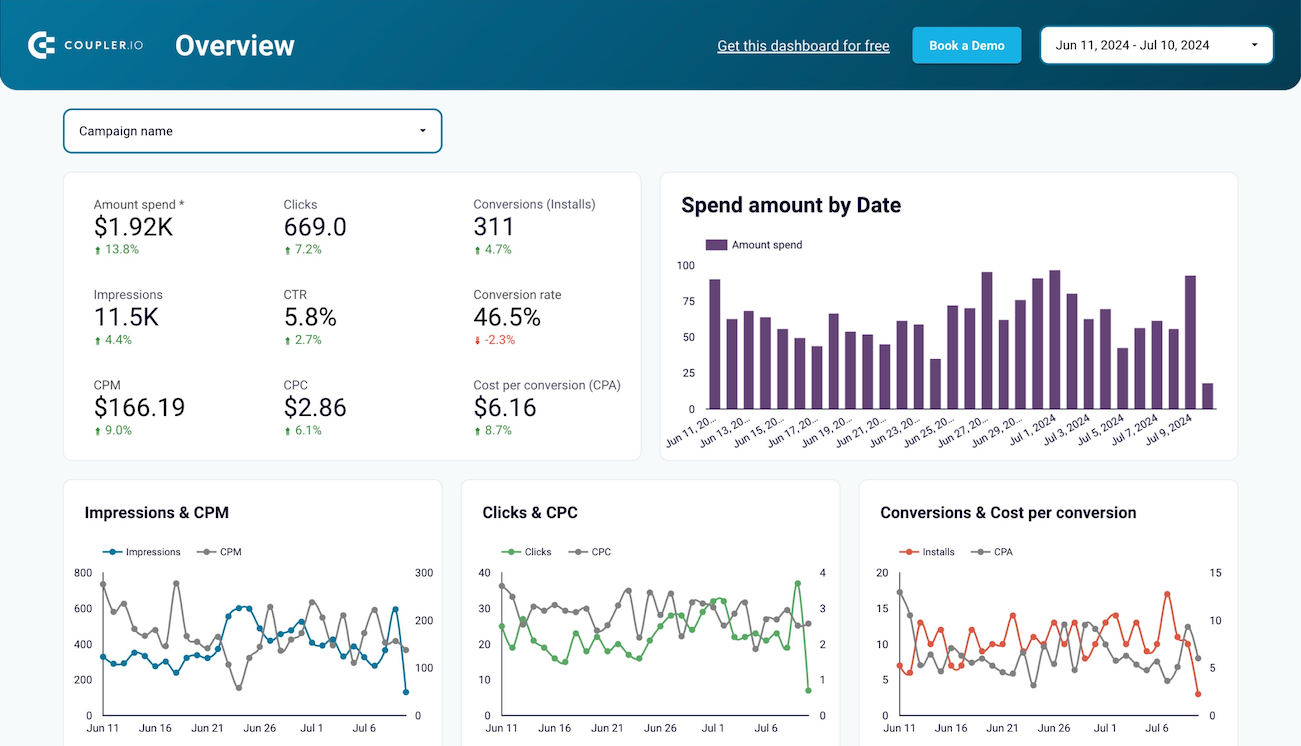
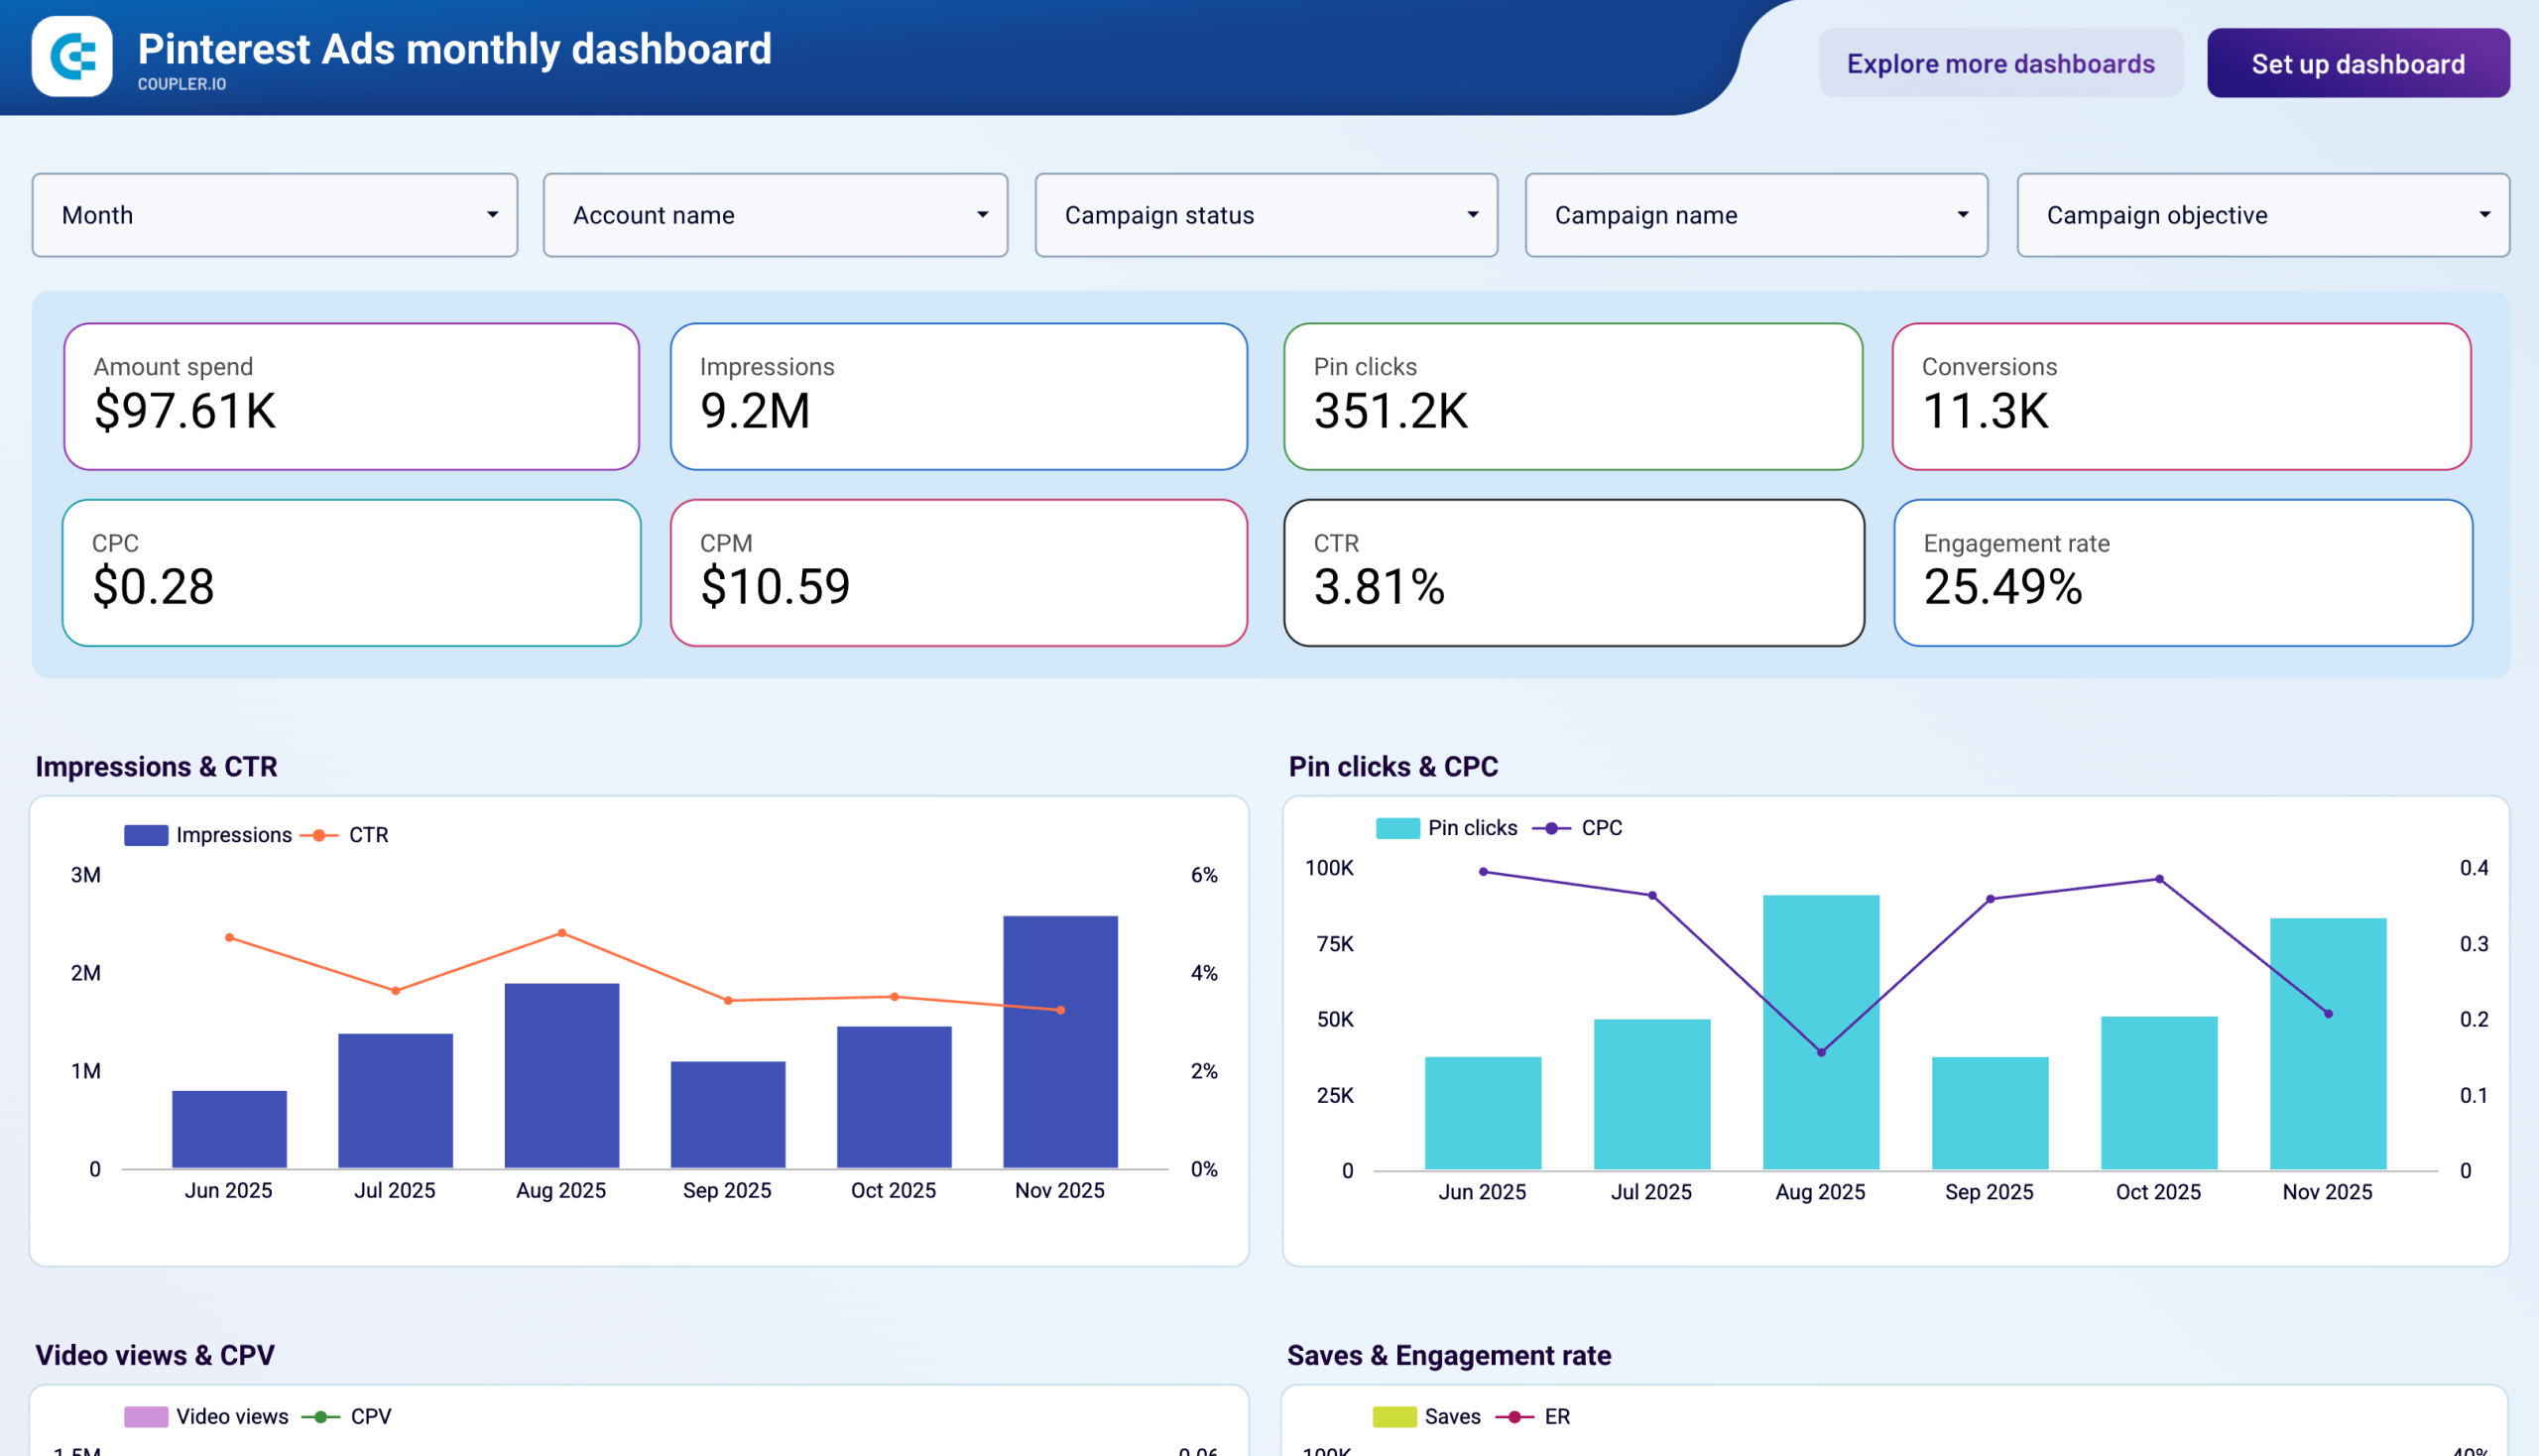
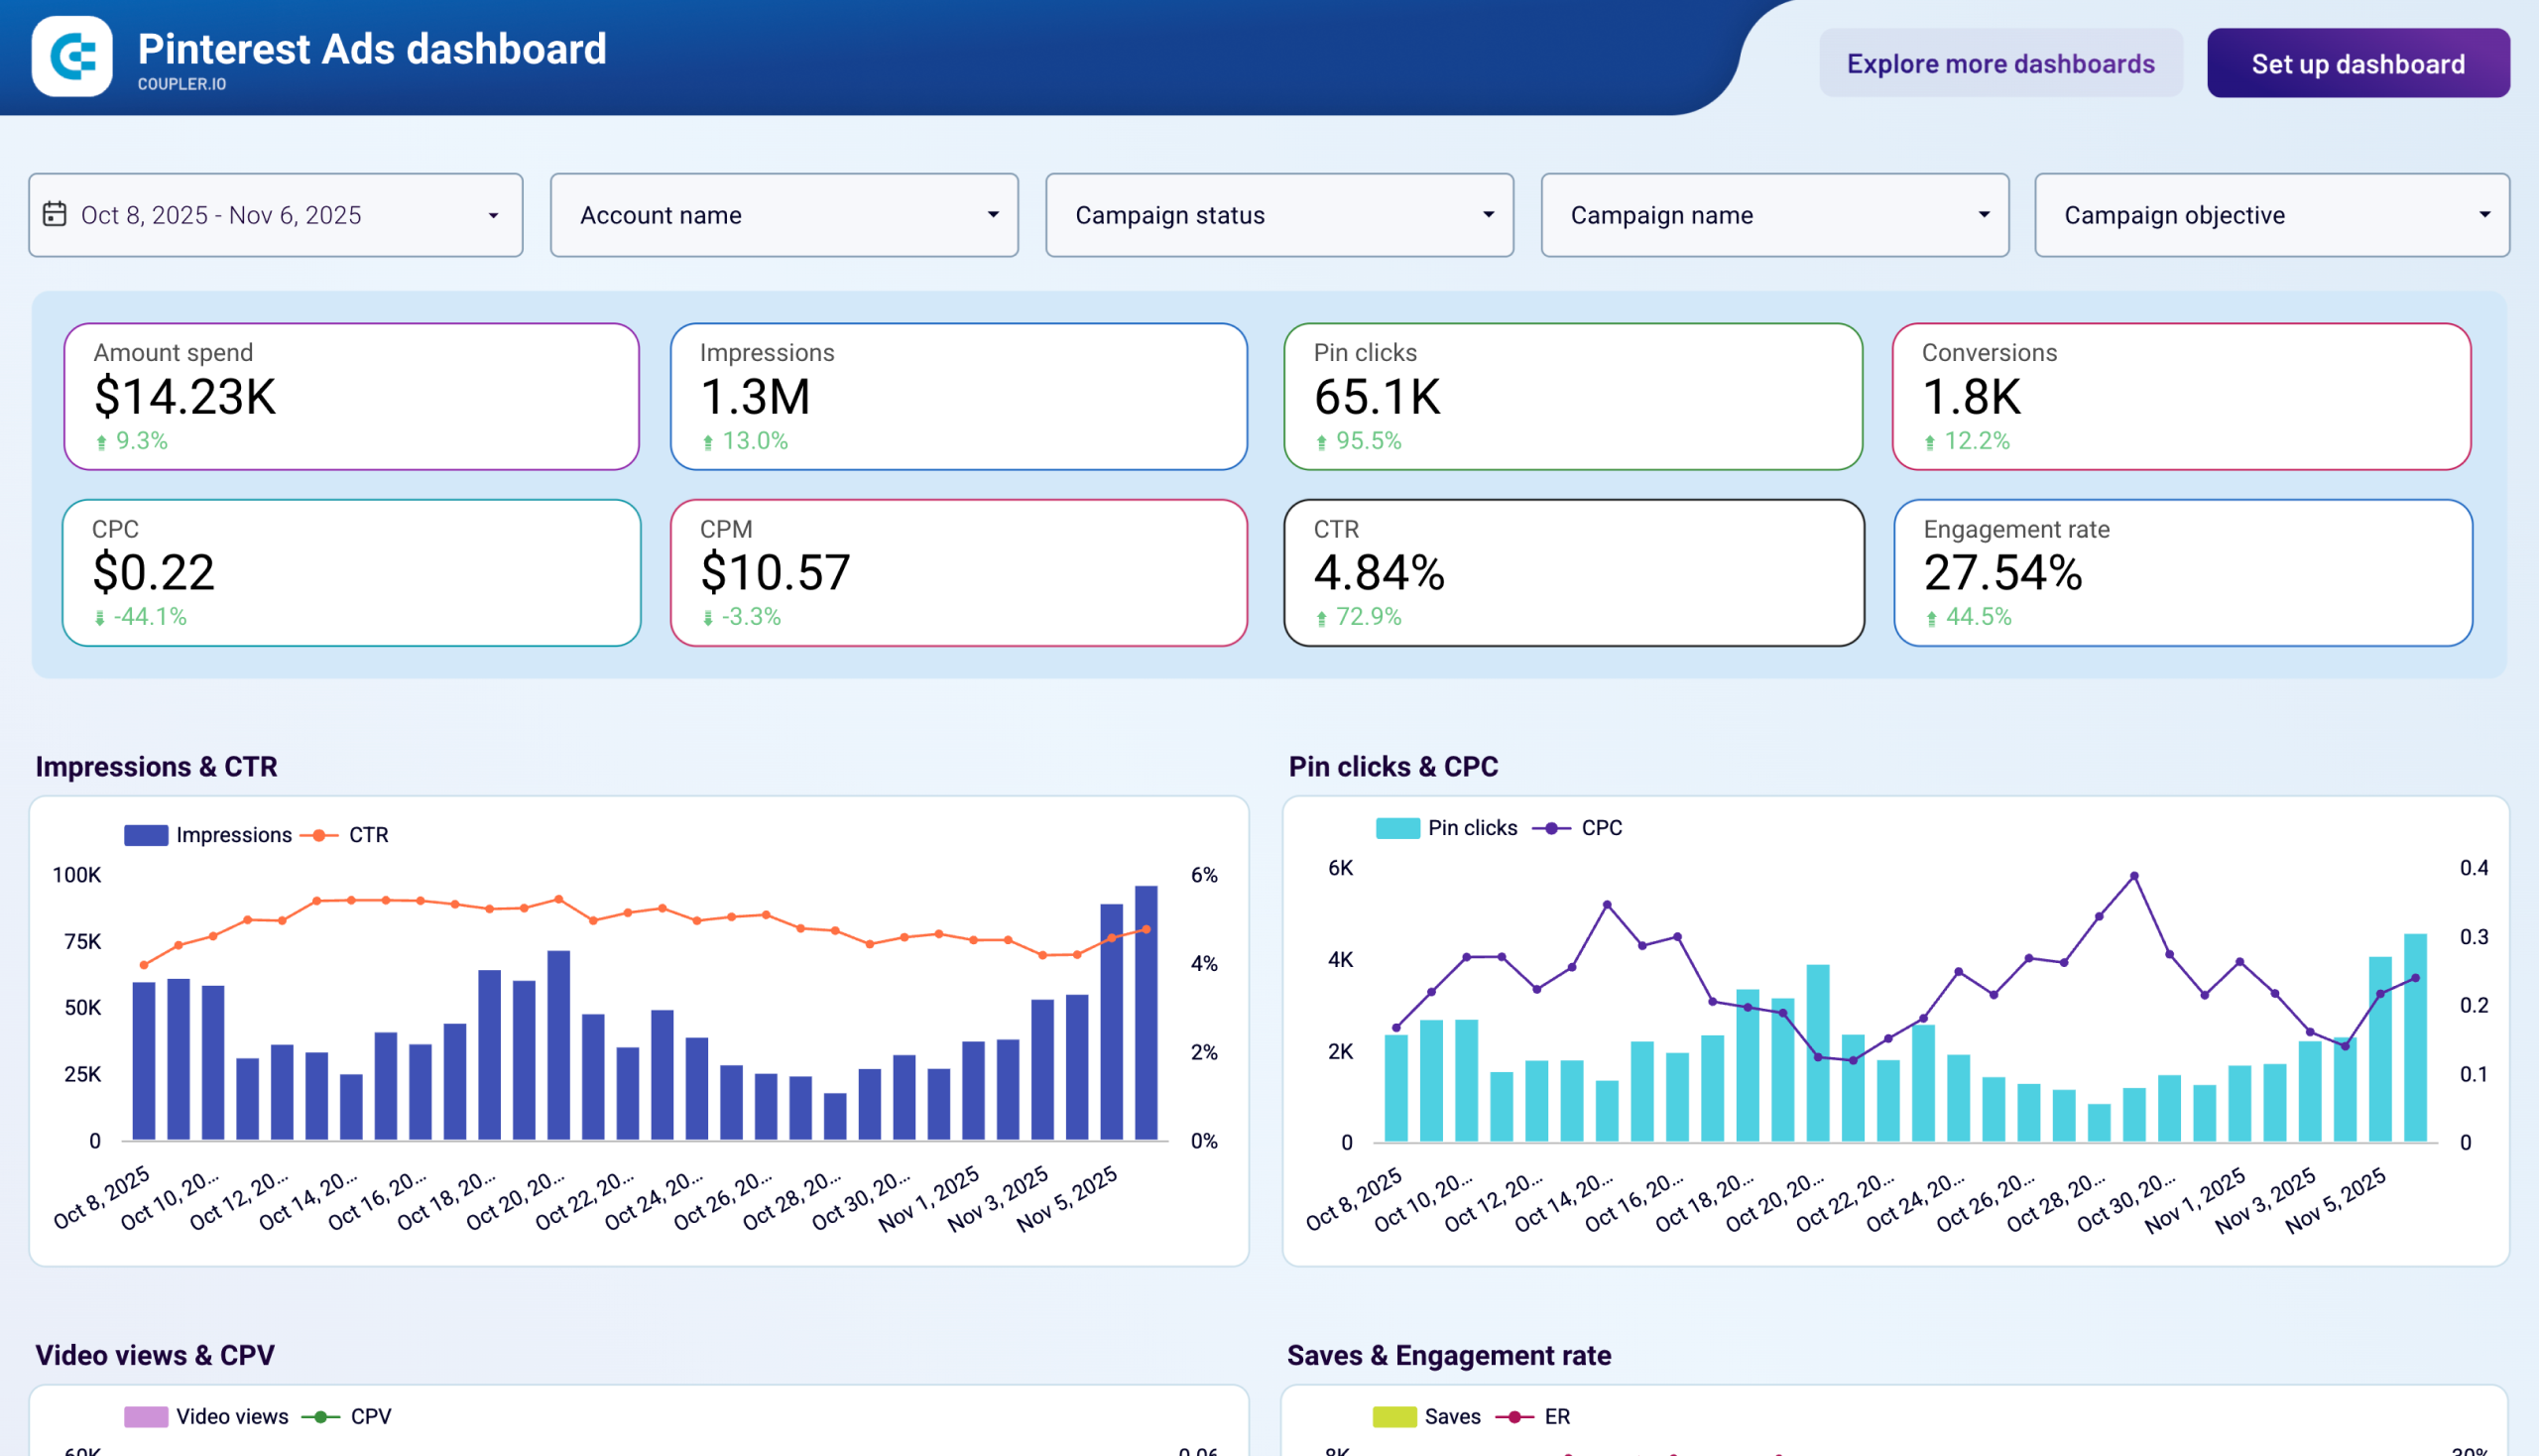
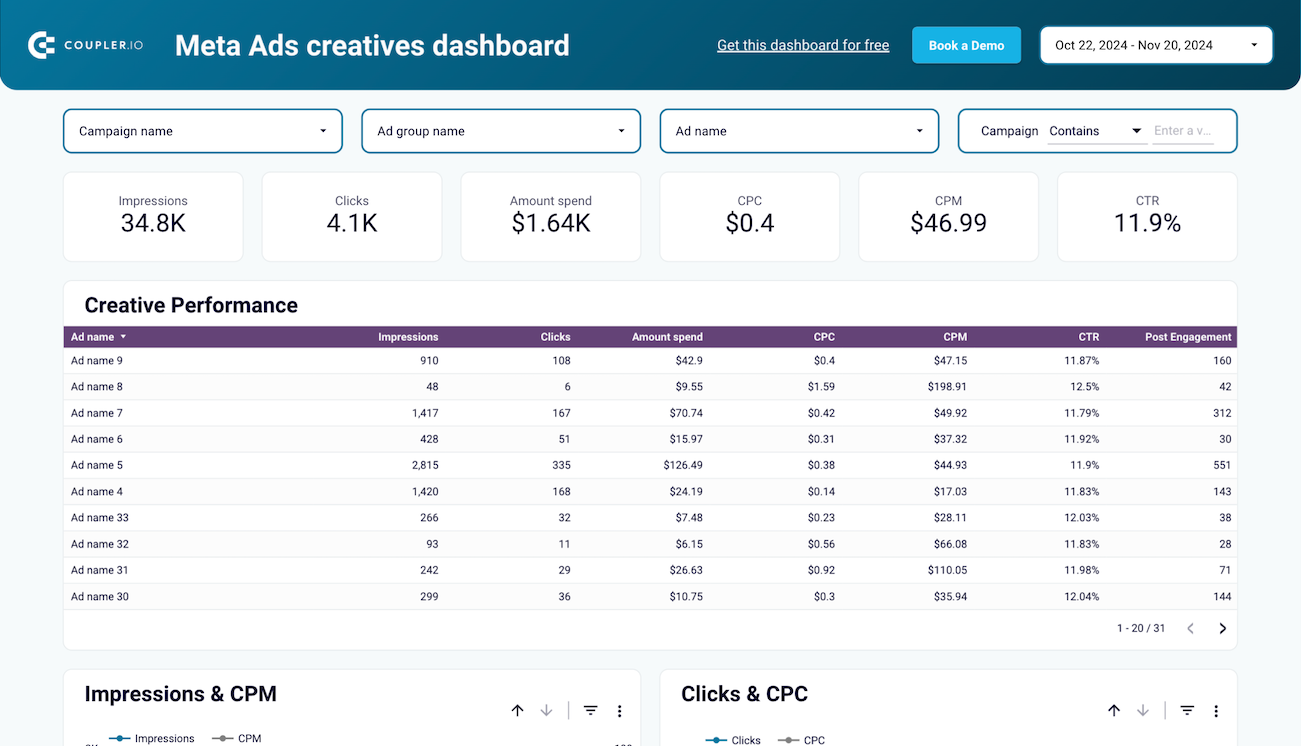
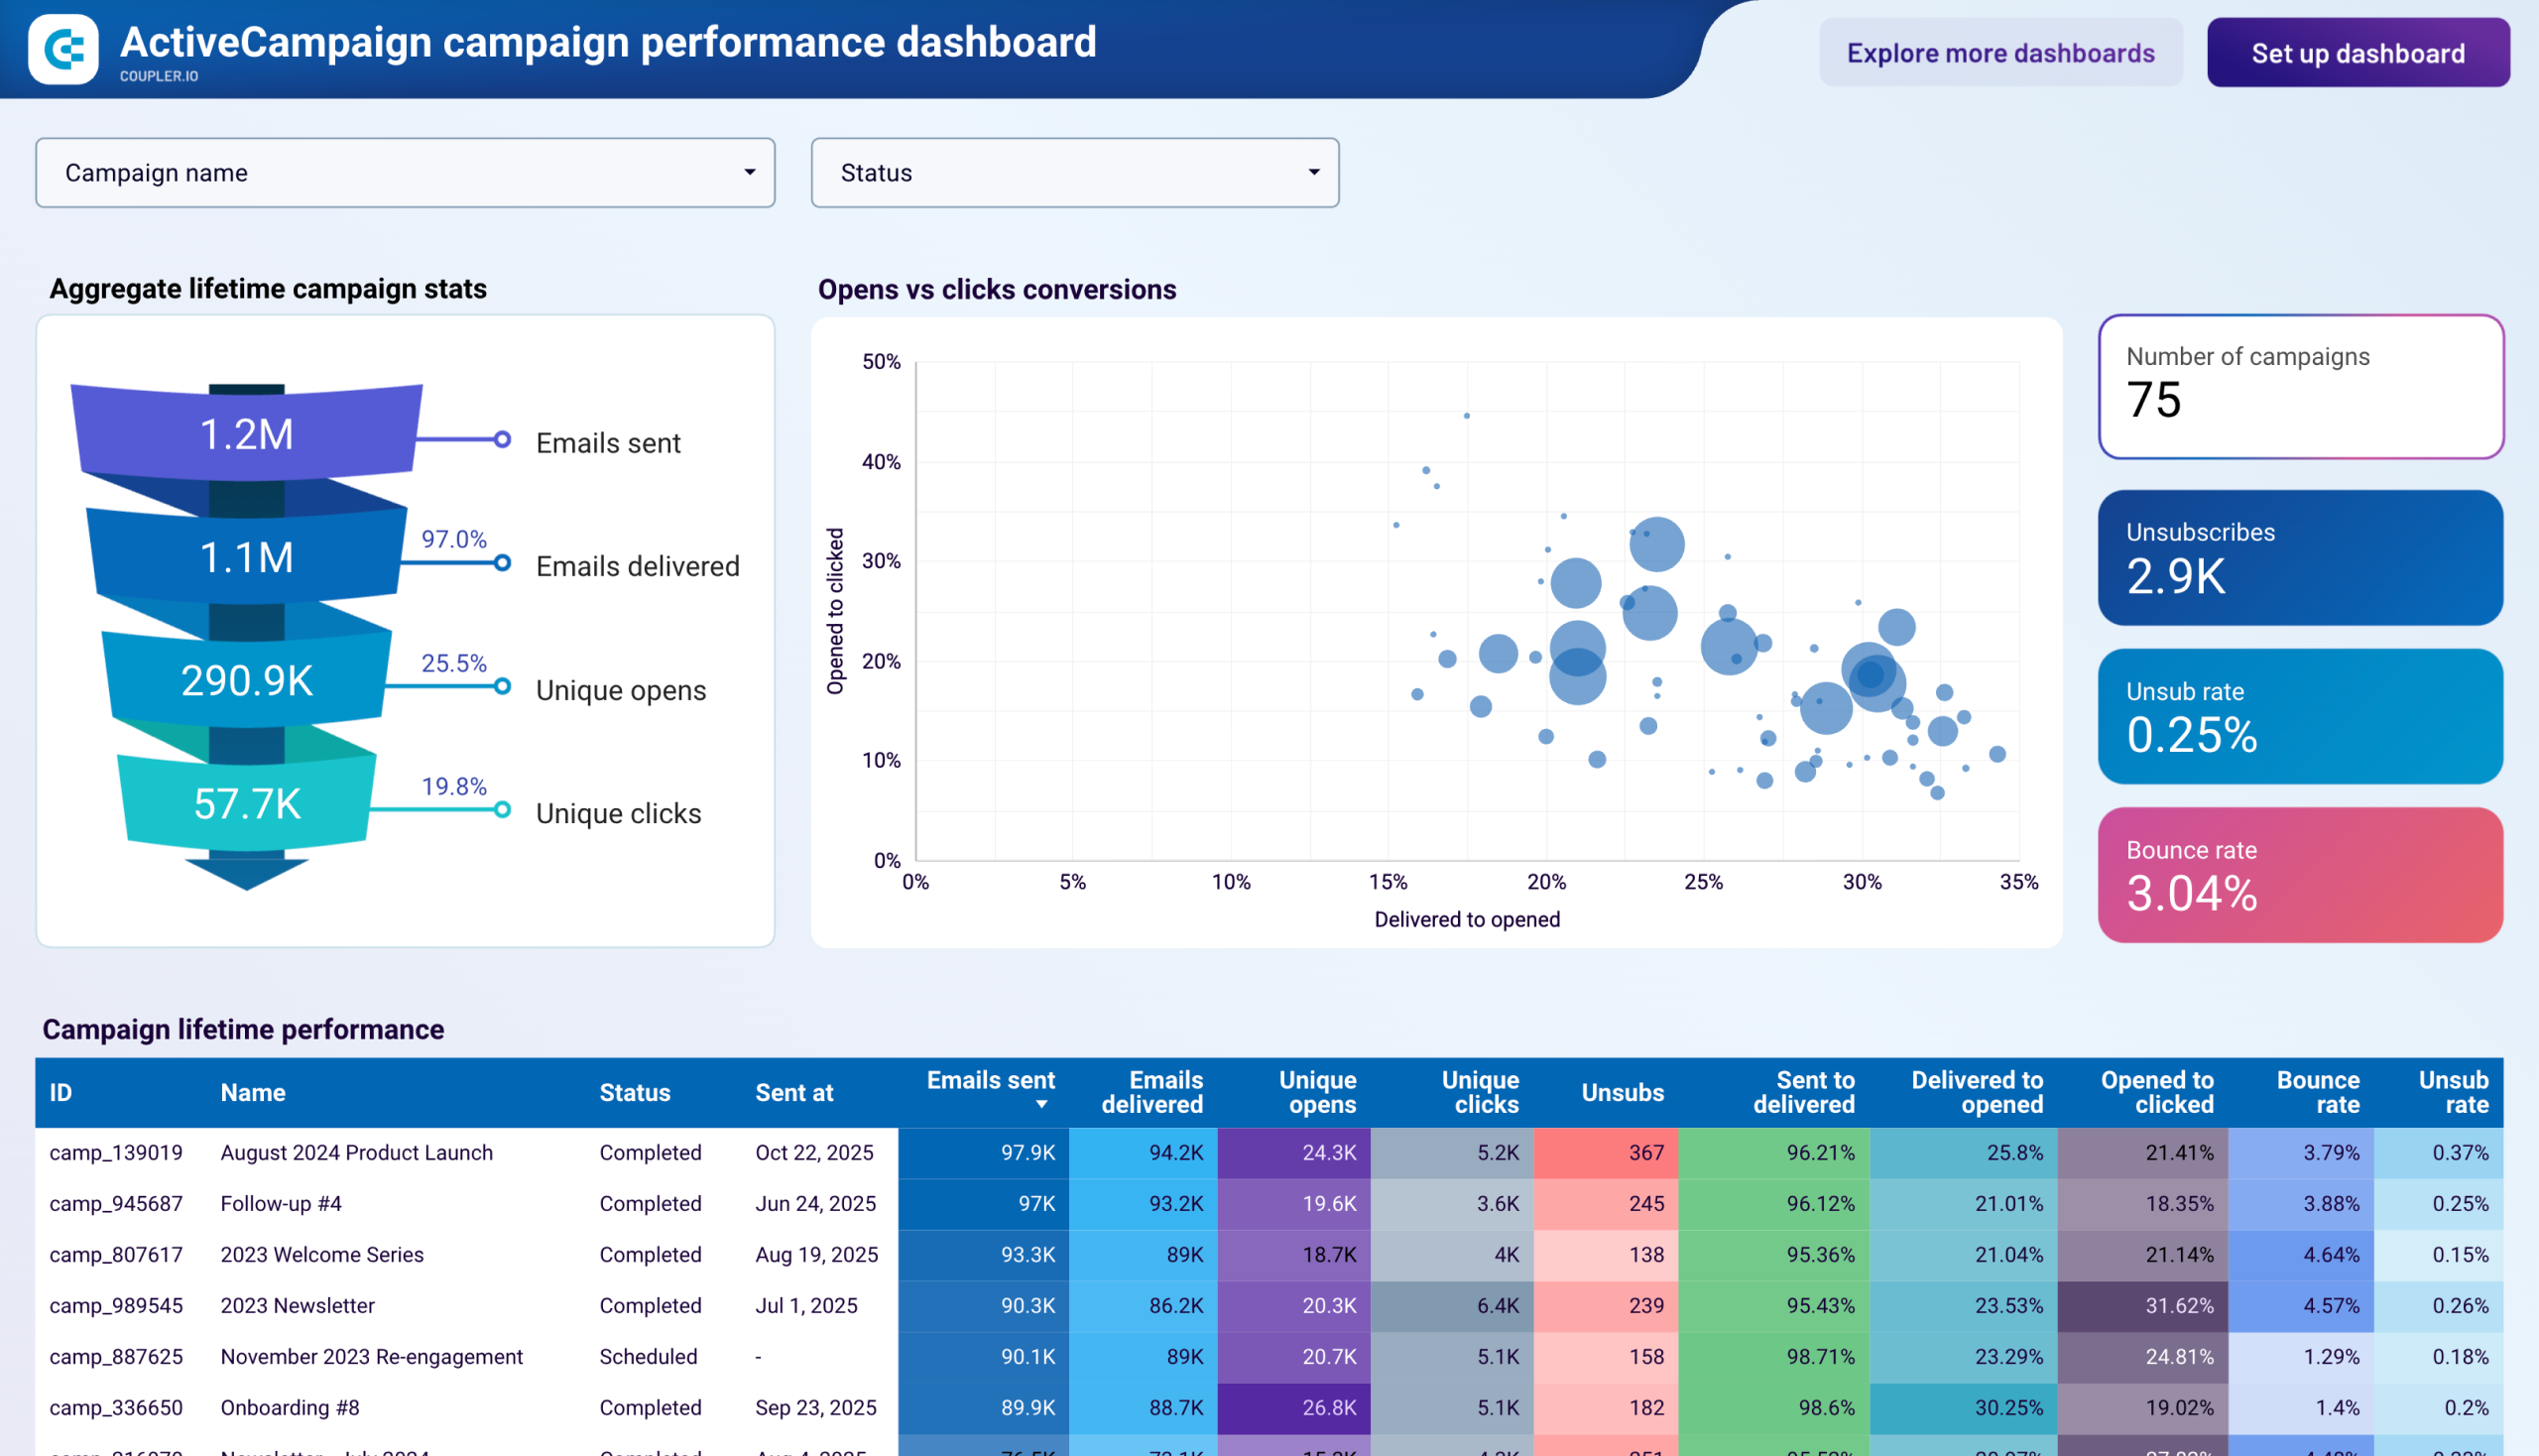
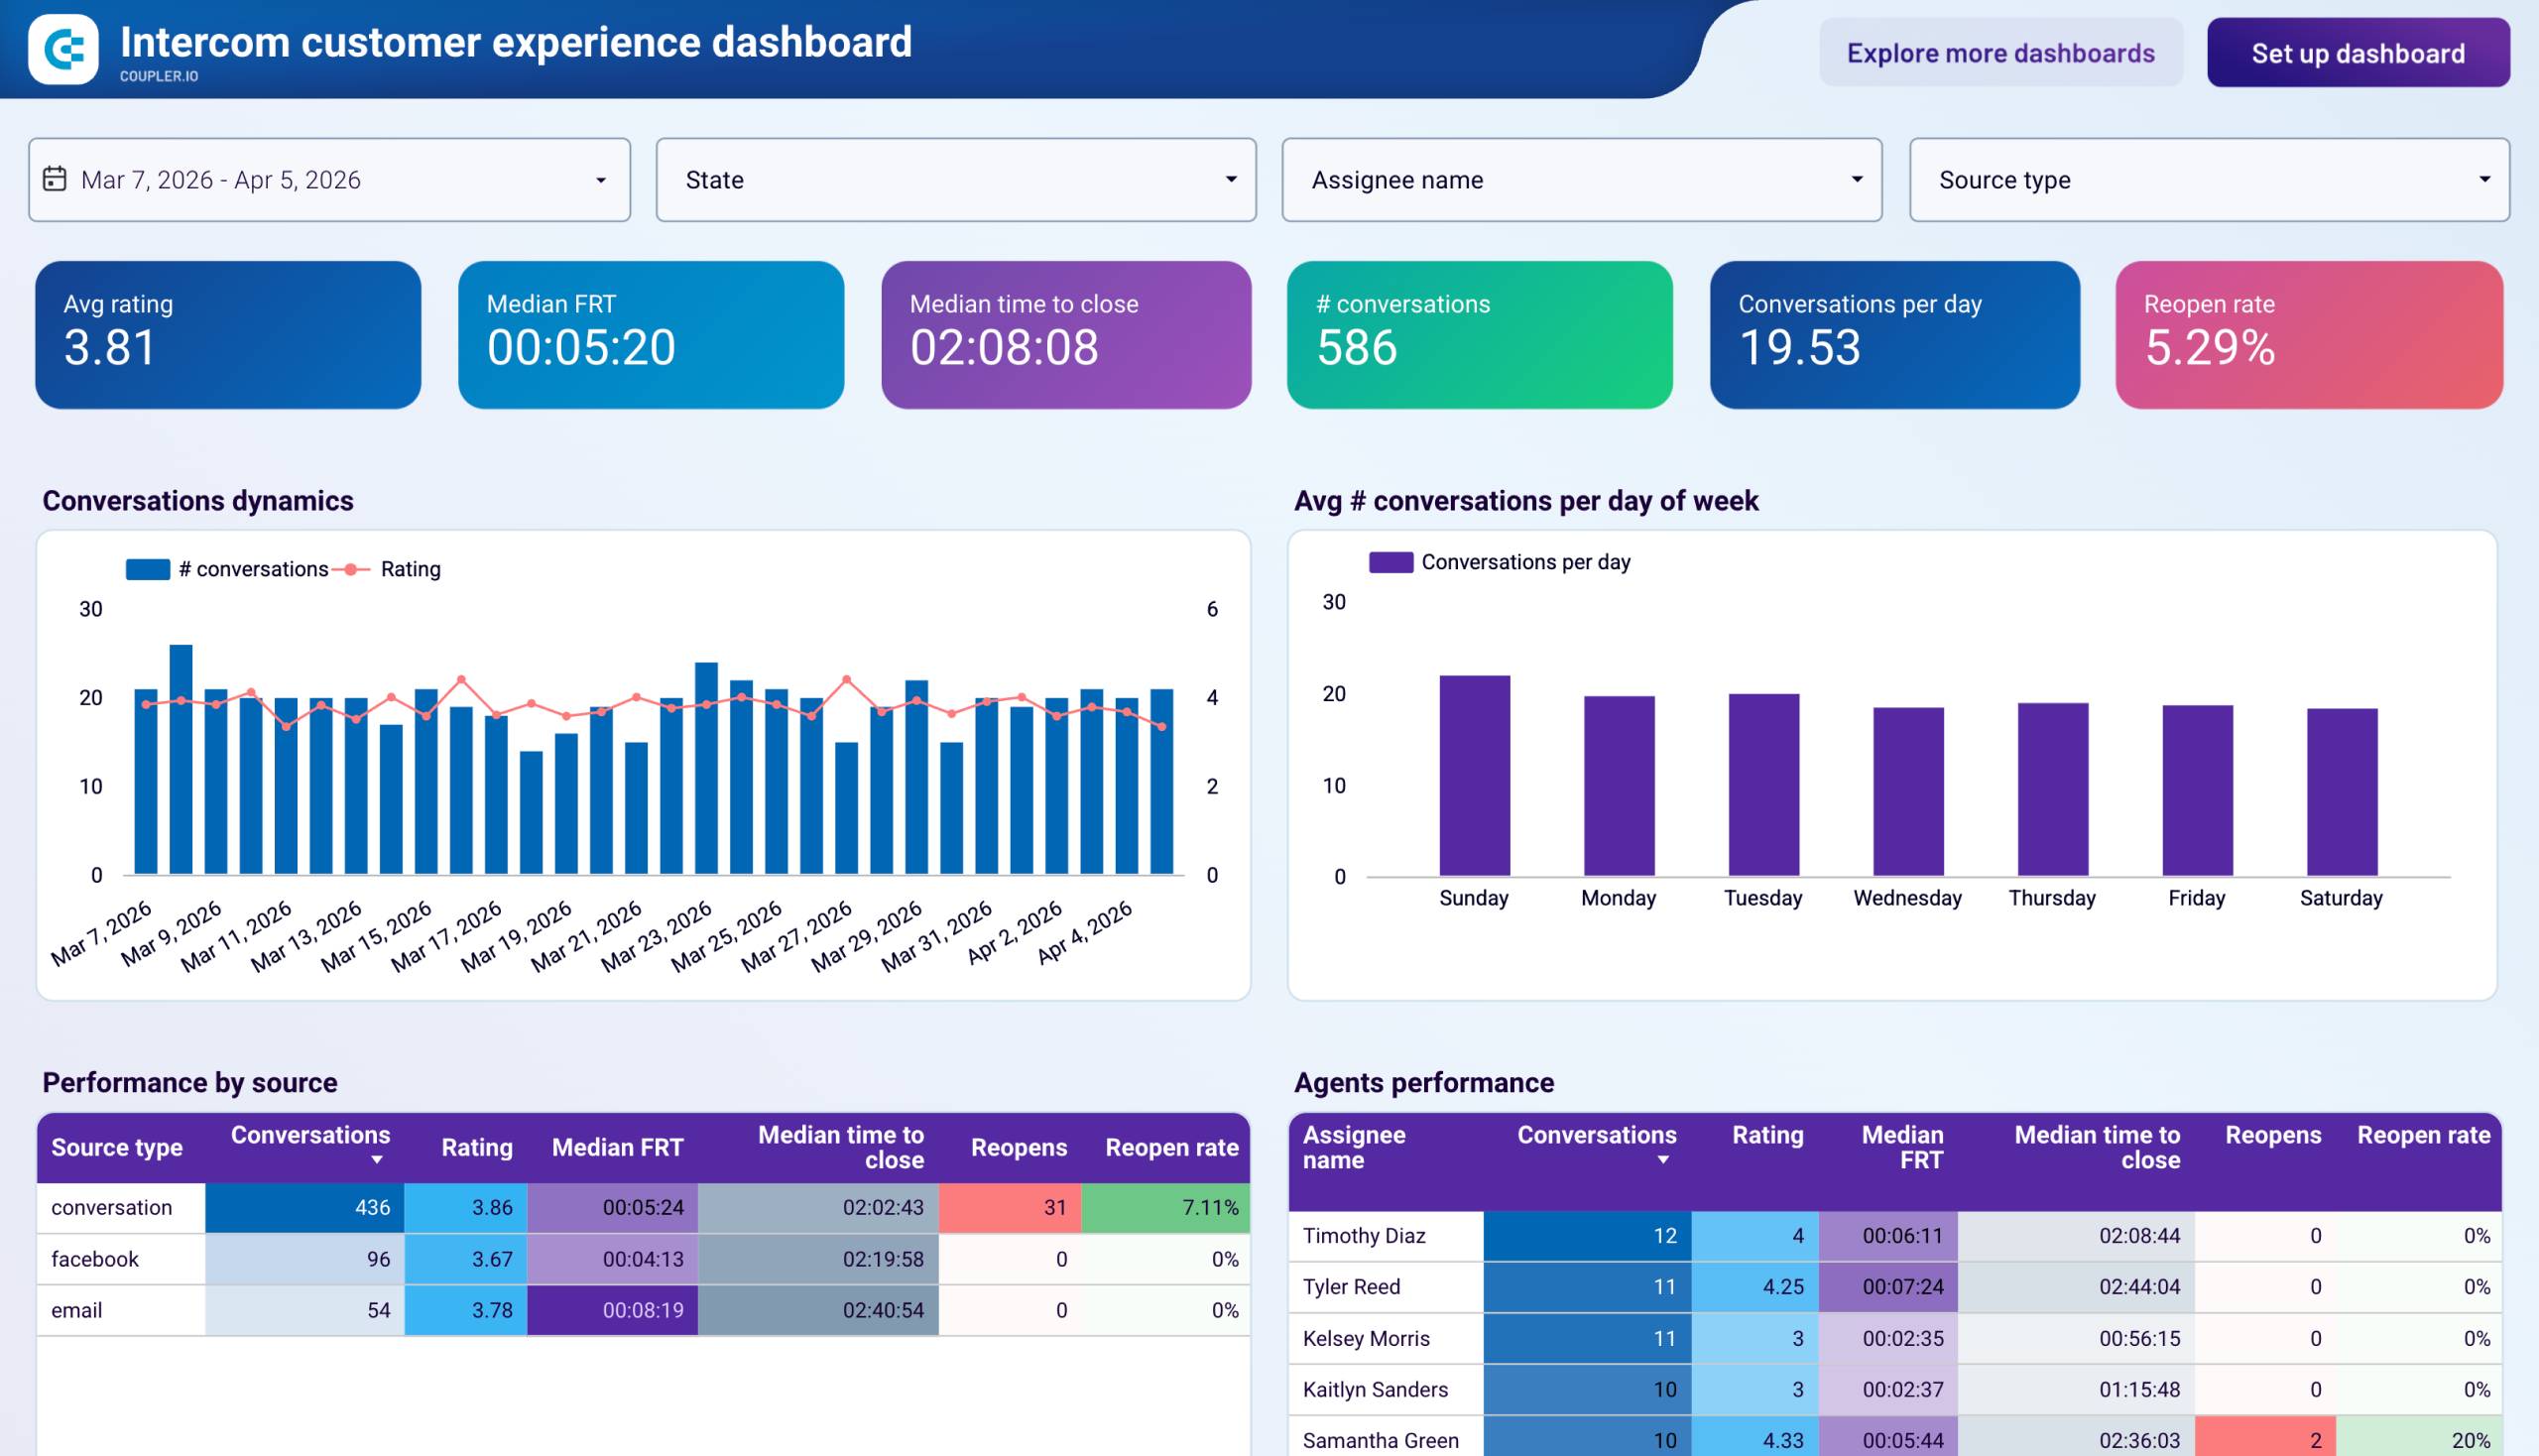
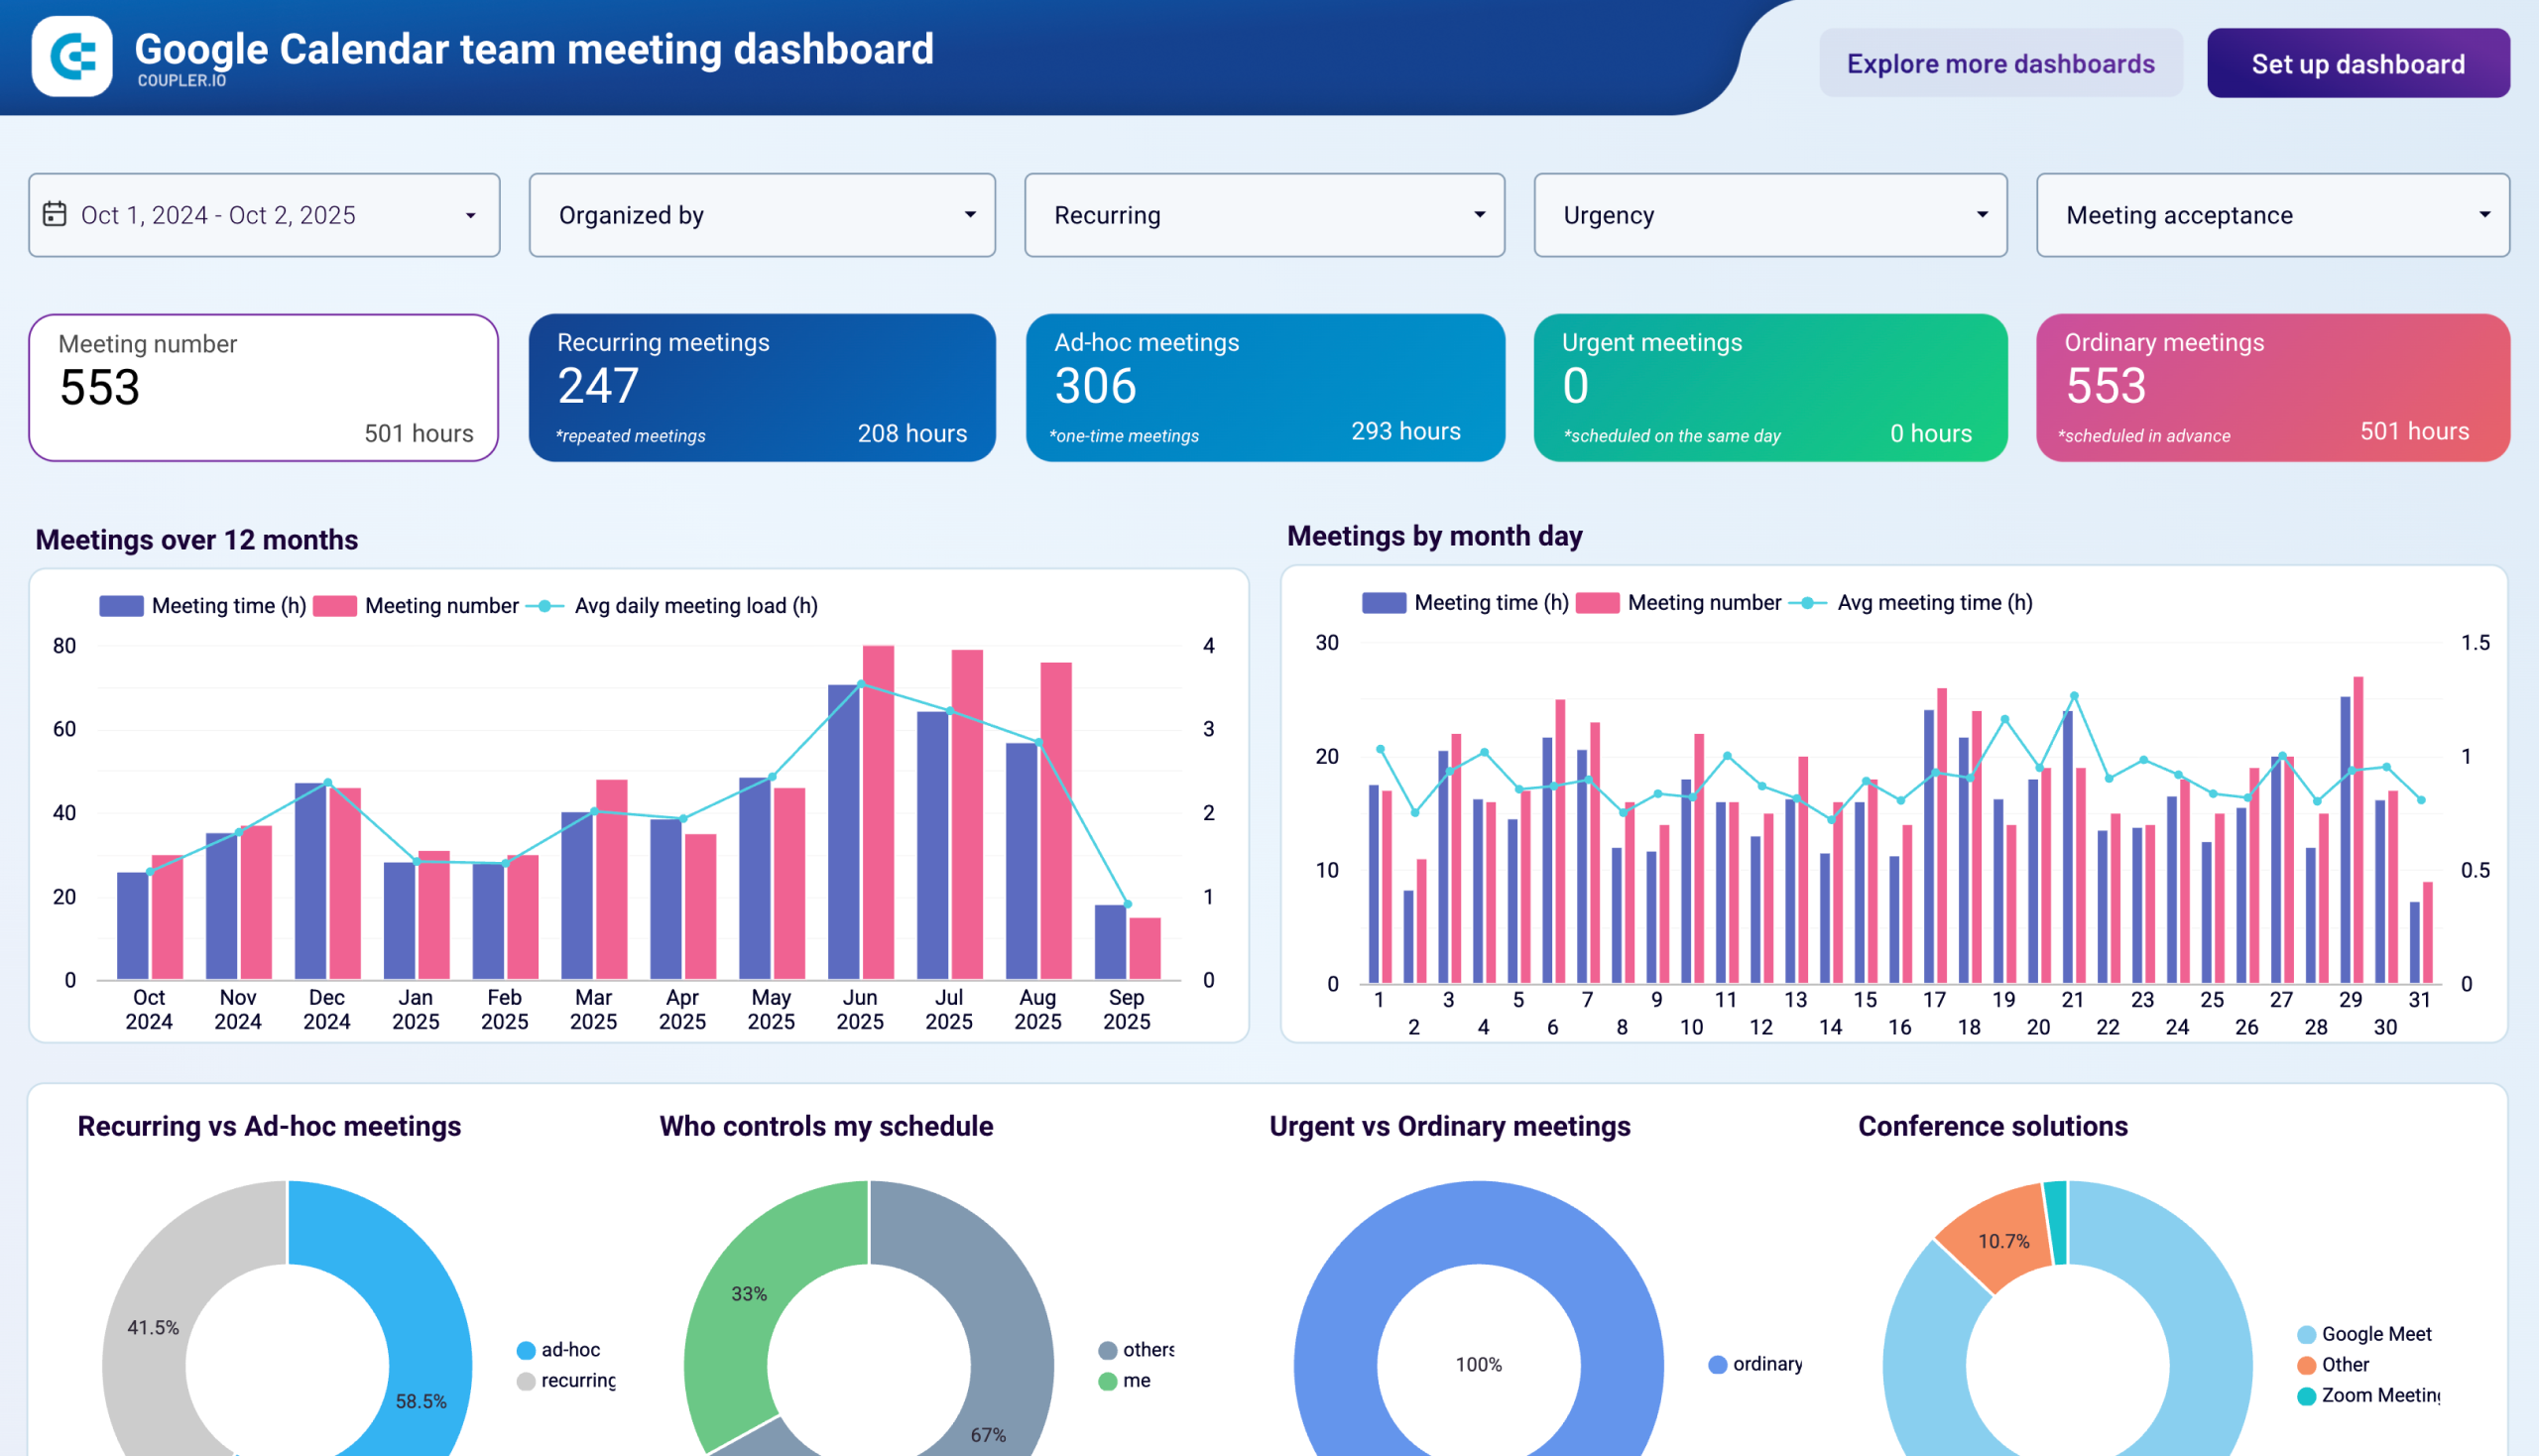
The ad performance comparison template displays campaign metrics from multiple platforms (e.g., Facebook Ads, TikTok Ads, LinkedIn Ads, Google Ads, etc.) side-by-side, with indicators showing performance direction compared to previous periods. Key metrics appear in separate blocks for each platform. It’s straightforward to assess which channel currently delivers stronger results for your investment. Performance dynamics charts track advertising expenses, impressions, clicks, and cost per click by day, which reveals correlations between costs and campaign outcomes. Detailed campaign comparison tables can be filtered to isolate specific initiatives and evaluate individual campaign performance across both platforms. This visibility supports informed decisions about where to concentrate advertising budget based on actual return on investment data rather than assumptions about platform effectiveness.

Keep financial health under control across key dimensions
looker-studio-templates-2.png
Find this insight in the QuickBooks Revenue Dashboard template.

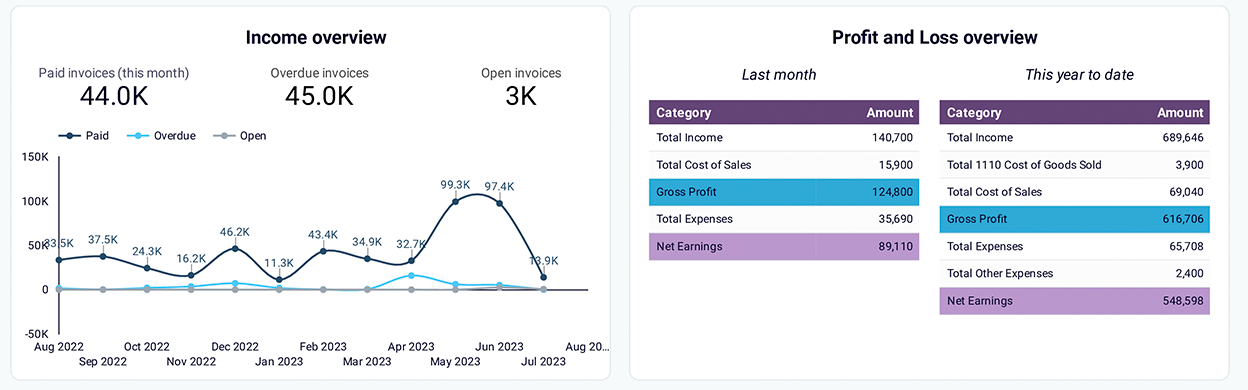
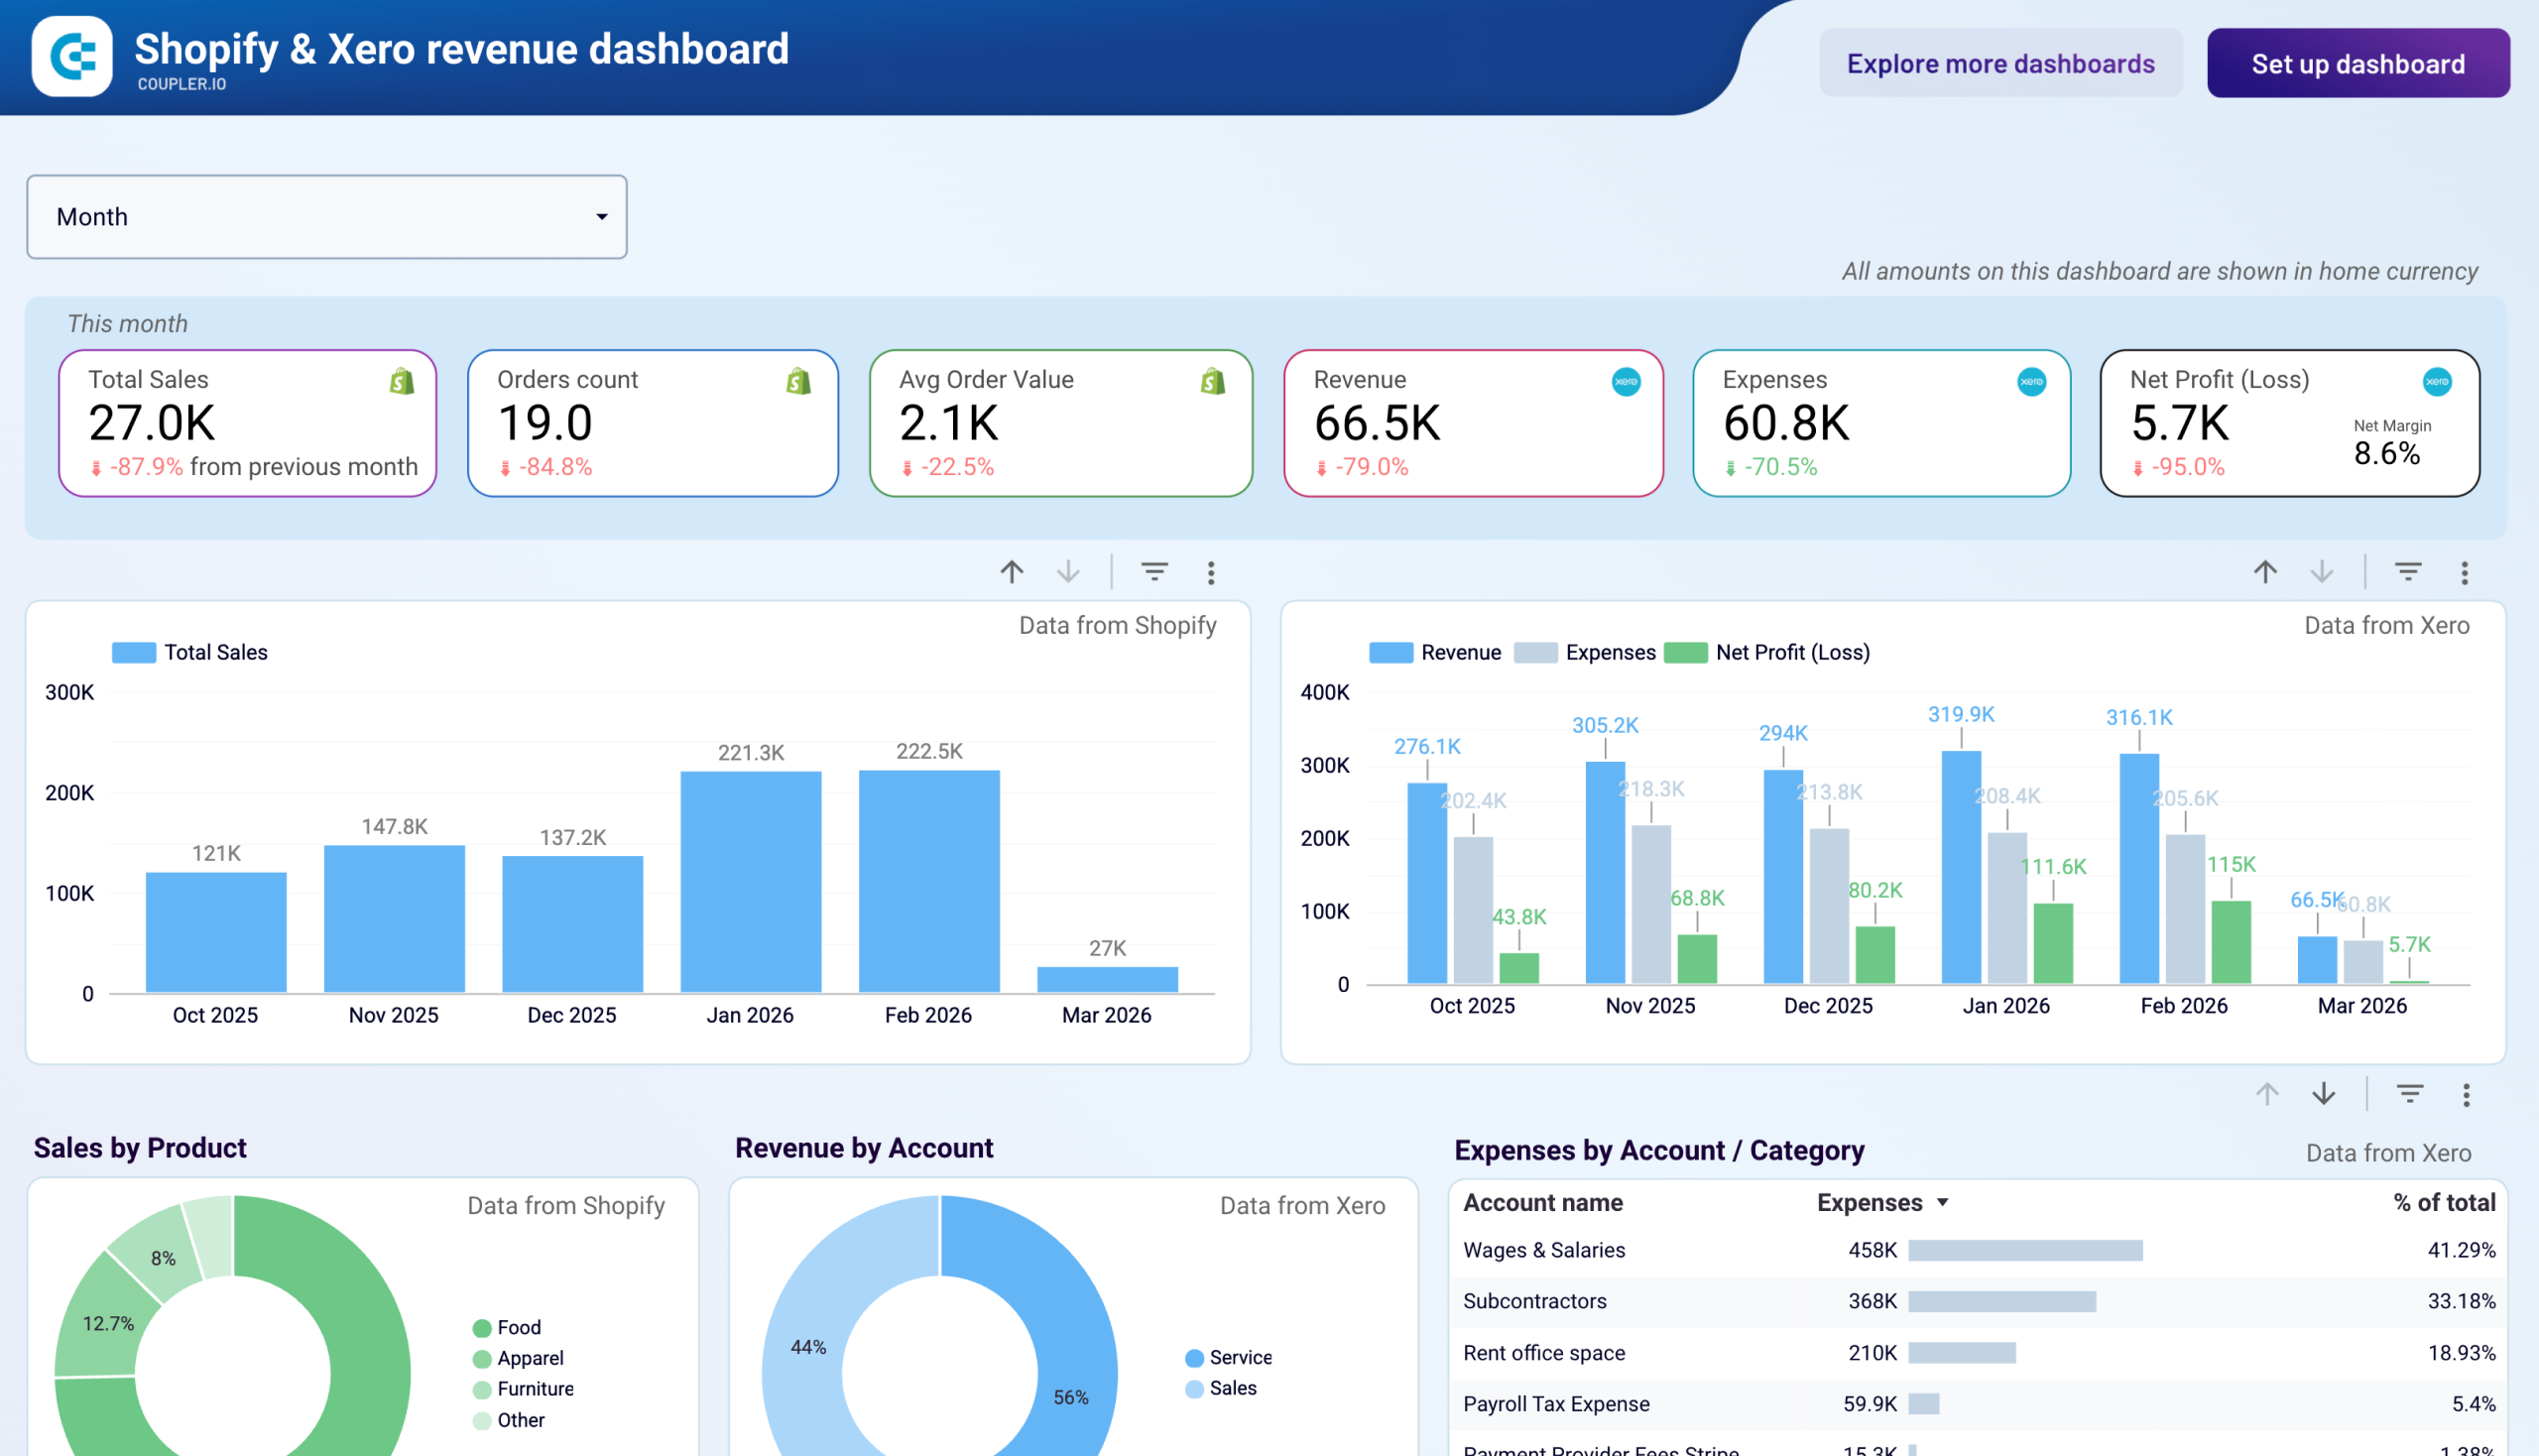
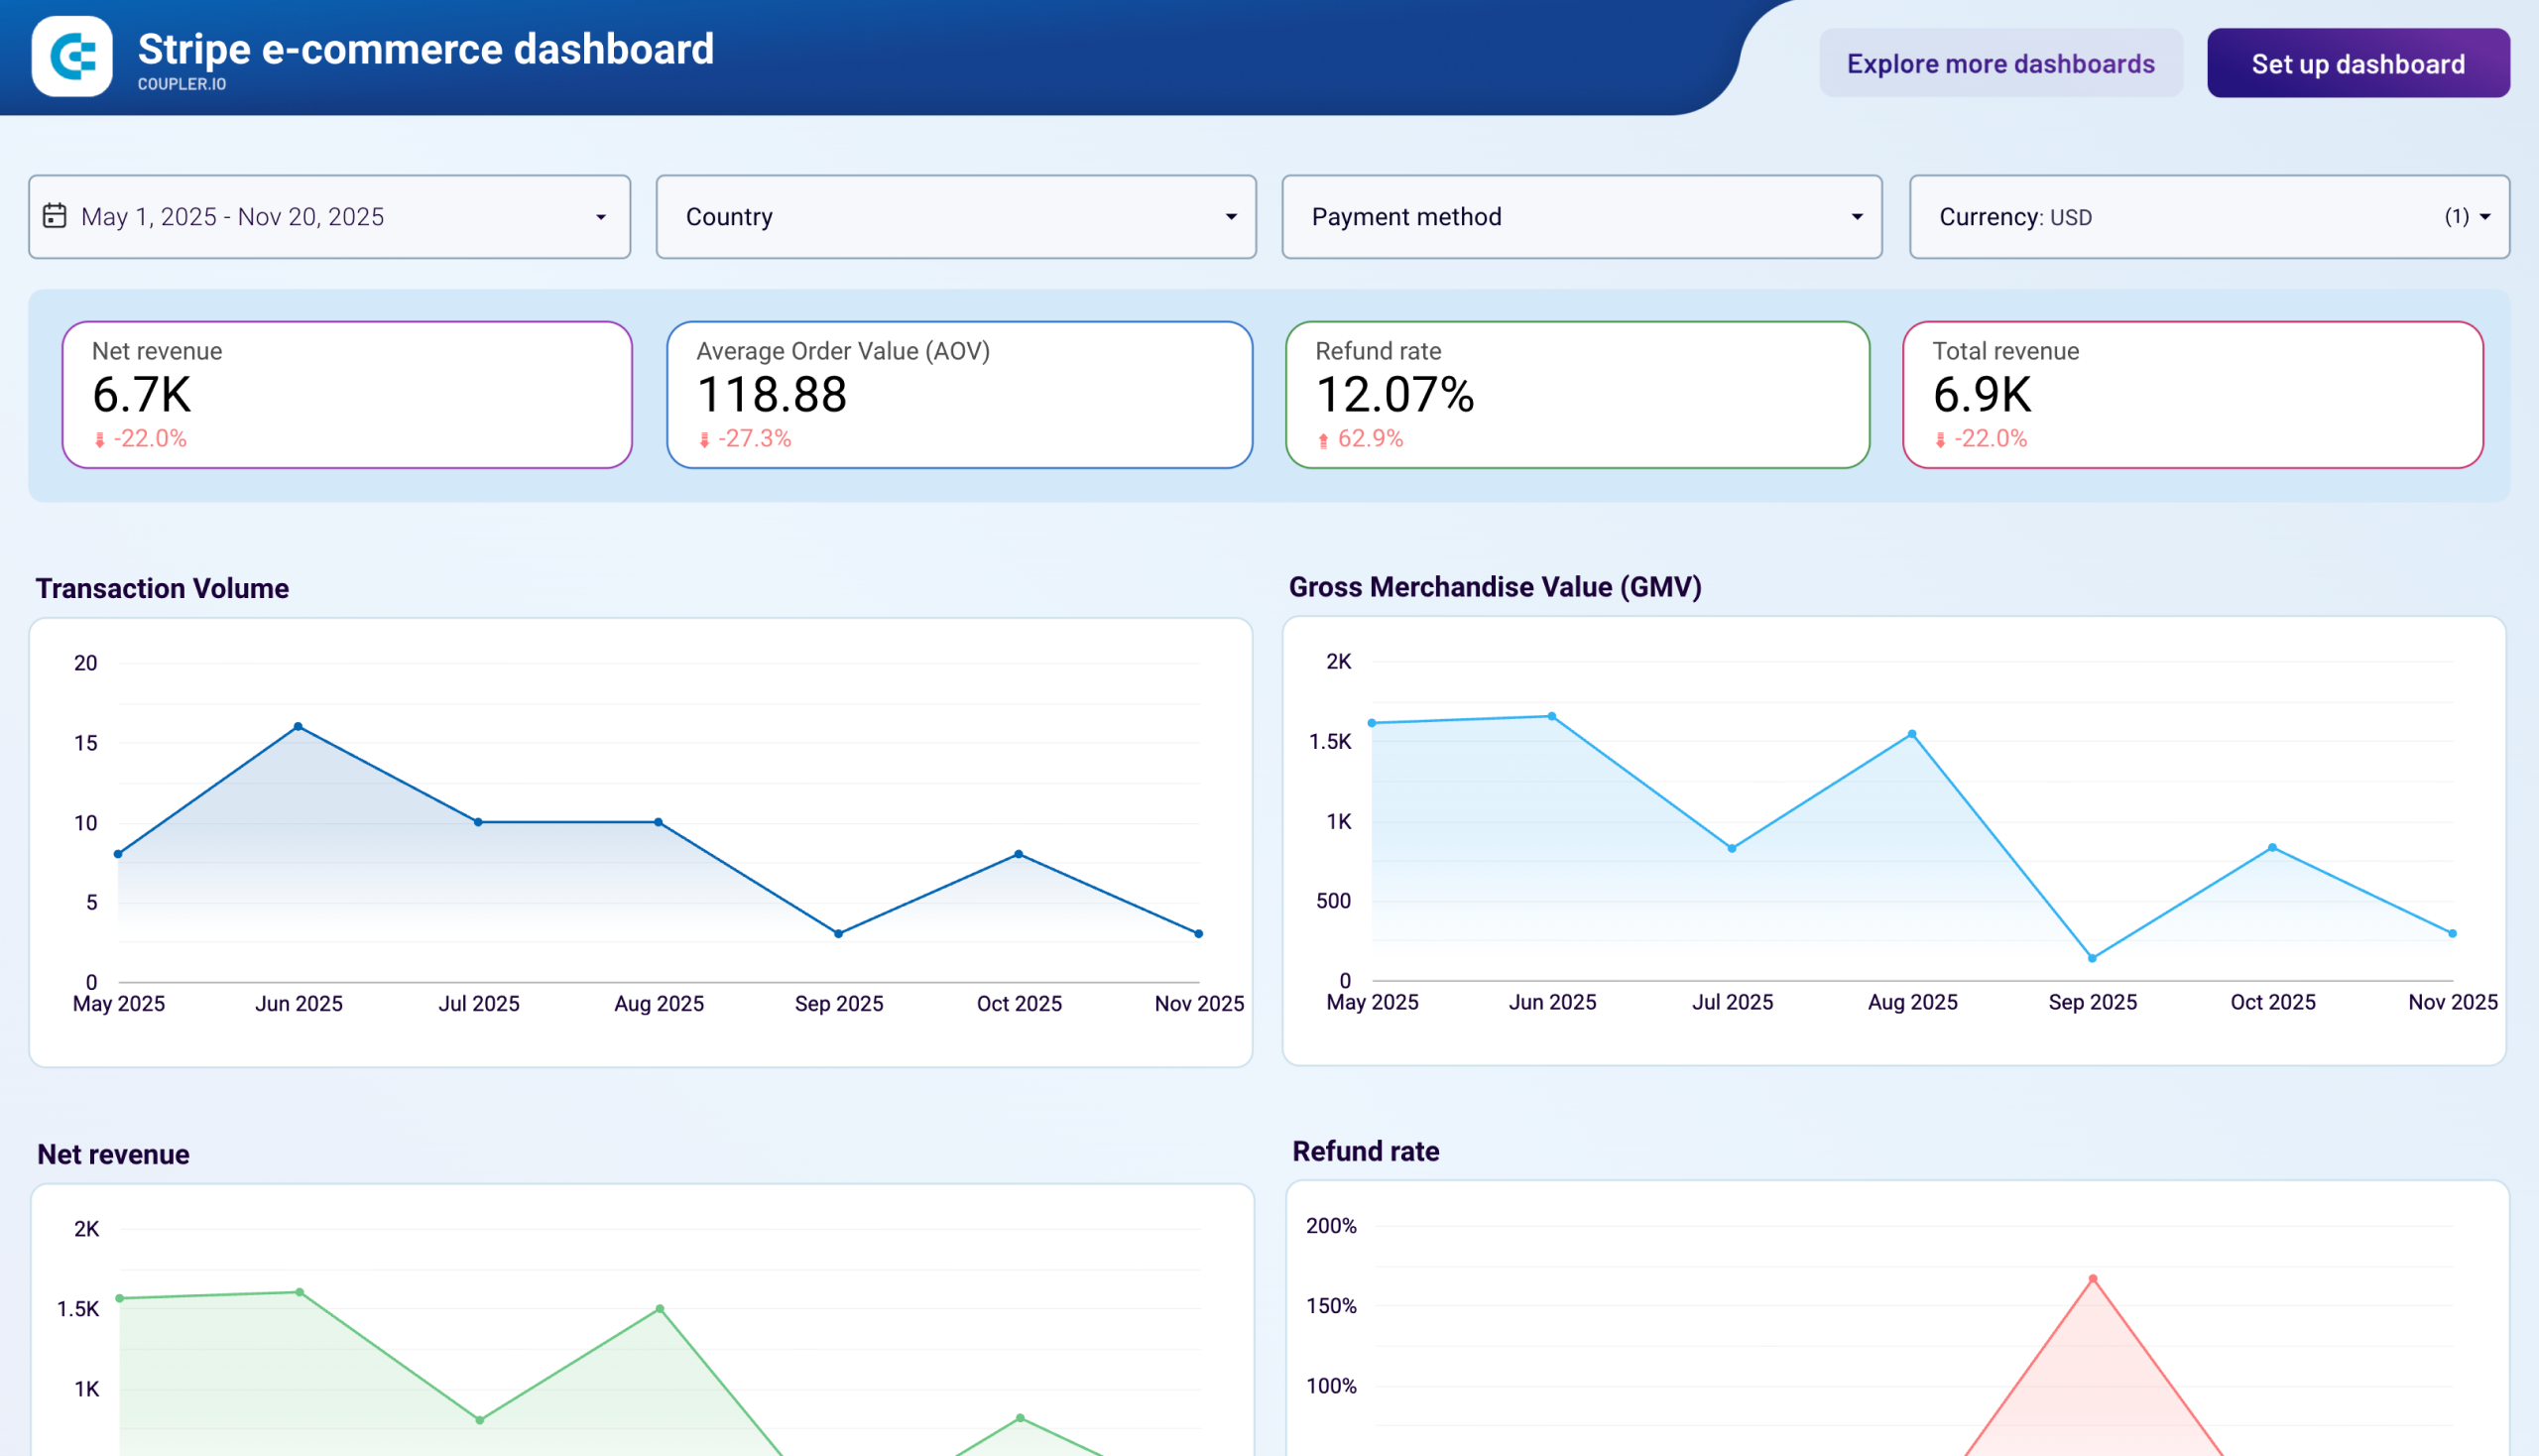
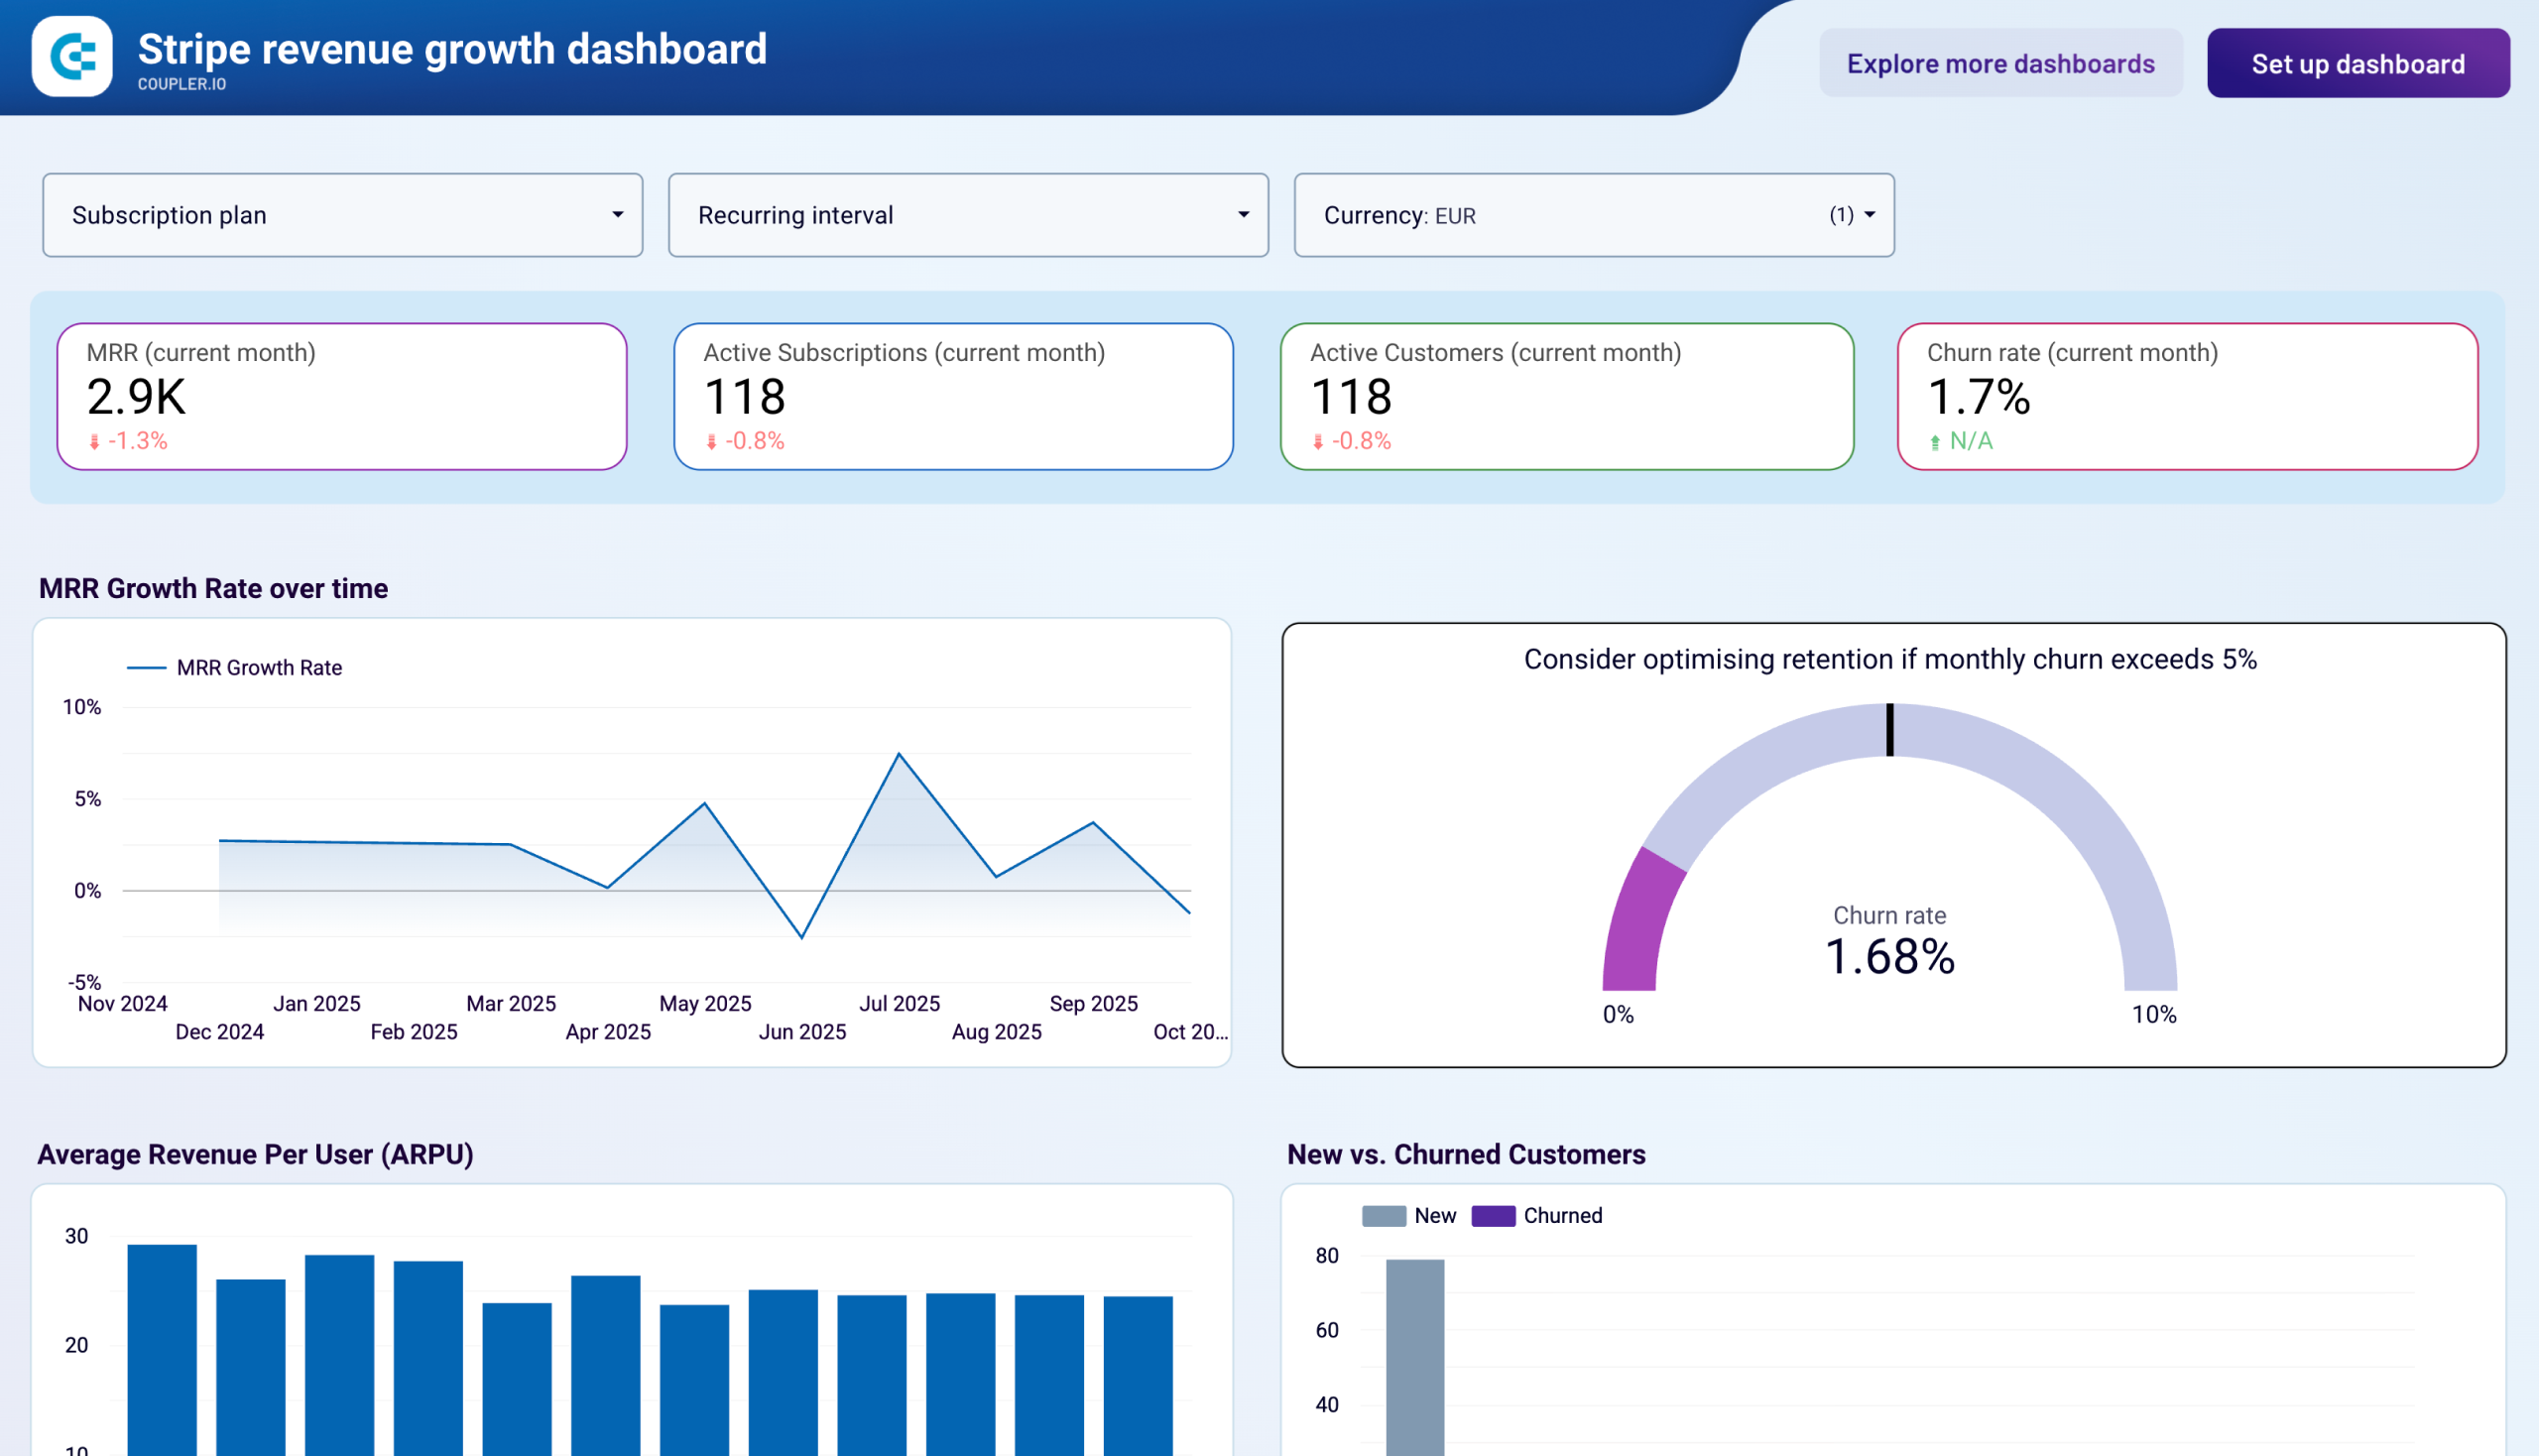
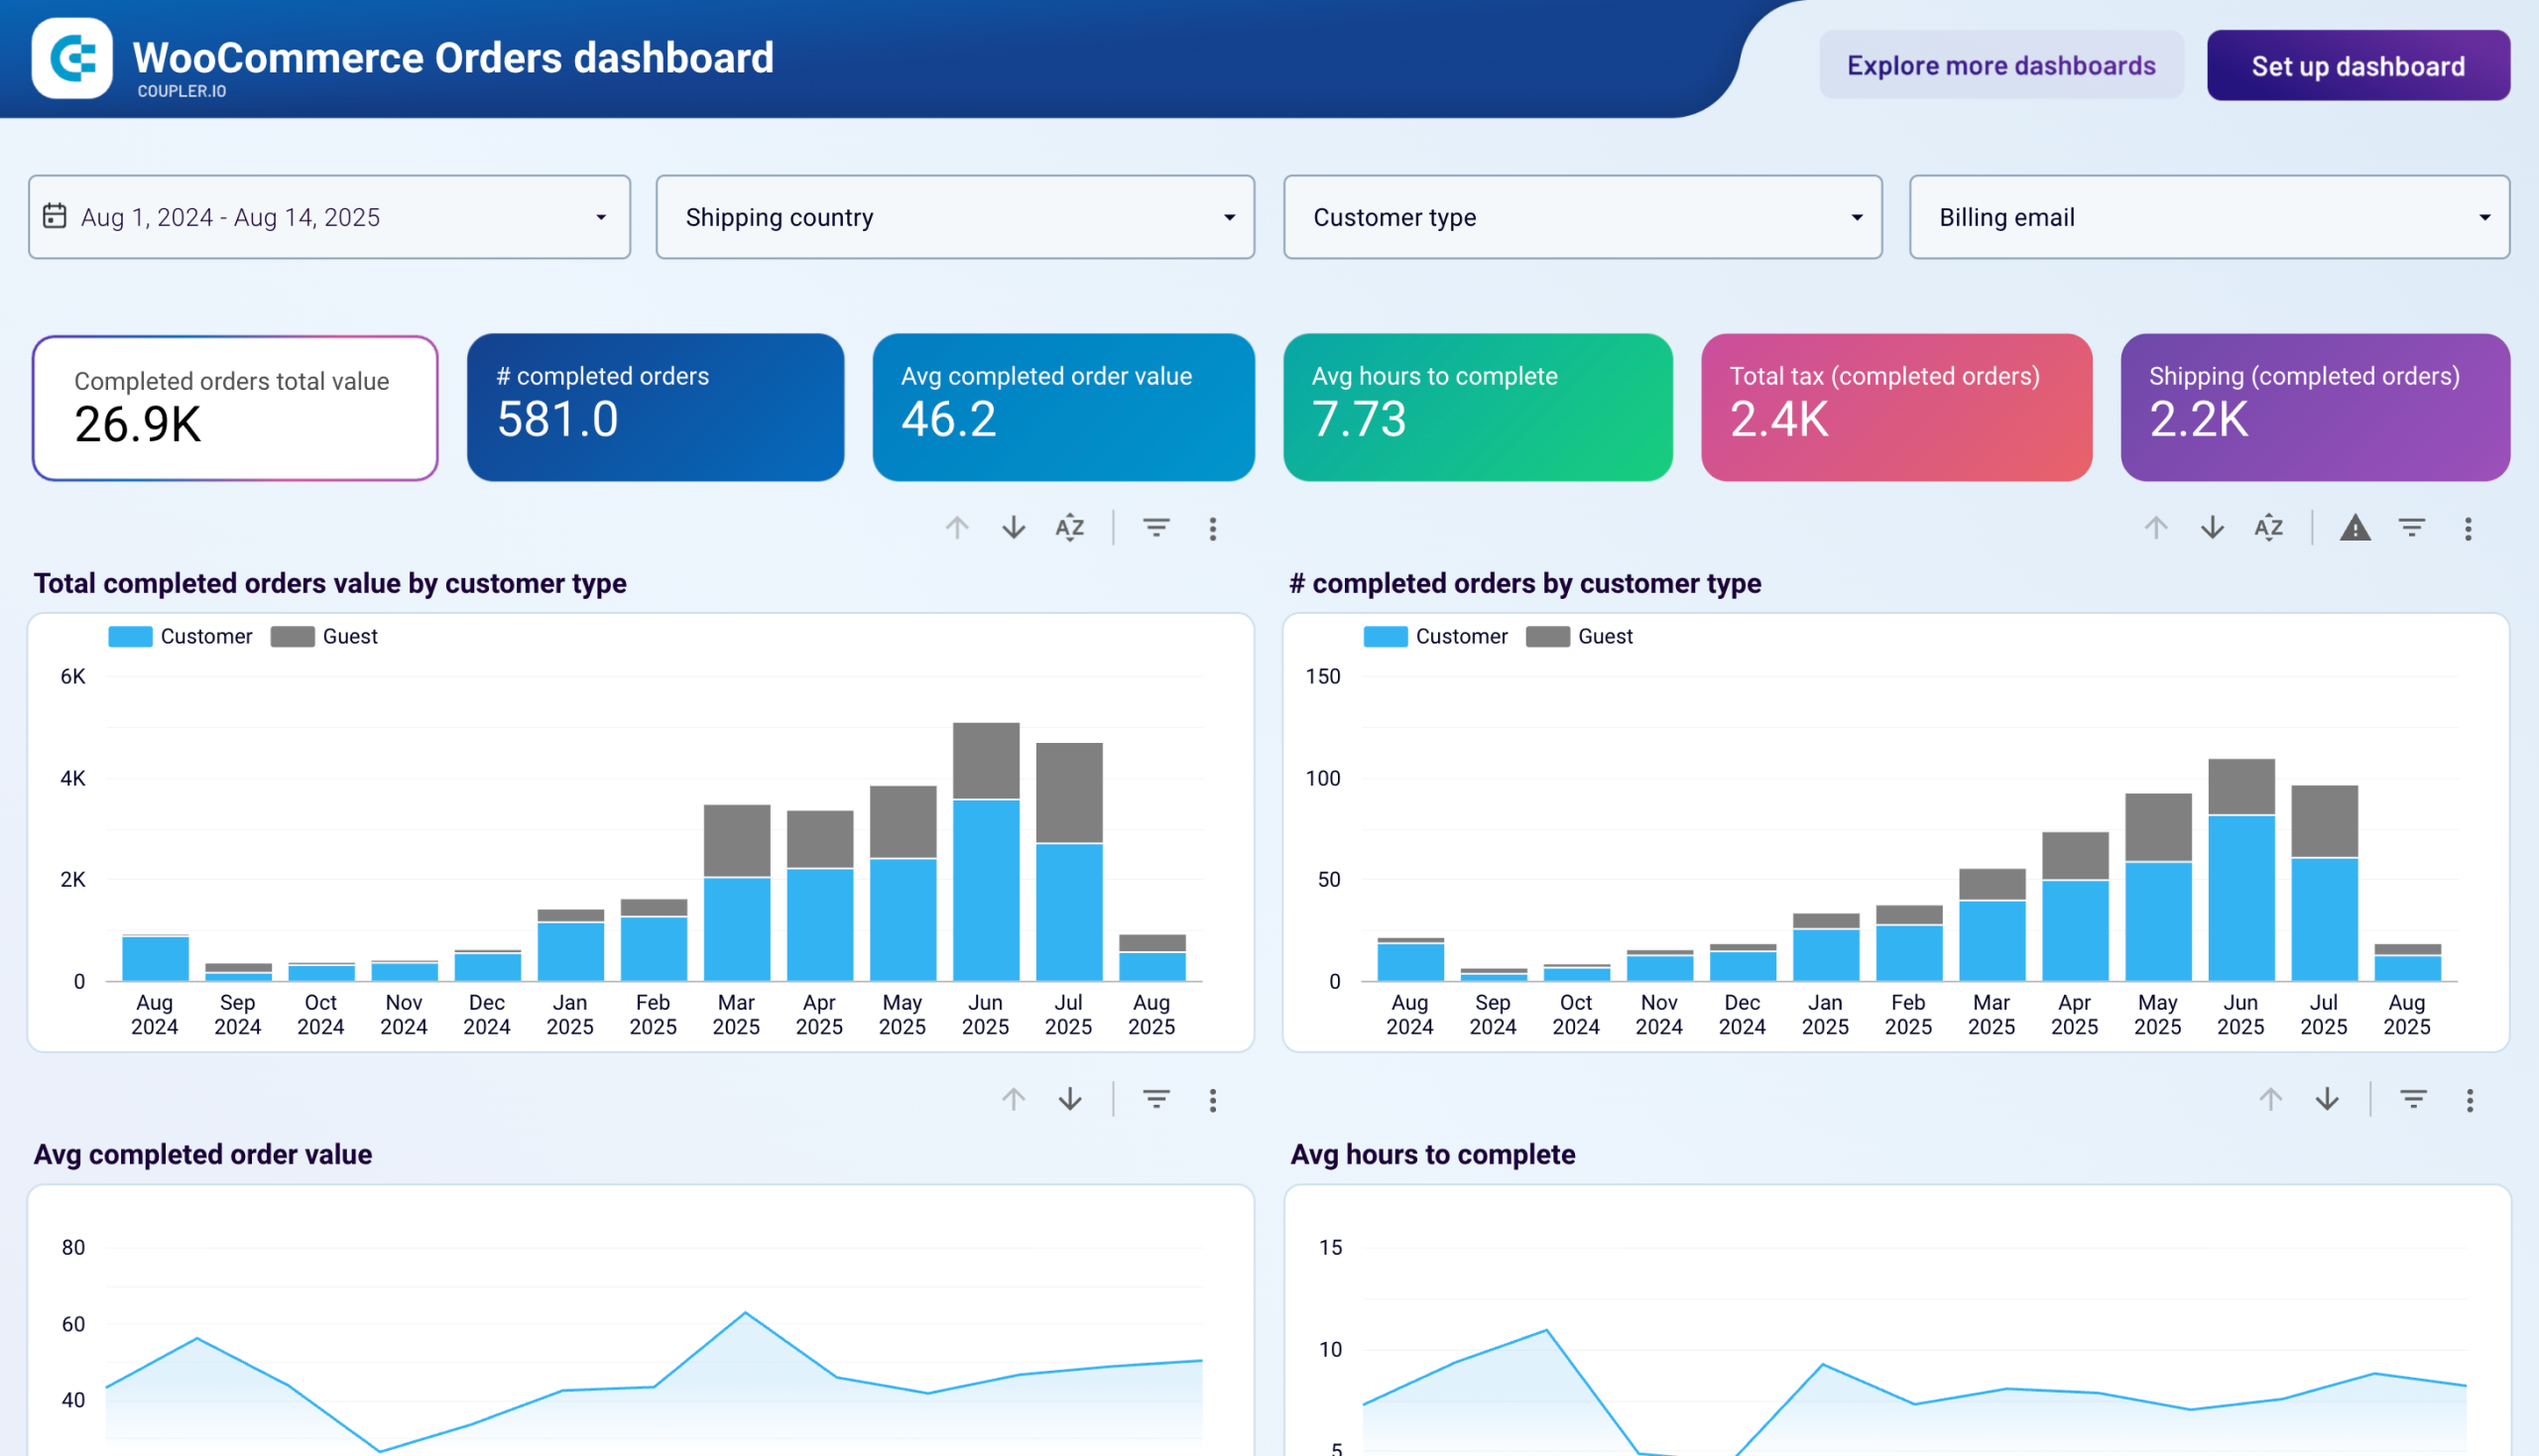
The revenue dashboard for QuickBooks or Xero presents income overviews and tracks revenue trends over 12 months to identify seasonal fluctuations and peak periods. Customer analysis displays top clients by revenue contribution, while product performance metrics highlight your most profitable offerings. The profit and loss overview compares revenue against expenses across multiple time periods with clear visualizations of net income trends. This combination of perspectives (temporal trends, customer segments, and product mix) provides the context needed to understand what drives revenue growth and where opportunities exist to improve profitability through customer focus or product strategy adjustments.

Measure sales pipeline progress and team results
looker-studio-templates-3.png
Find this insight in the Sales KPI Dashboard for Pipedrive template.

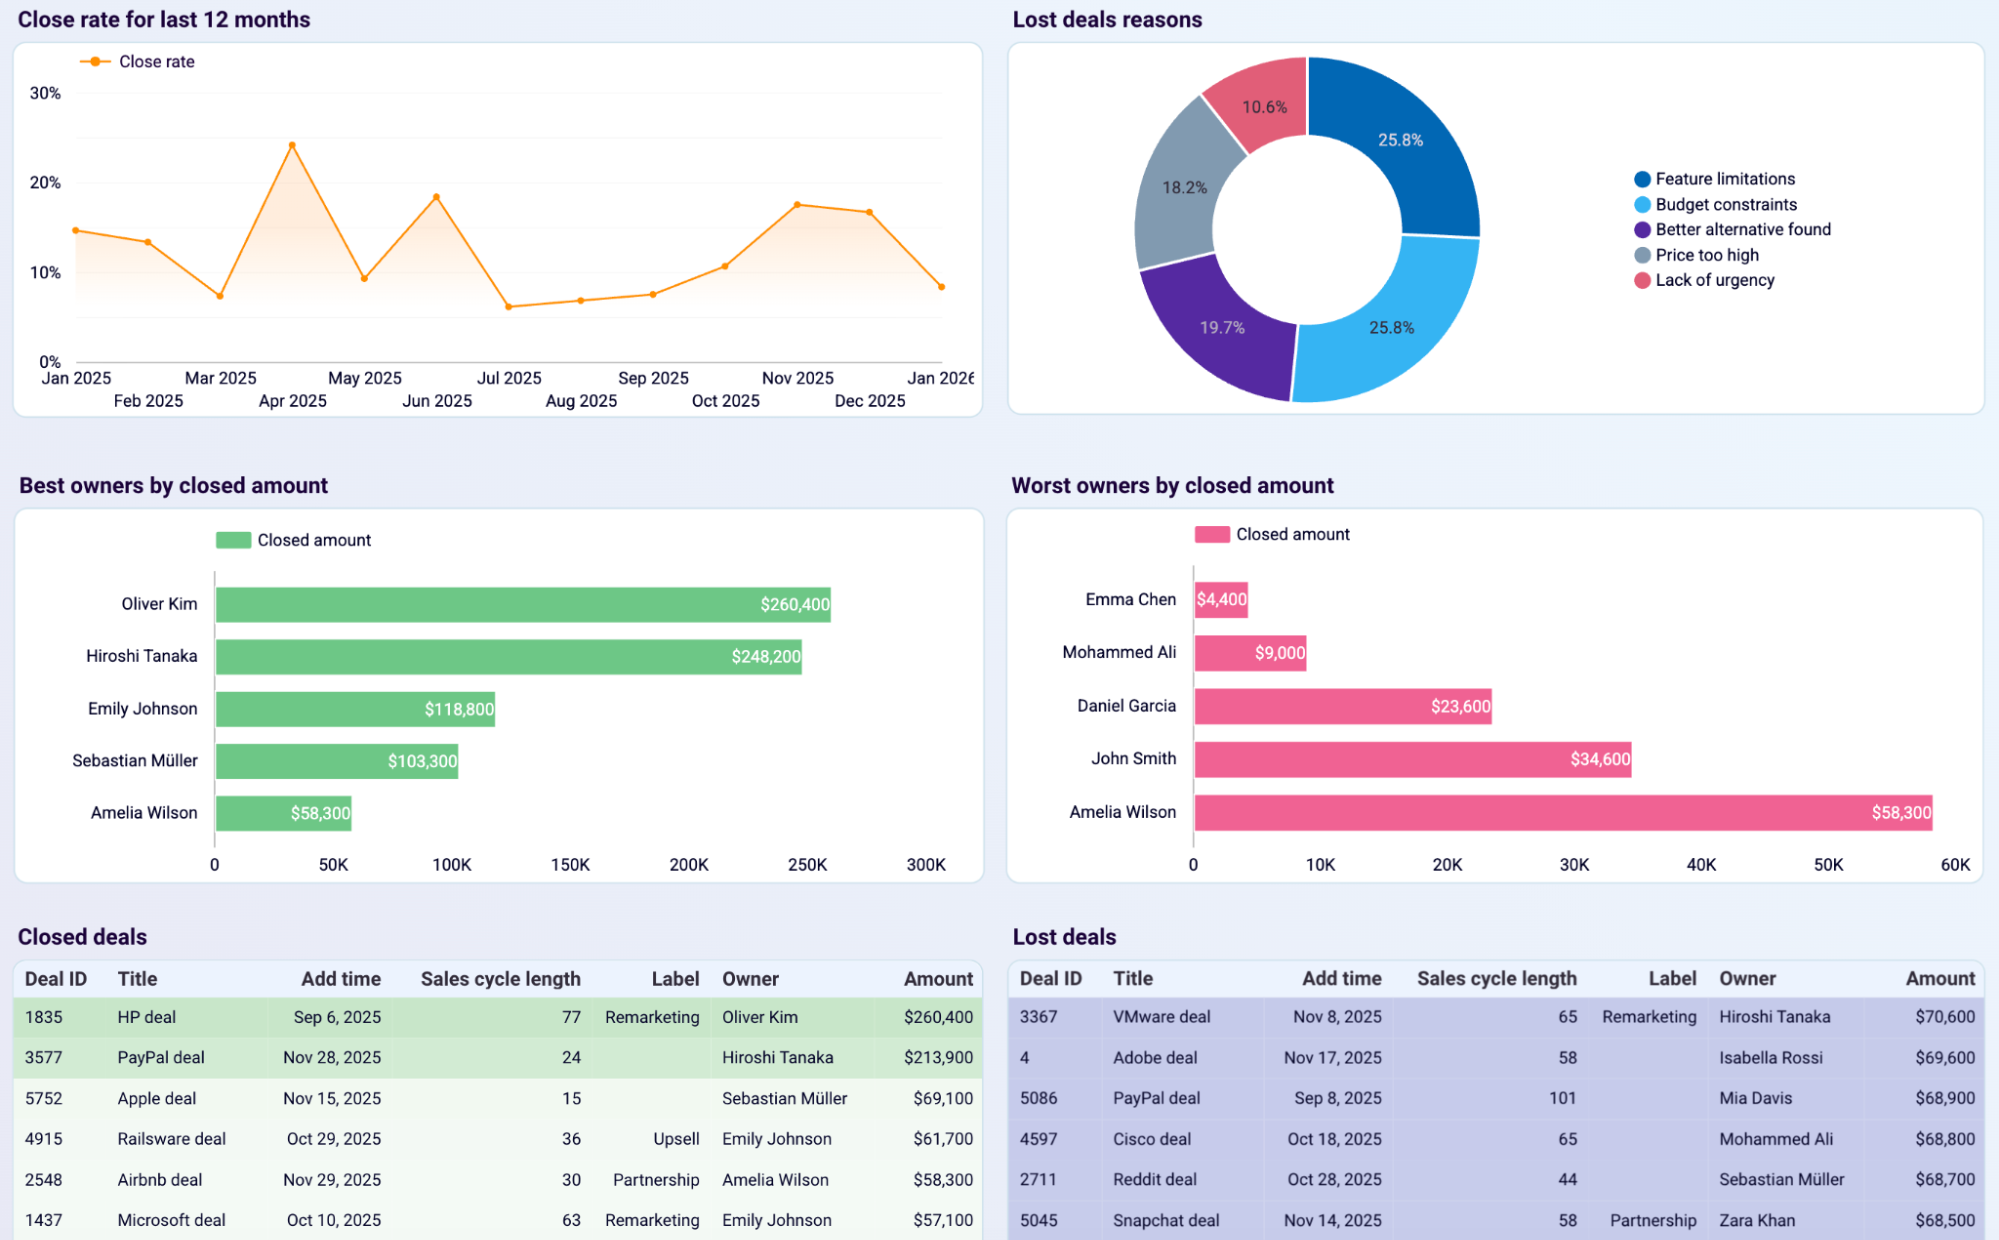
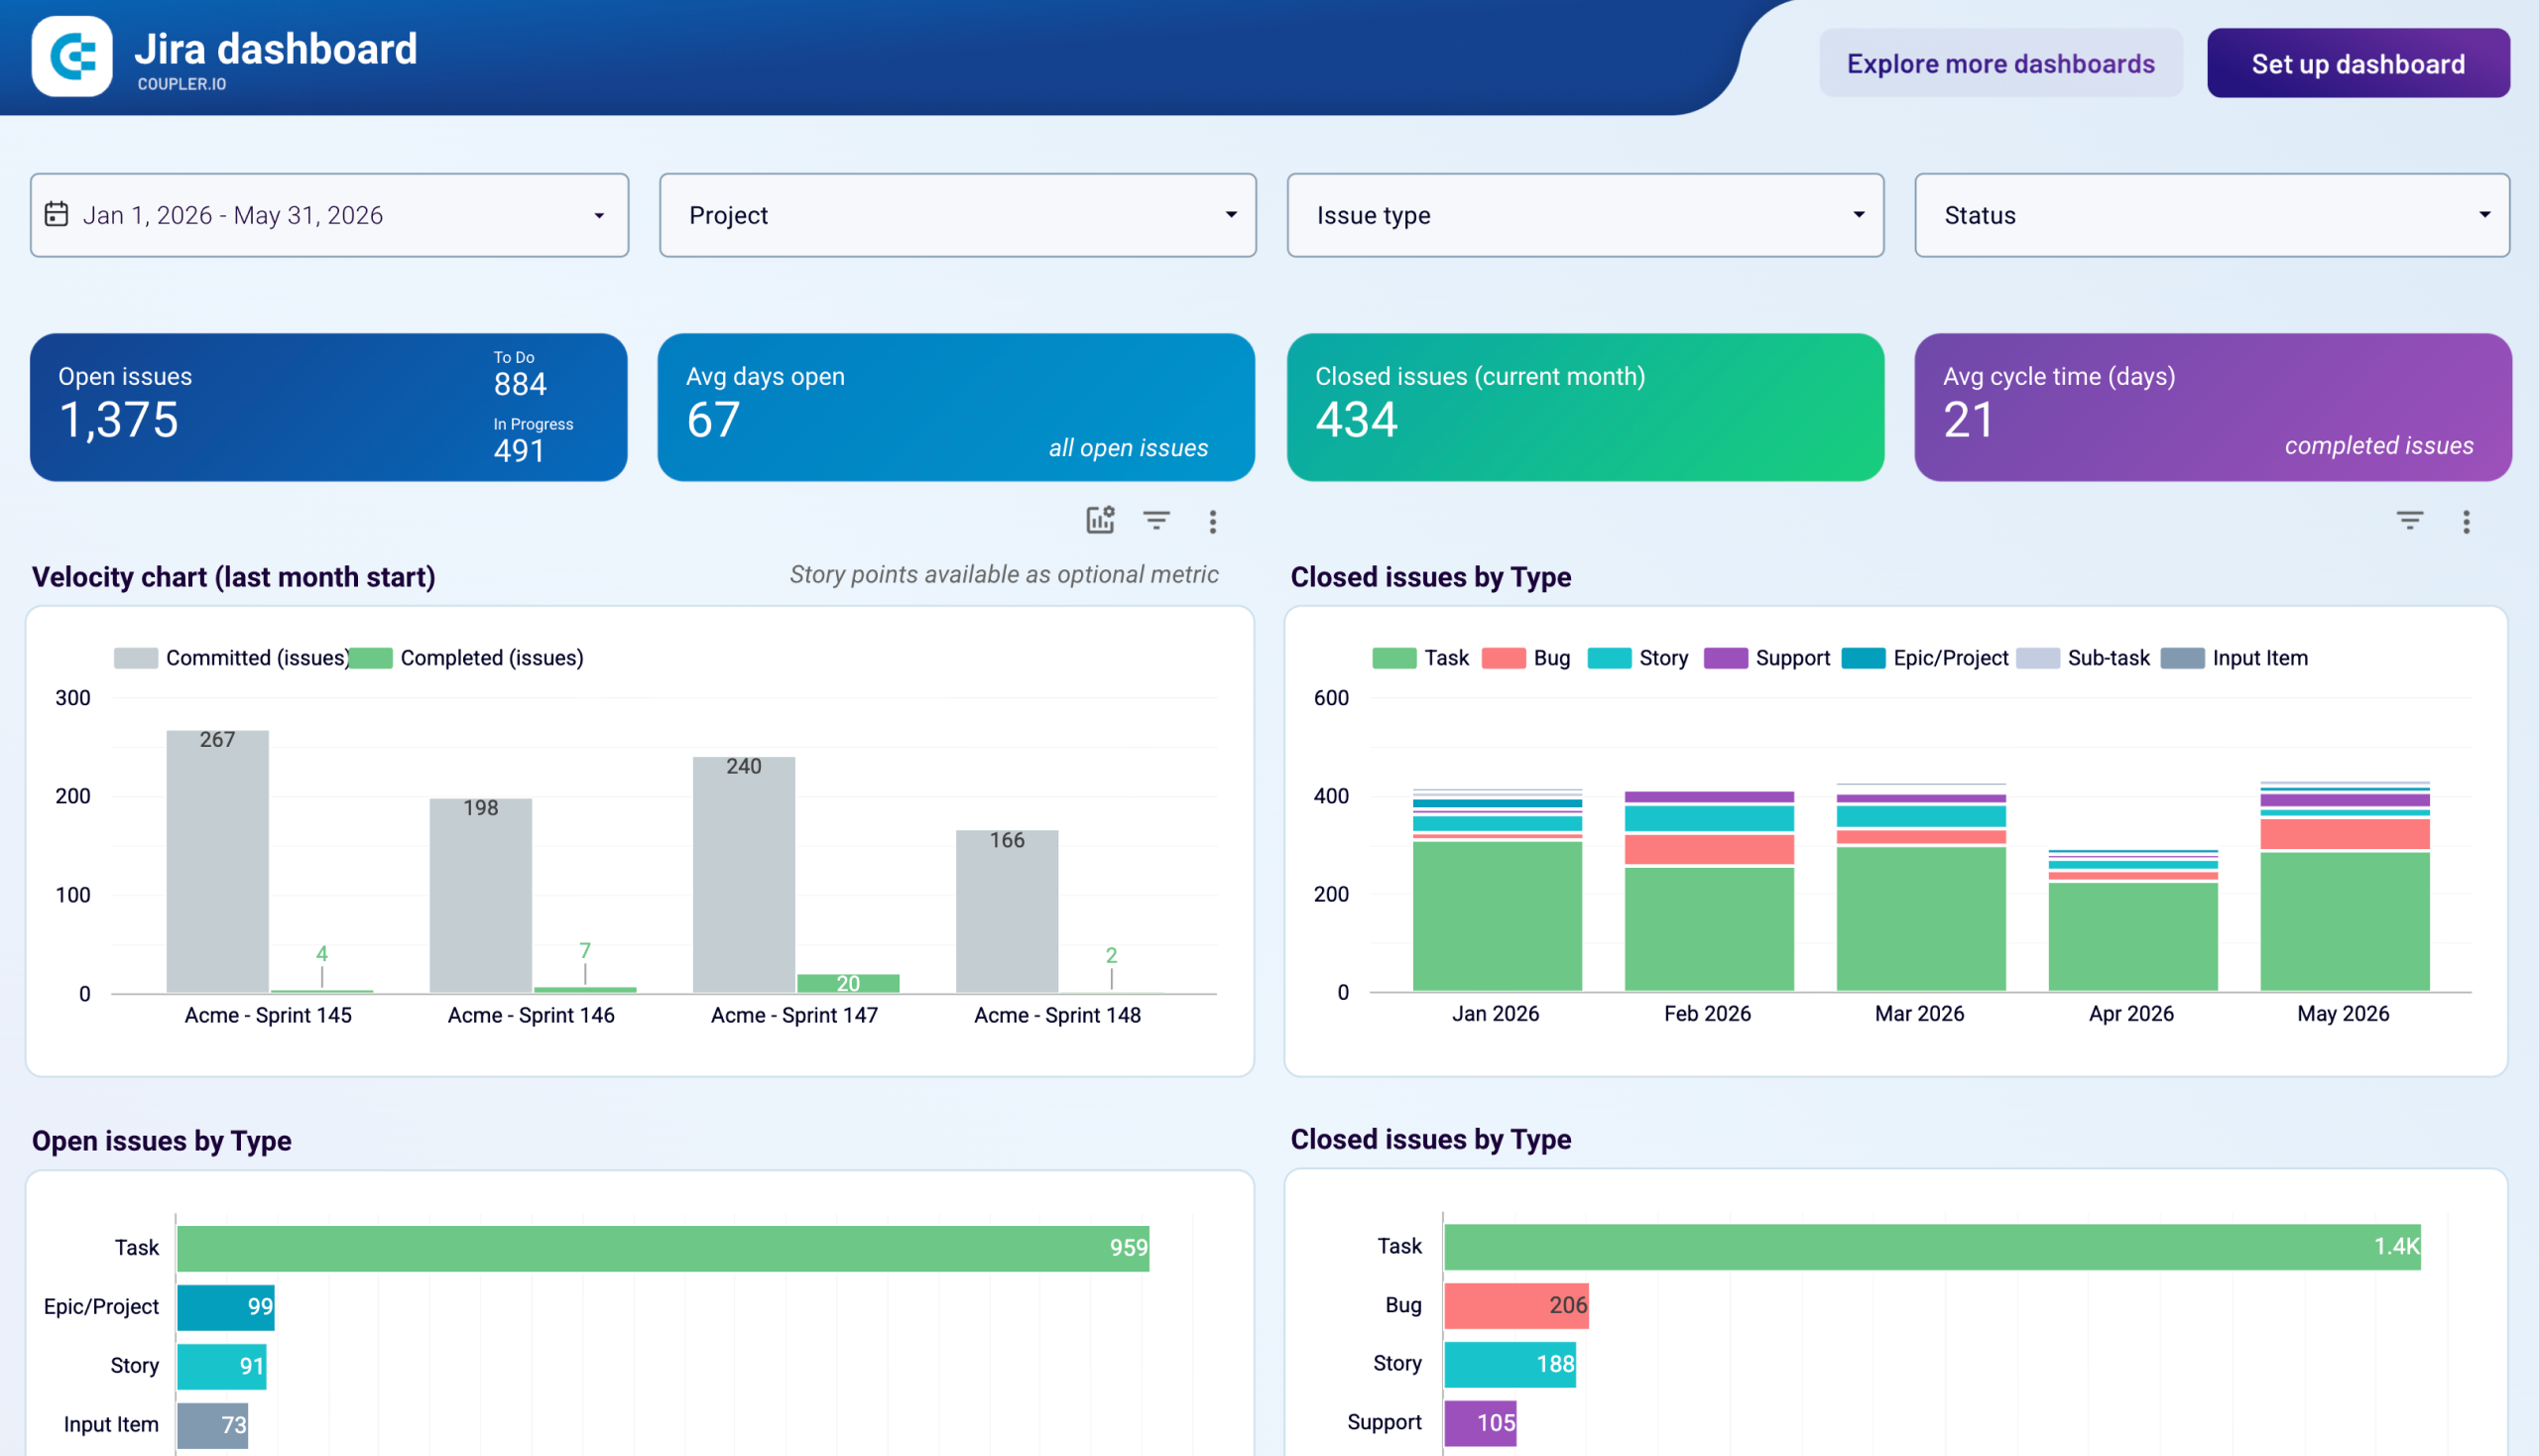
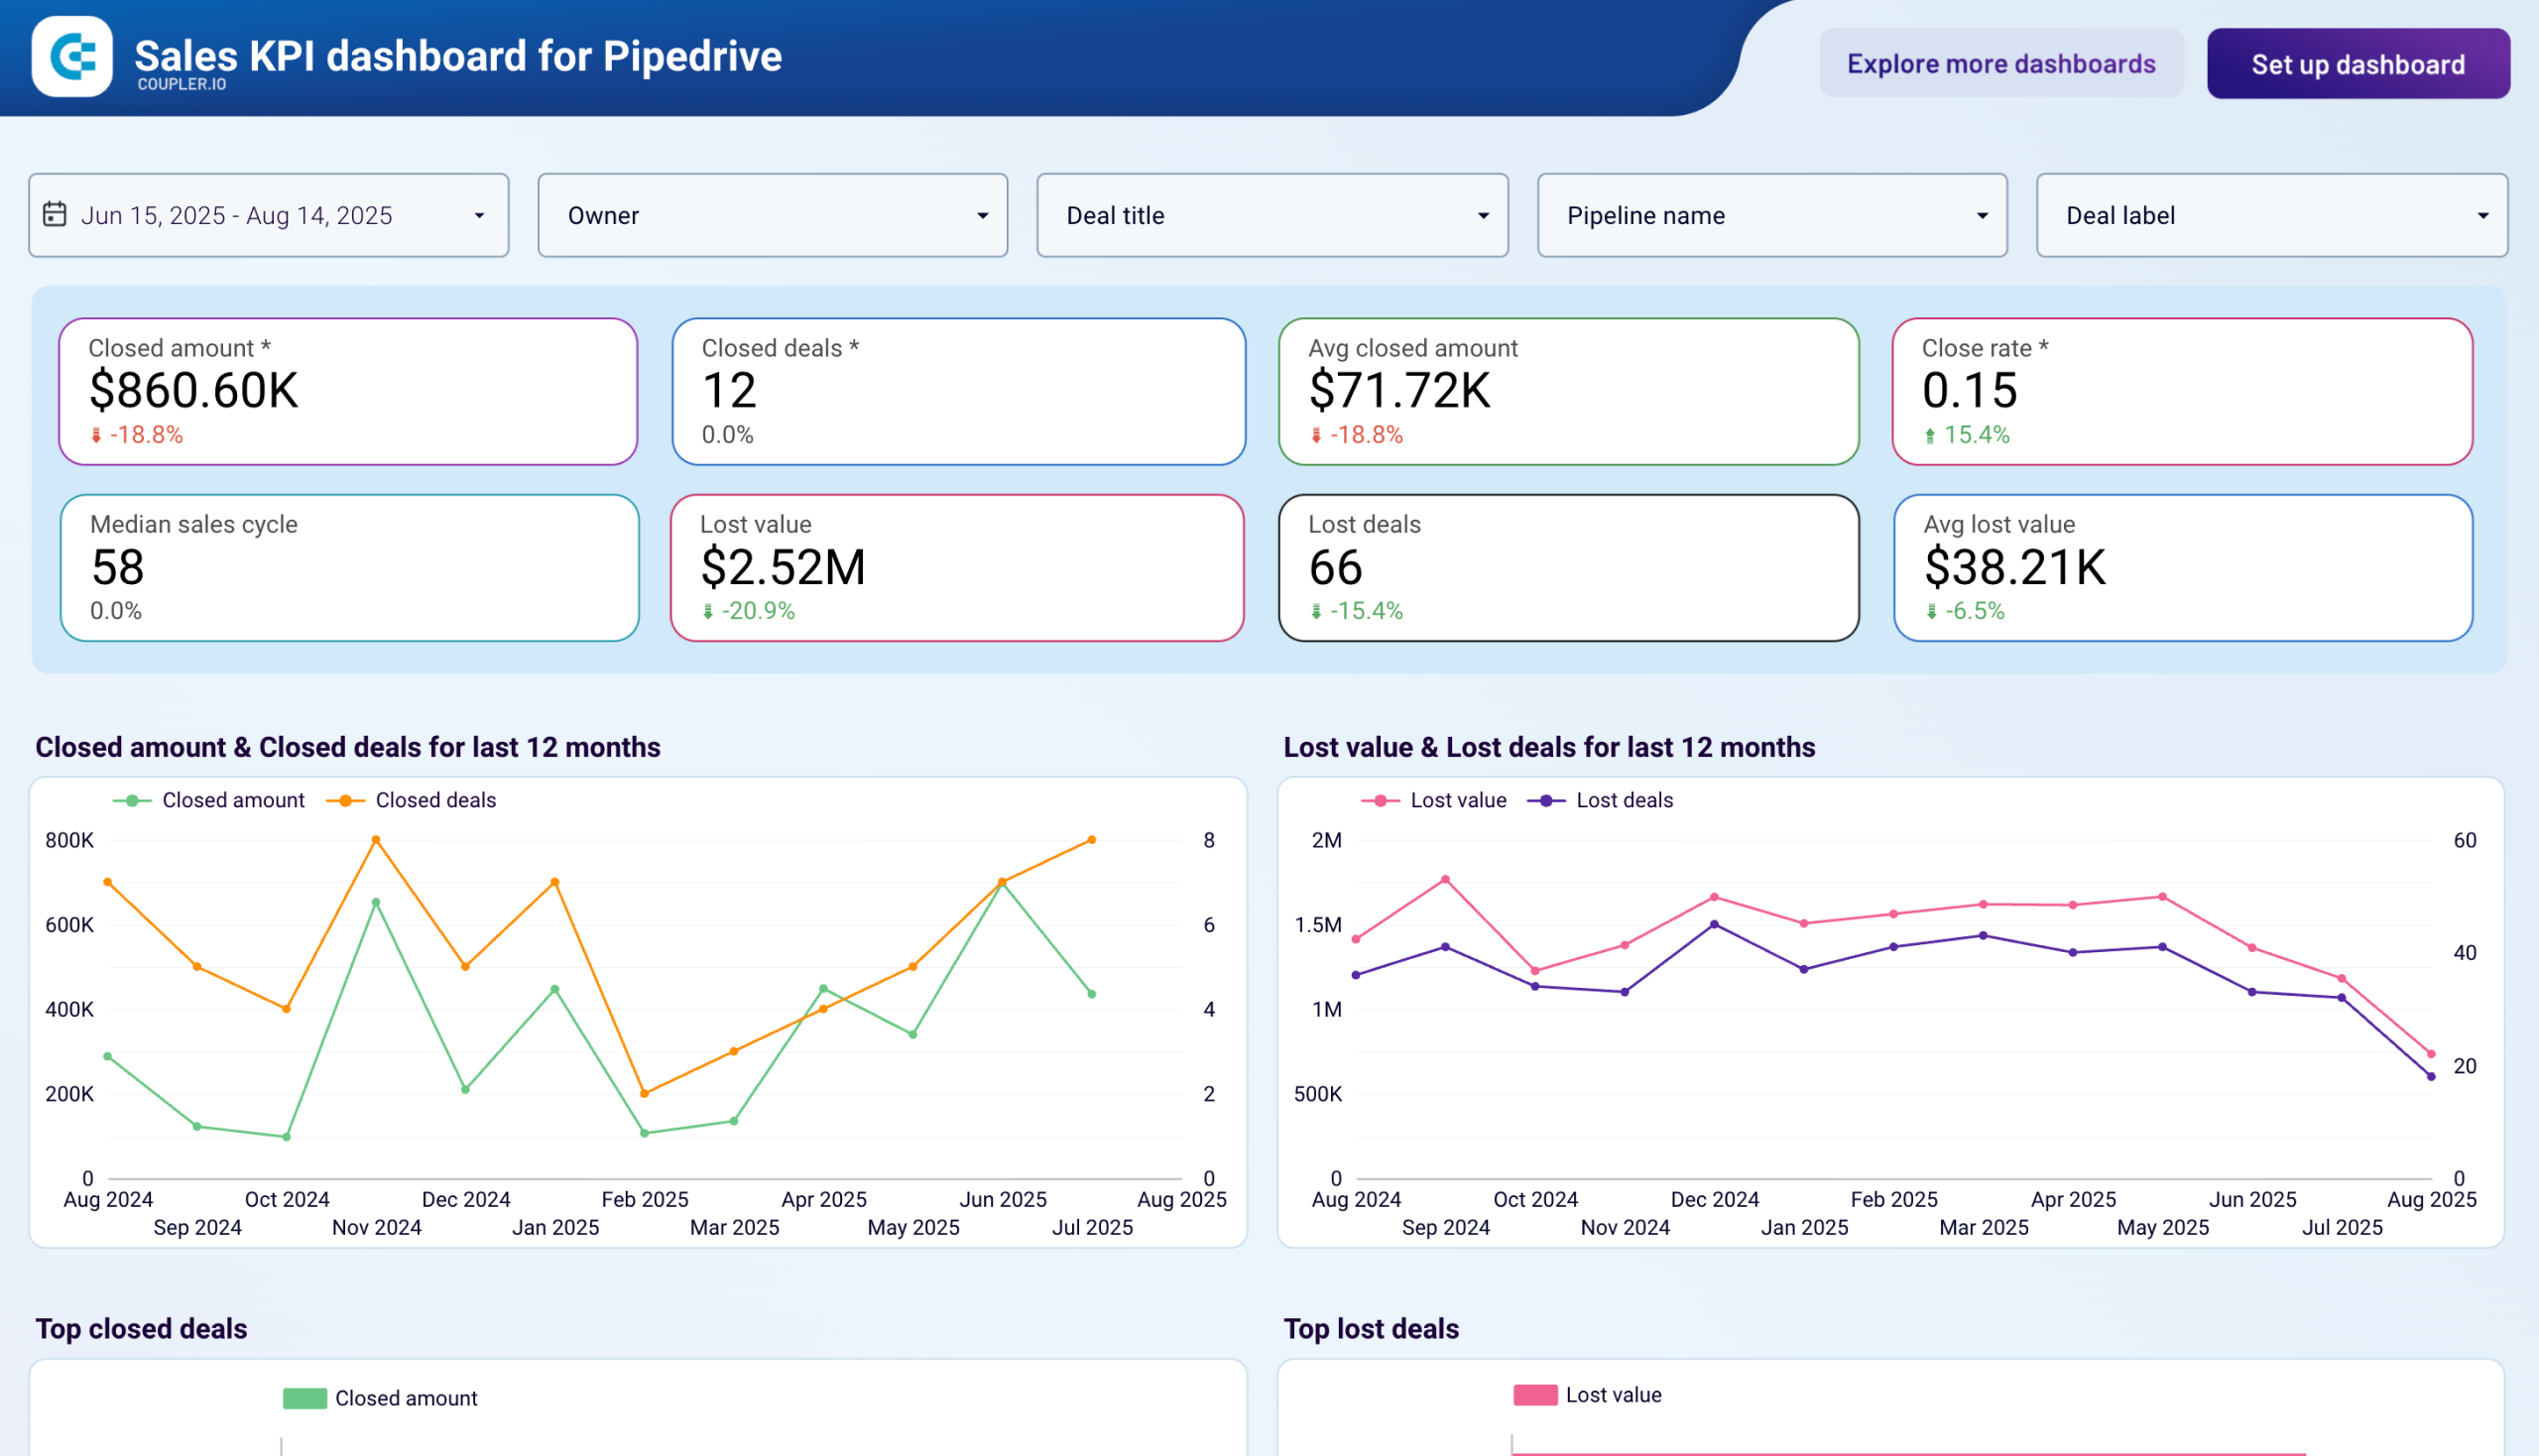
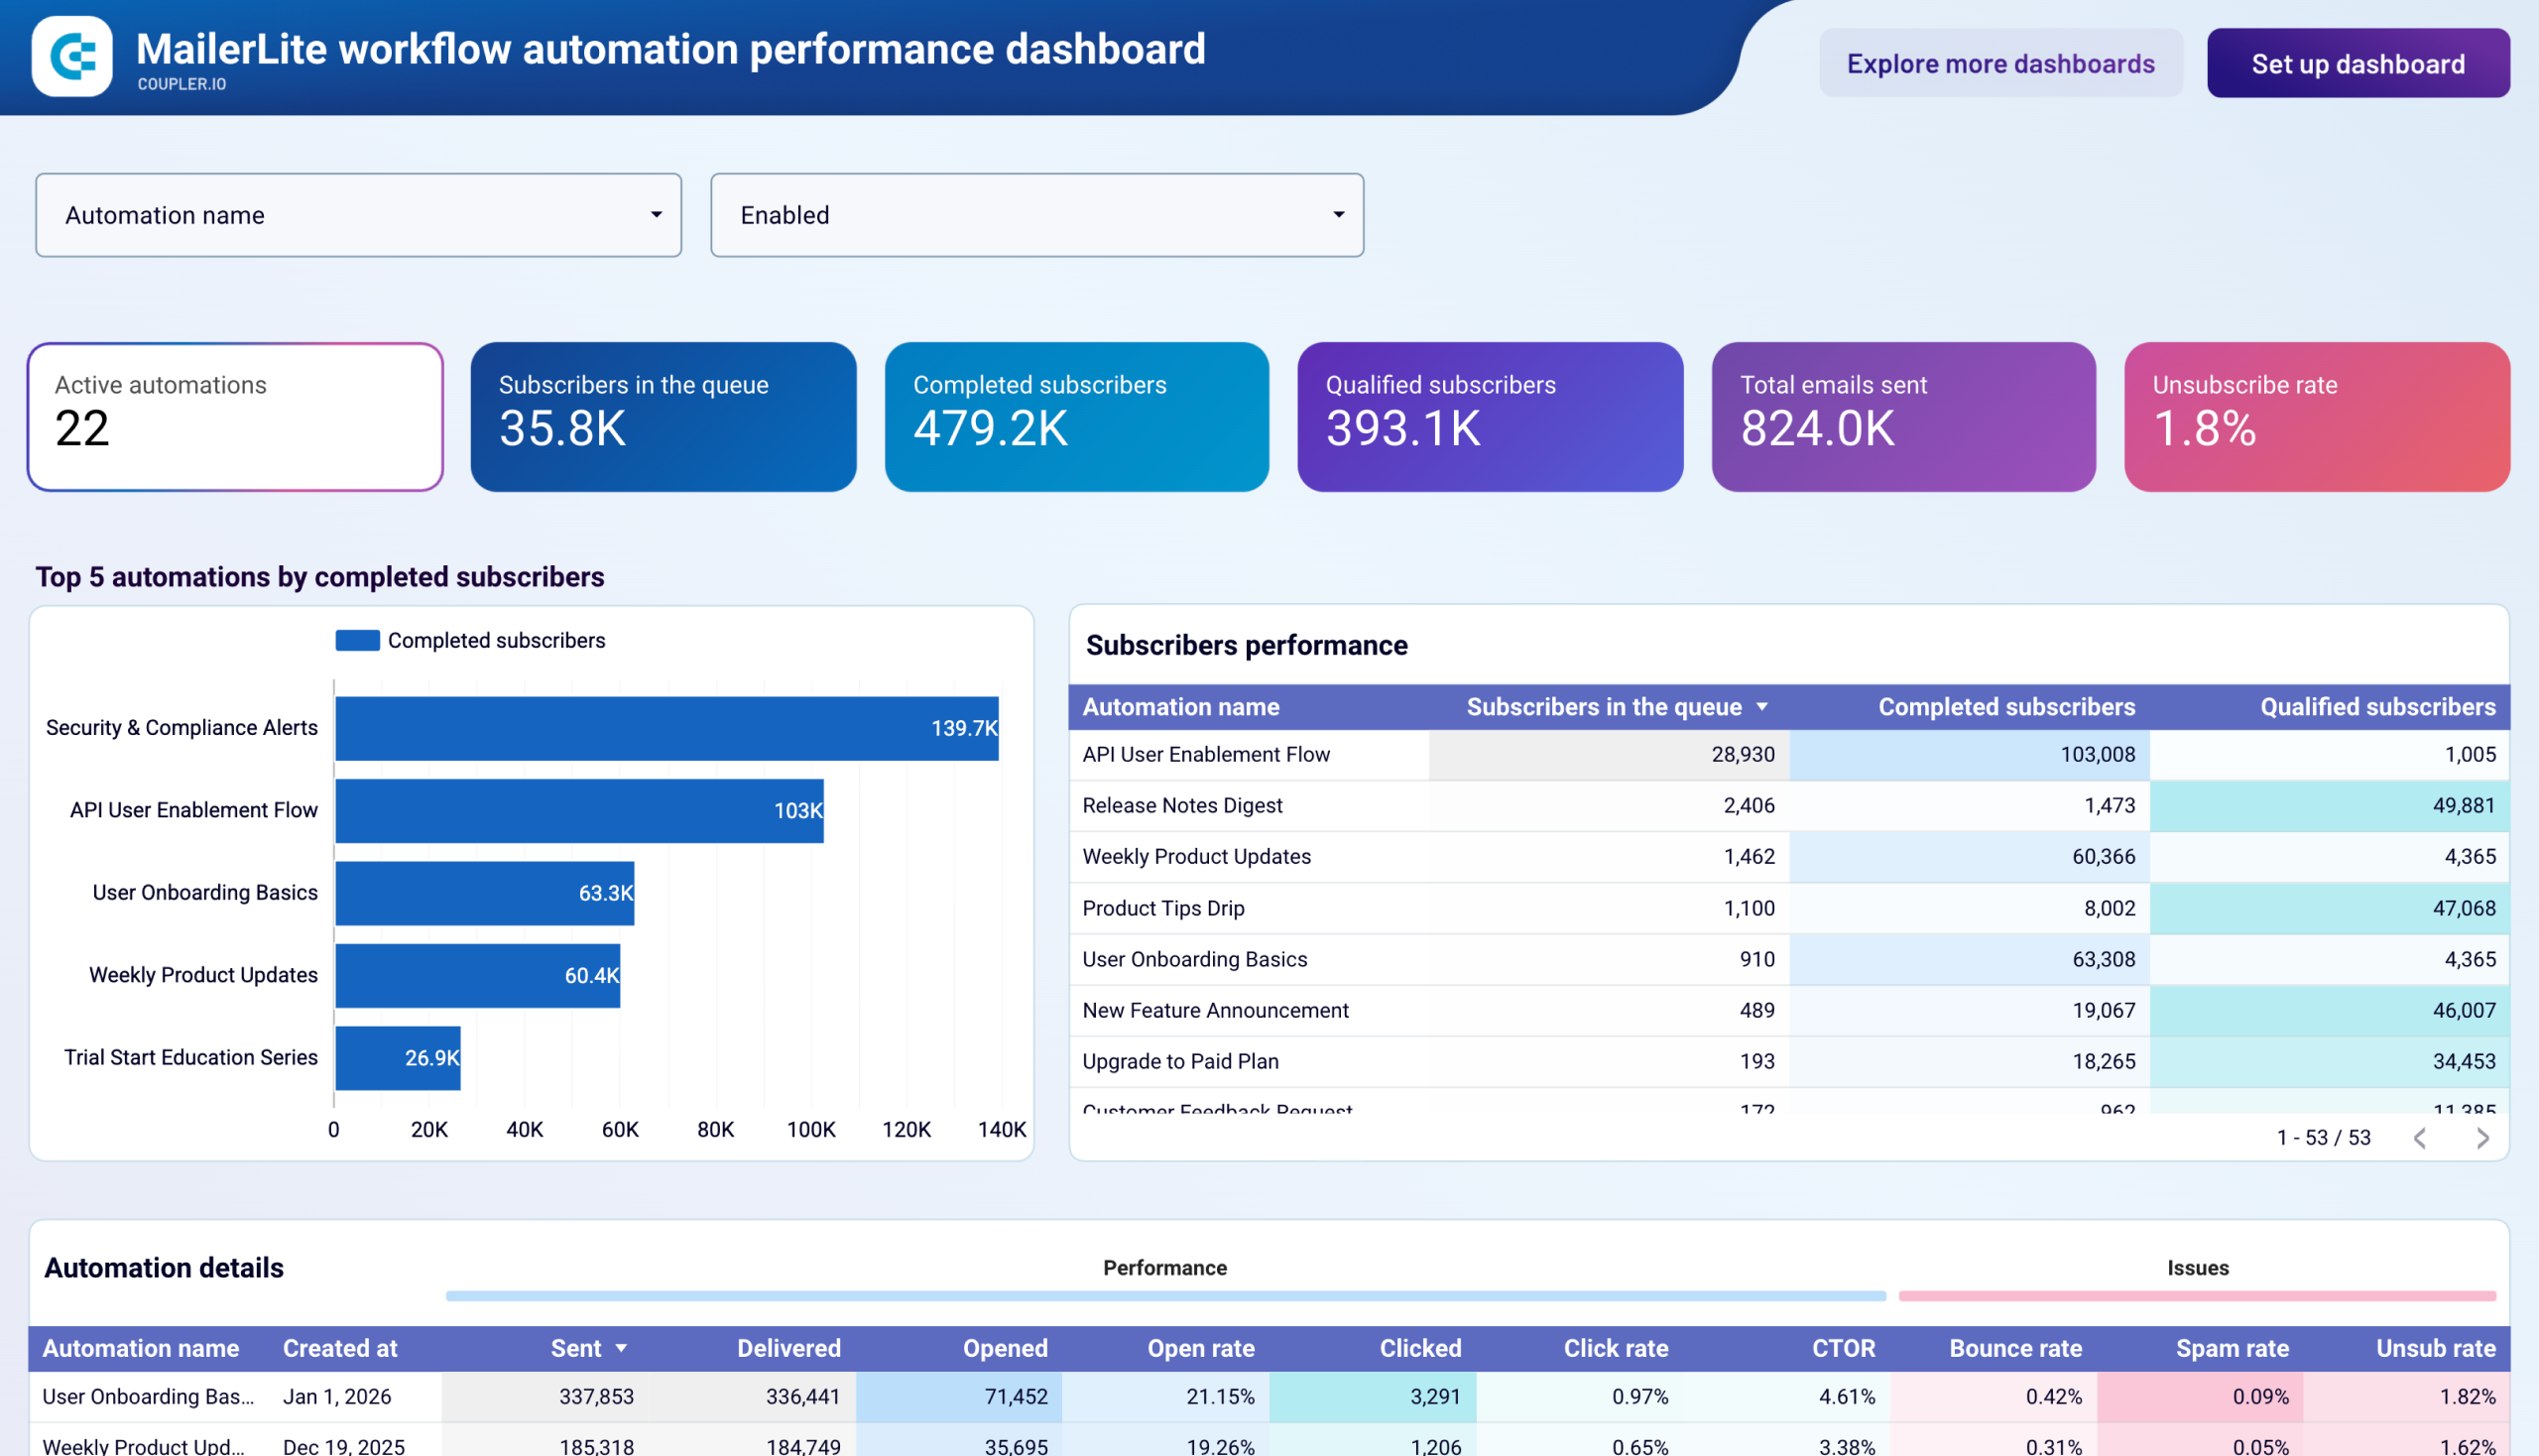
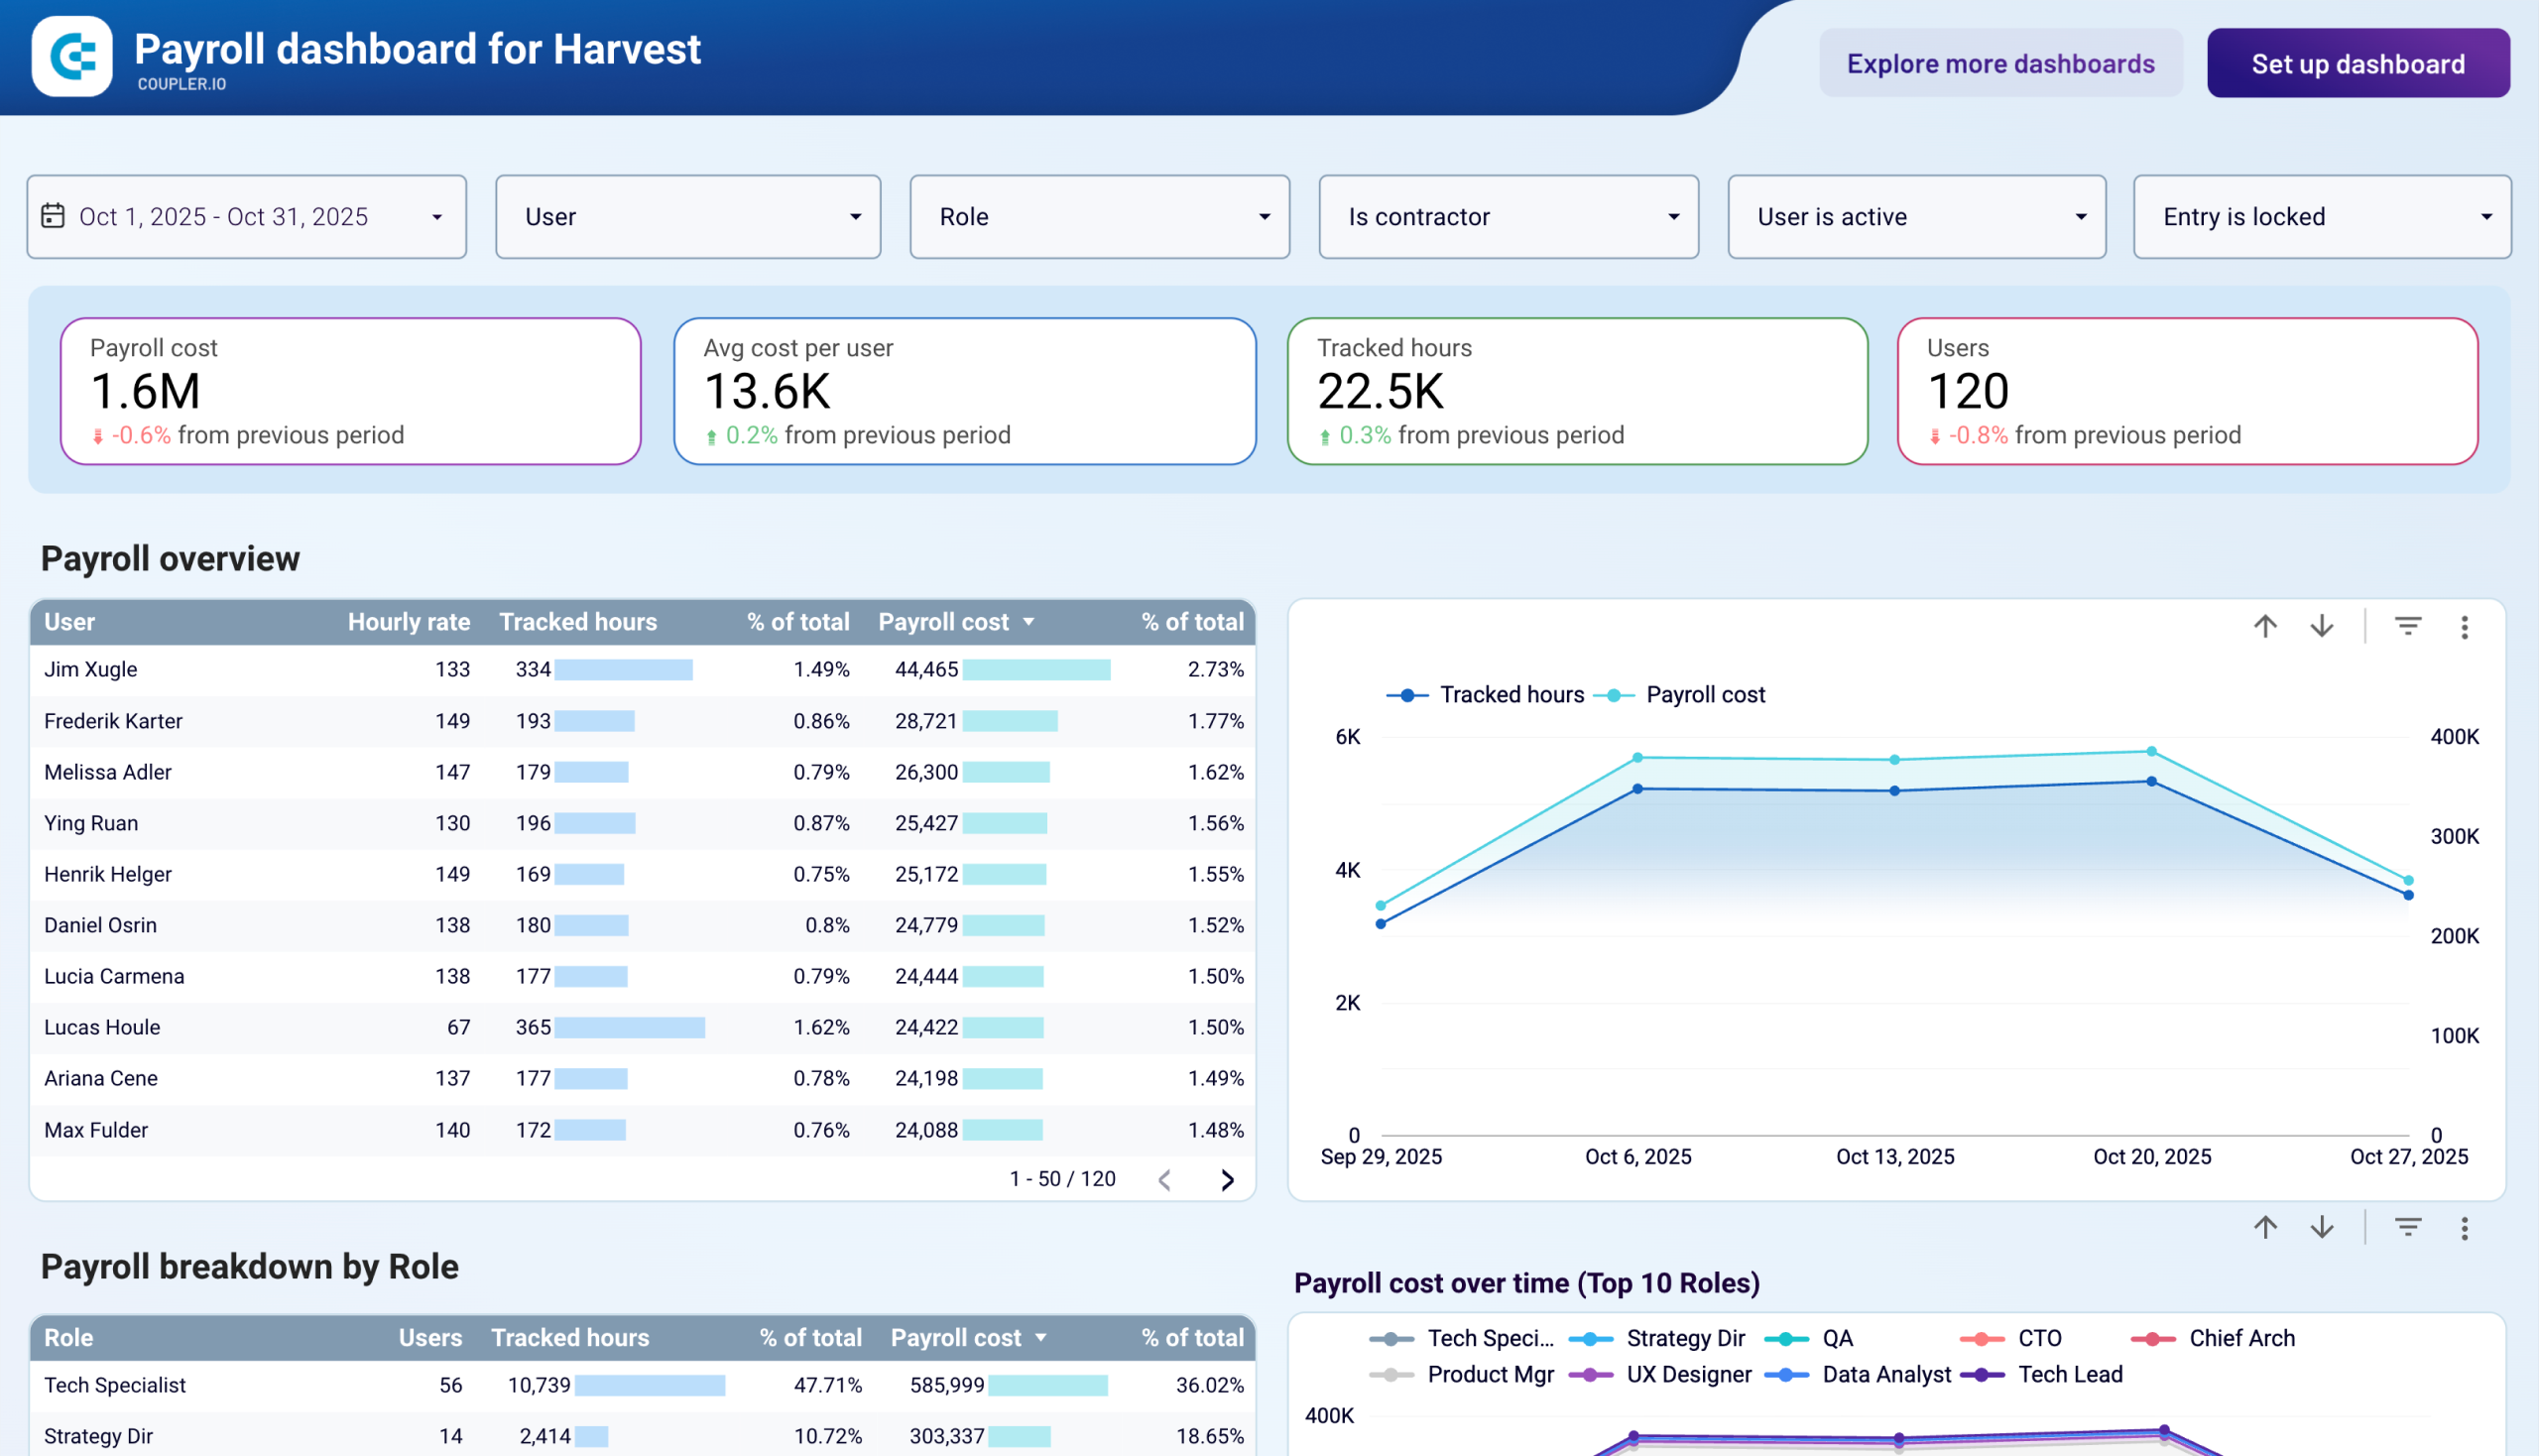
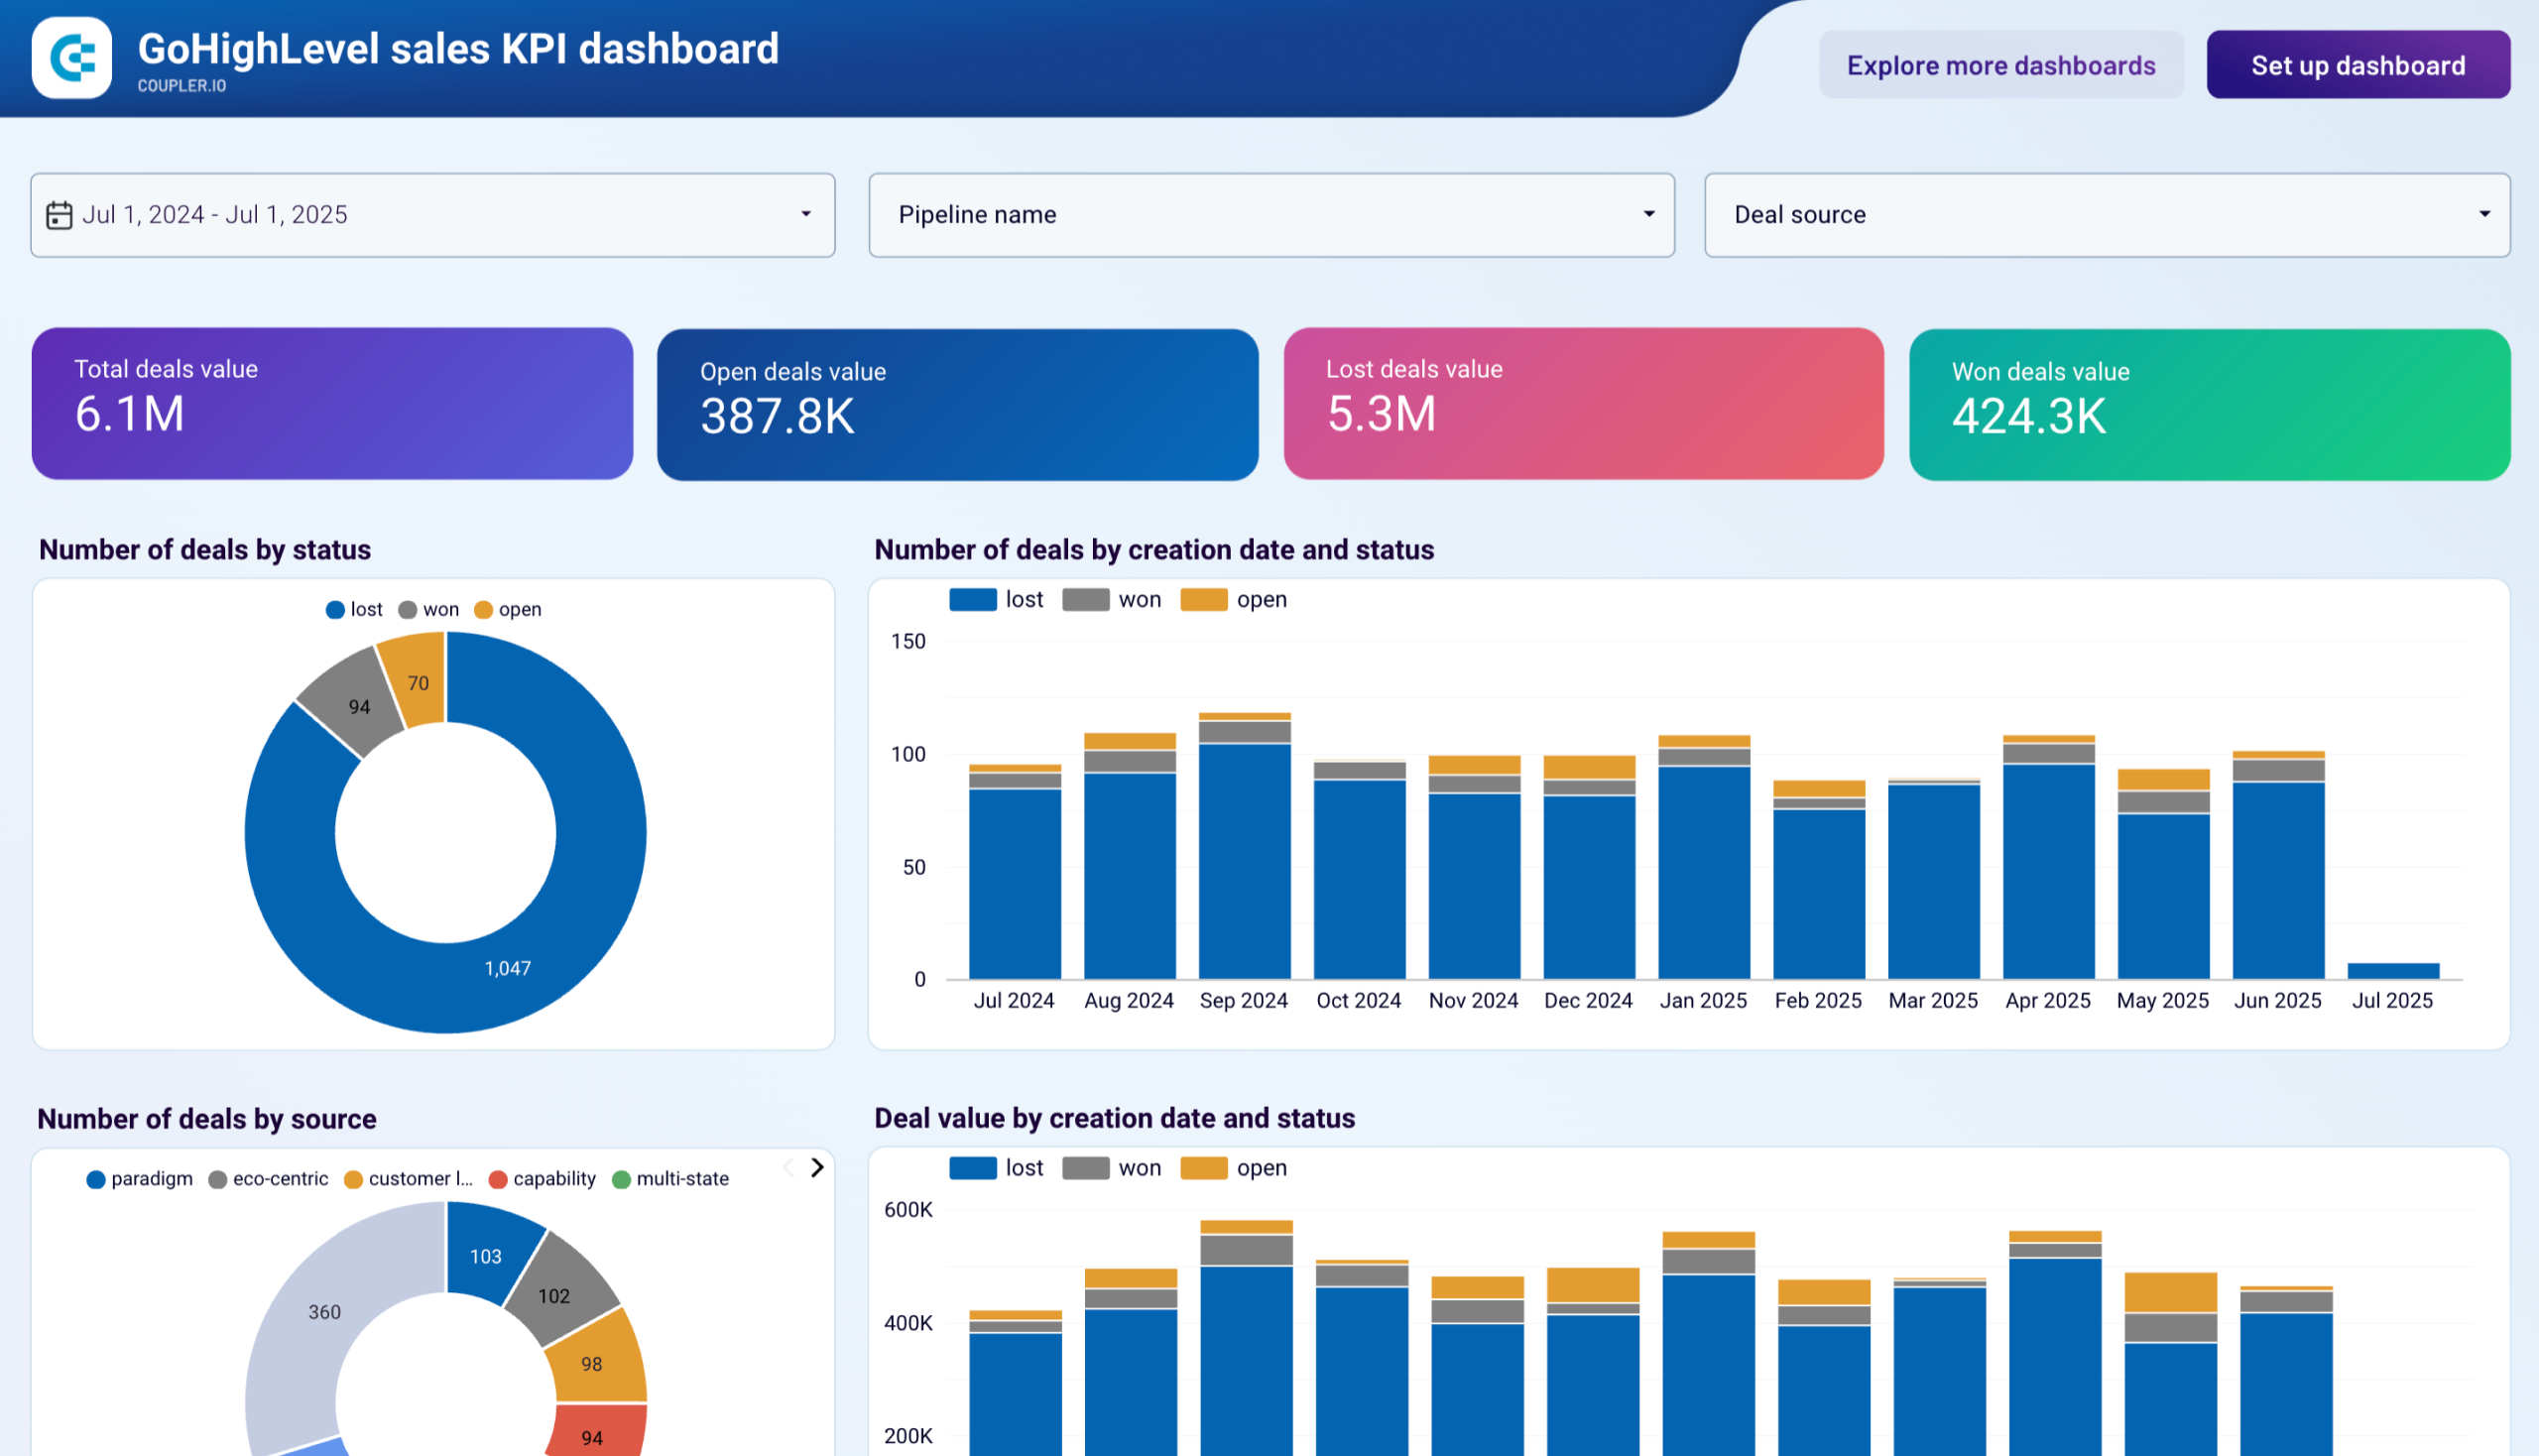
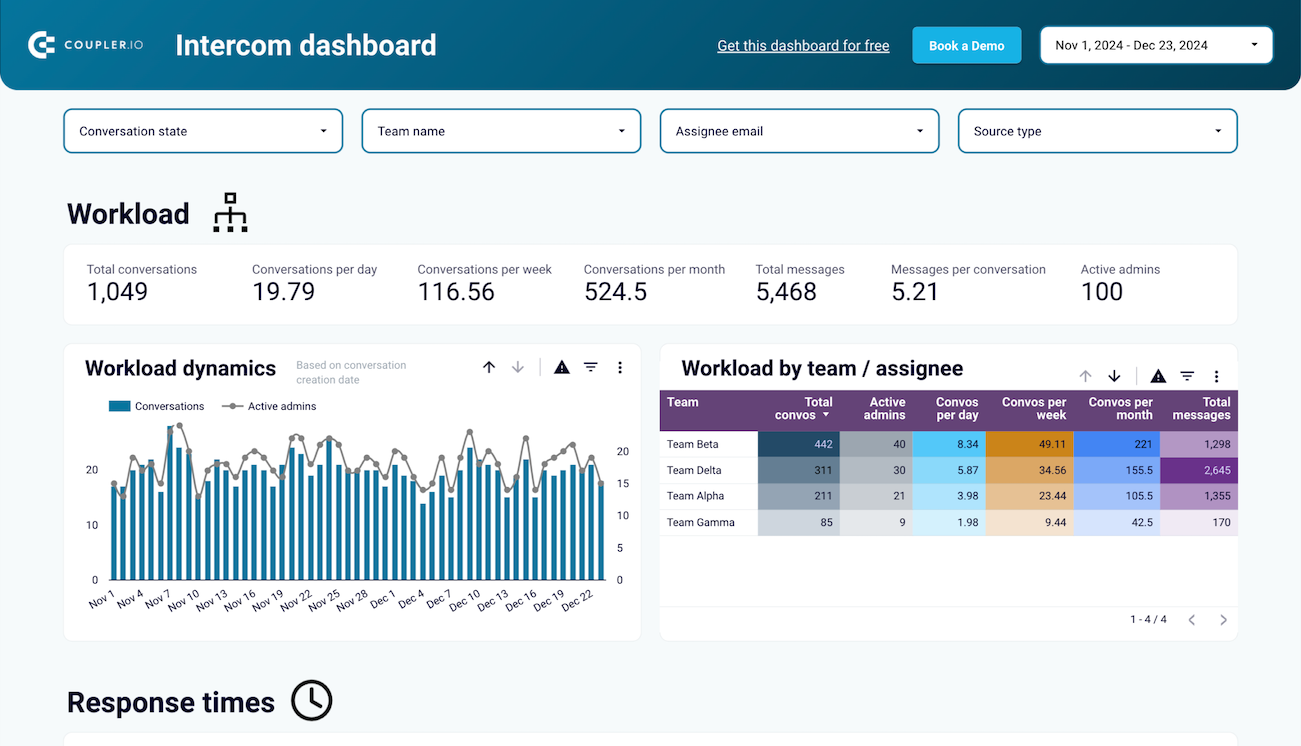
The dashboard templates for Pipedrive, GoHighLevel, Salesforce, and other CRM tools provide detailed breakdowns of opportunities by deal stage to assess pipeline distribution and movement. The dashboard reveals where deals concentrate in your sales process and where bottlenecks prevent progression to closed-won status. Owner comparison tables monitor individual sales rep performance through win rates, close rates, and time-to-close metrics, supporting informed decisions about deal assignment and coaching priorities. Trend visualizations correlate generated revenue with won opportunity counts and project future revenue based on opportunities in the pipeline. This comprehensive view helps sales leaders identify both process improvements and individual development needs that will accelerate revenue generation.

Identify conversion bottlenecks through visitor analysis
looker-studio-templates-4.png
Find this insight in the Web Analytics Dashboard template.

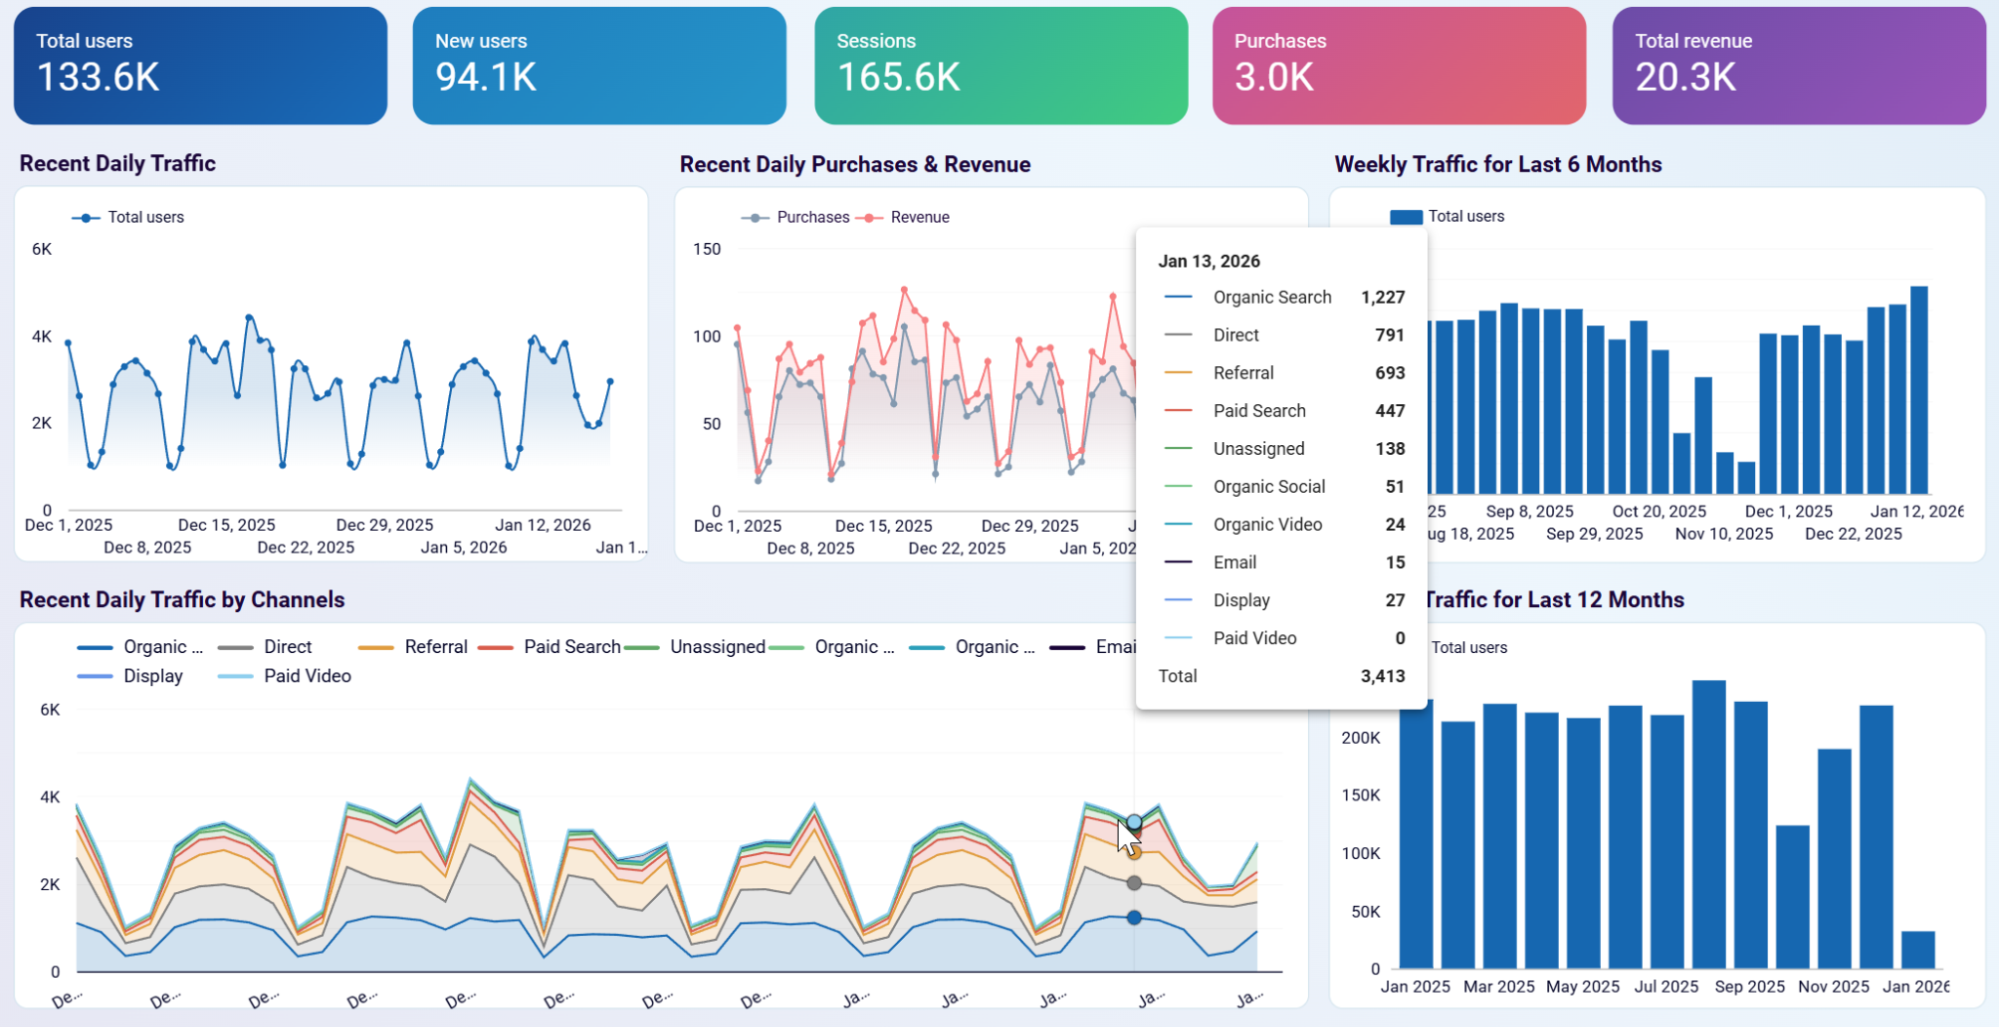
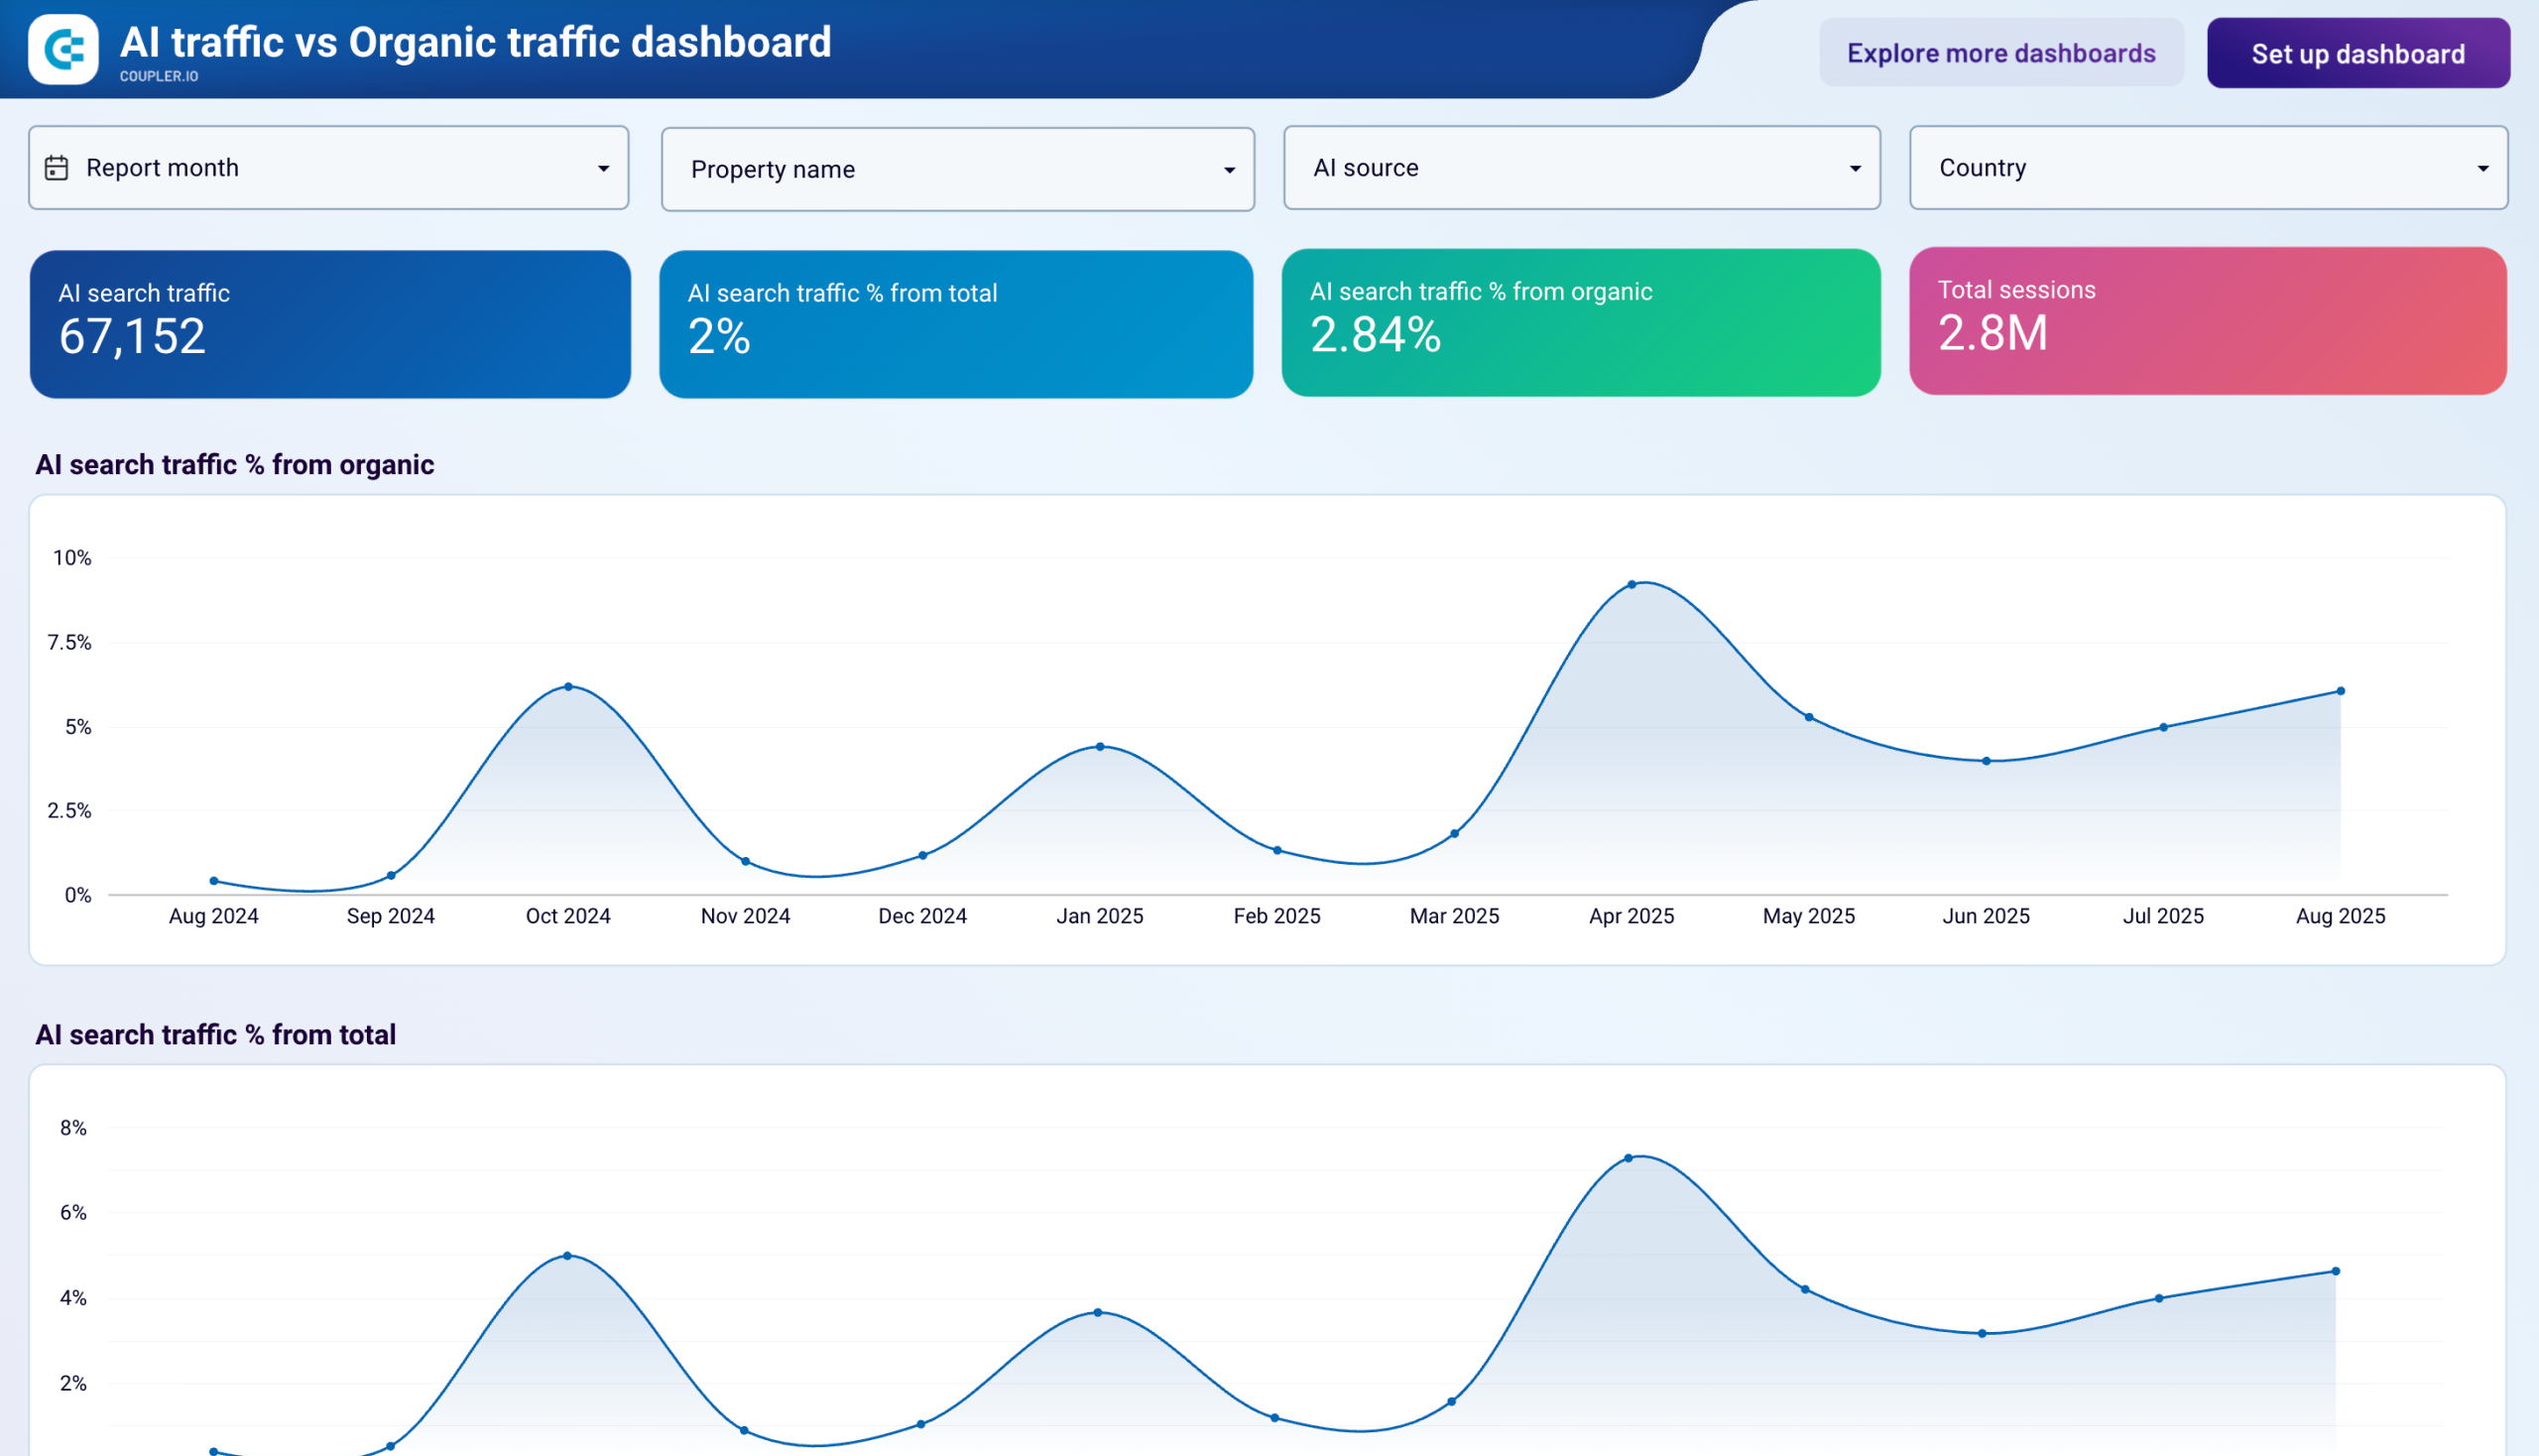
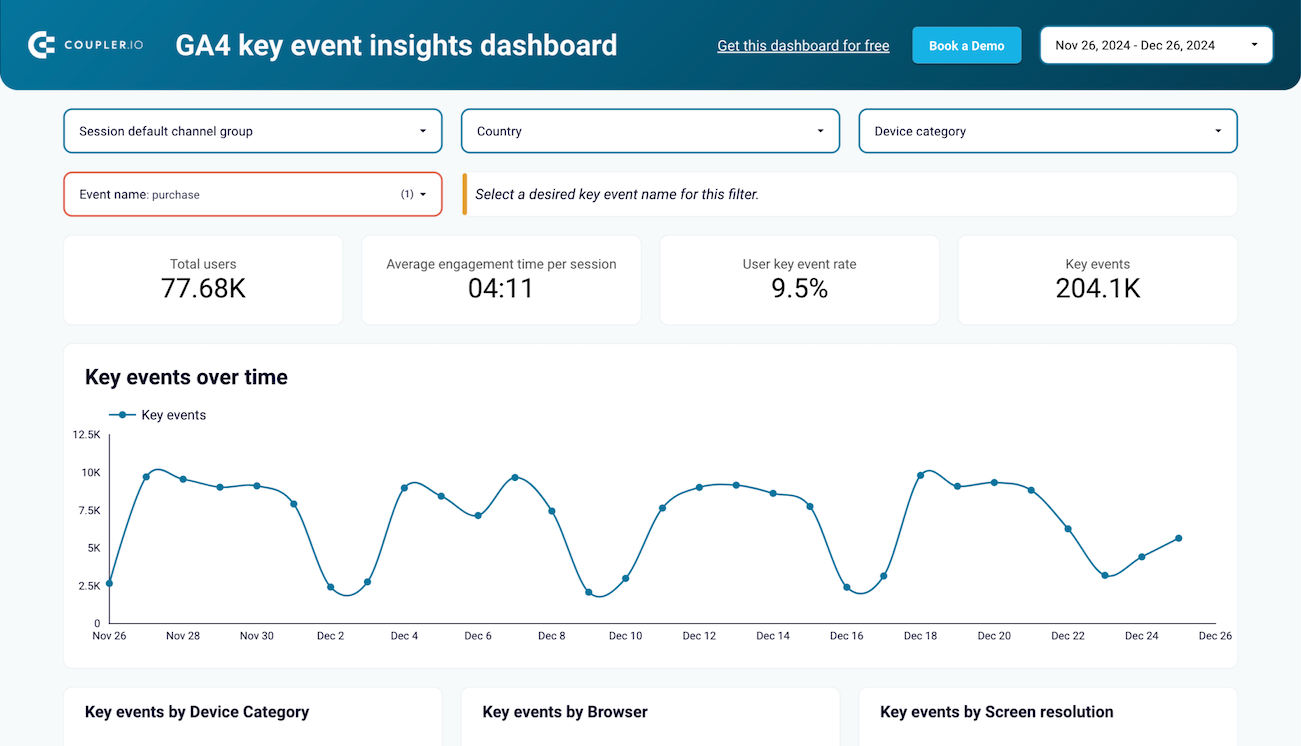
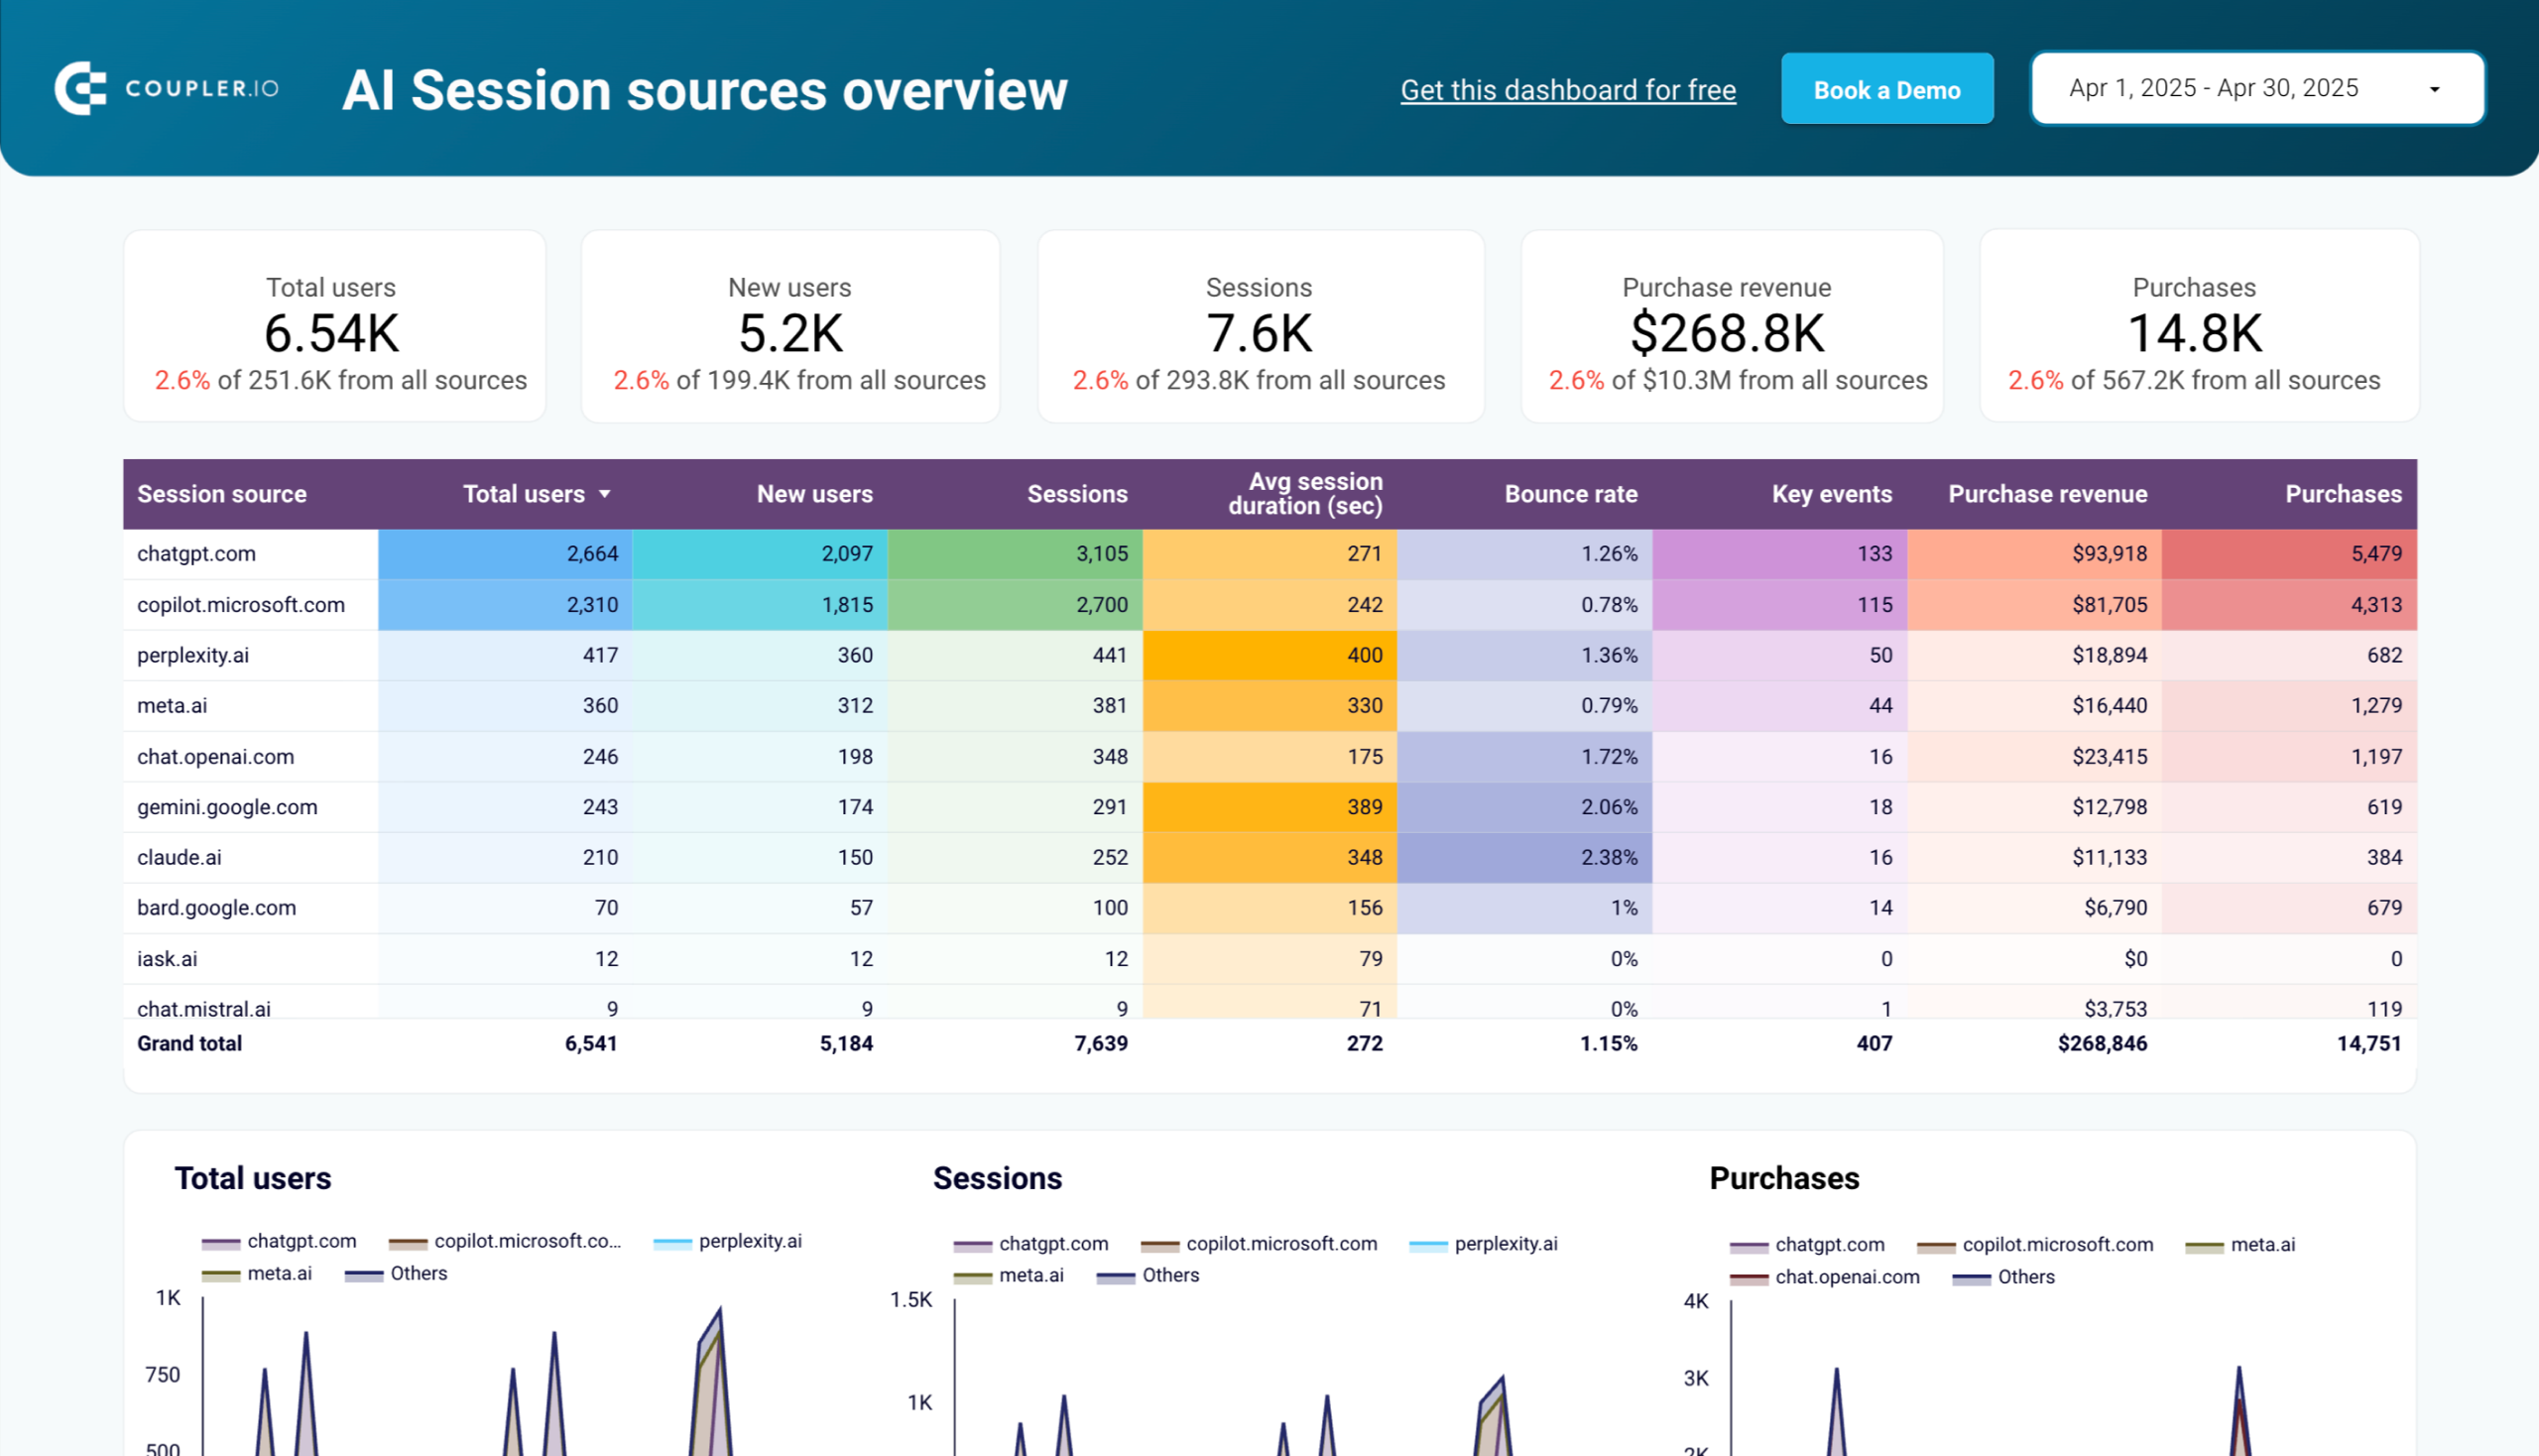
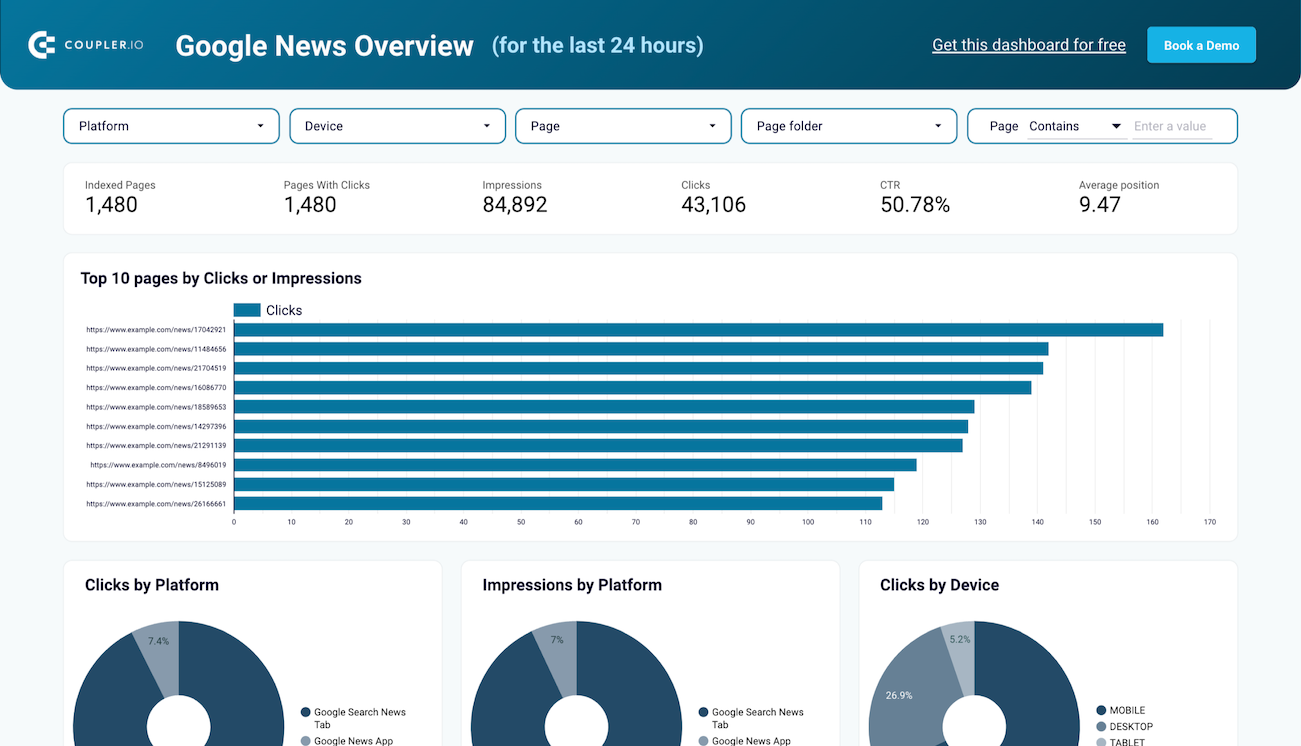
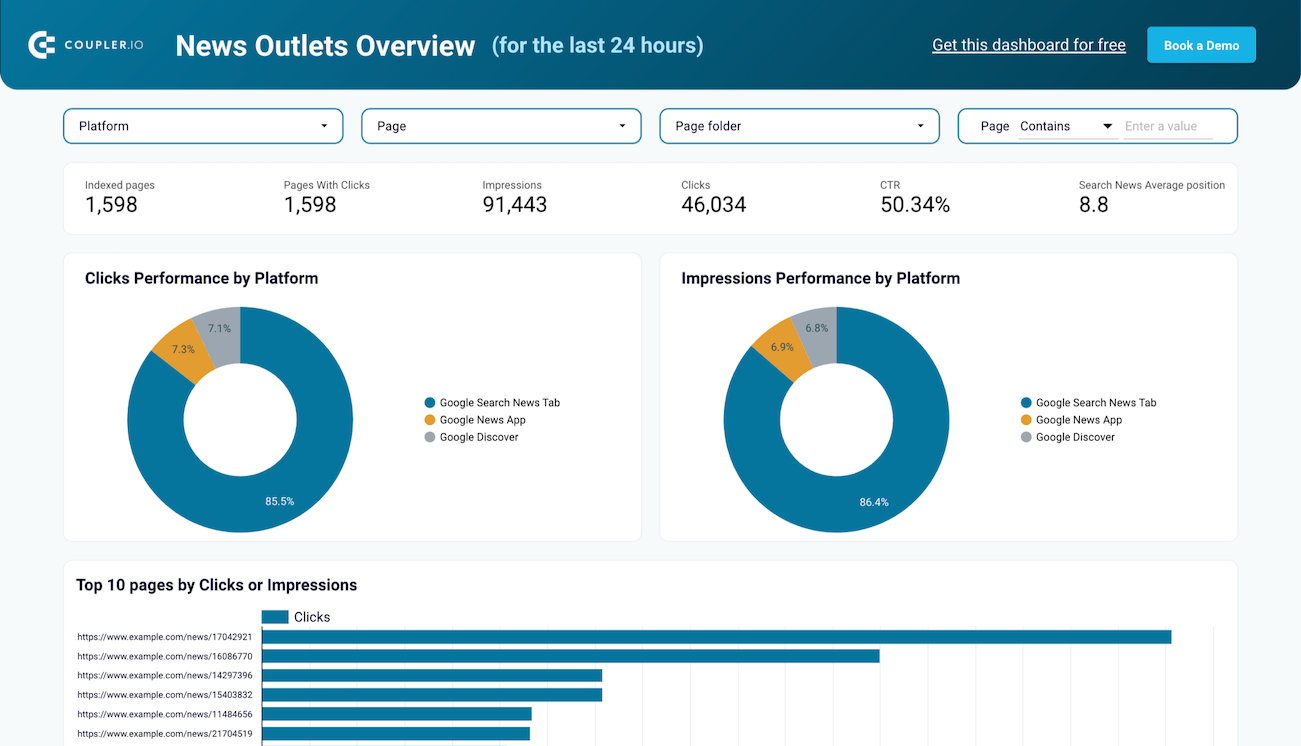
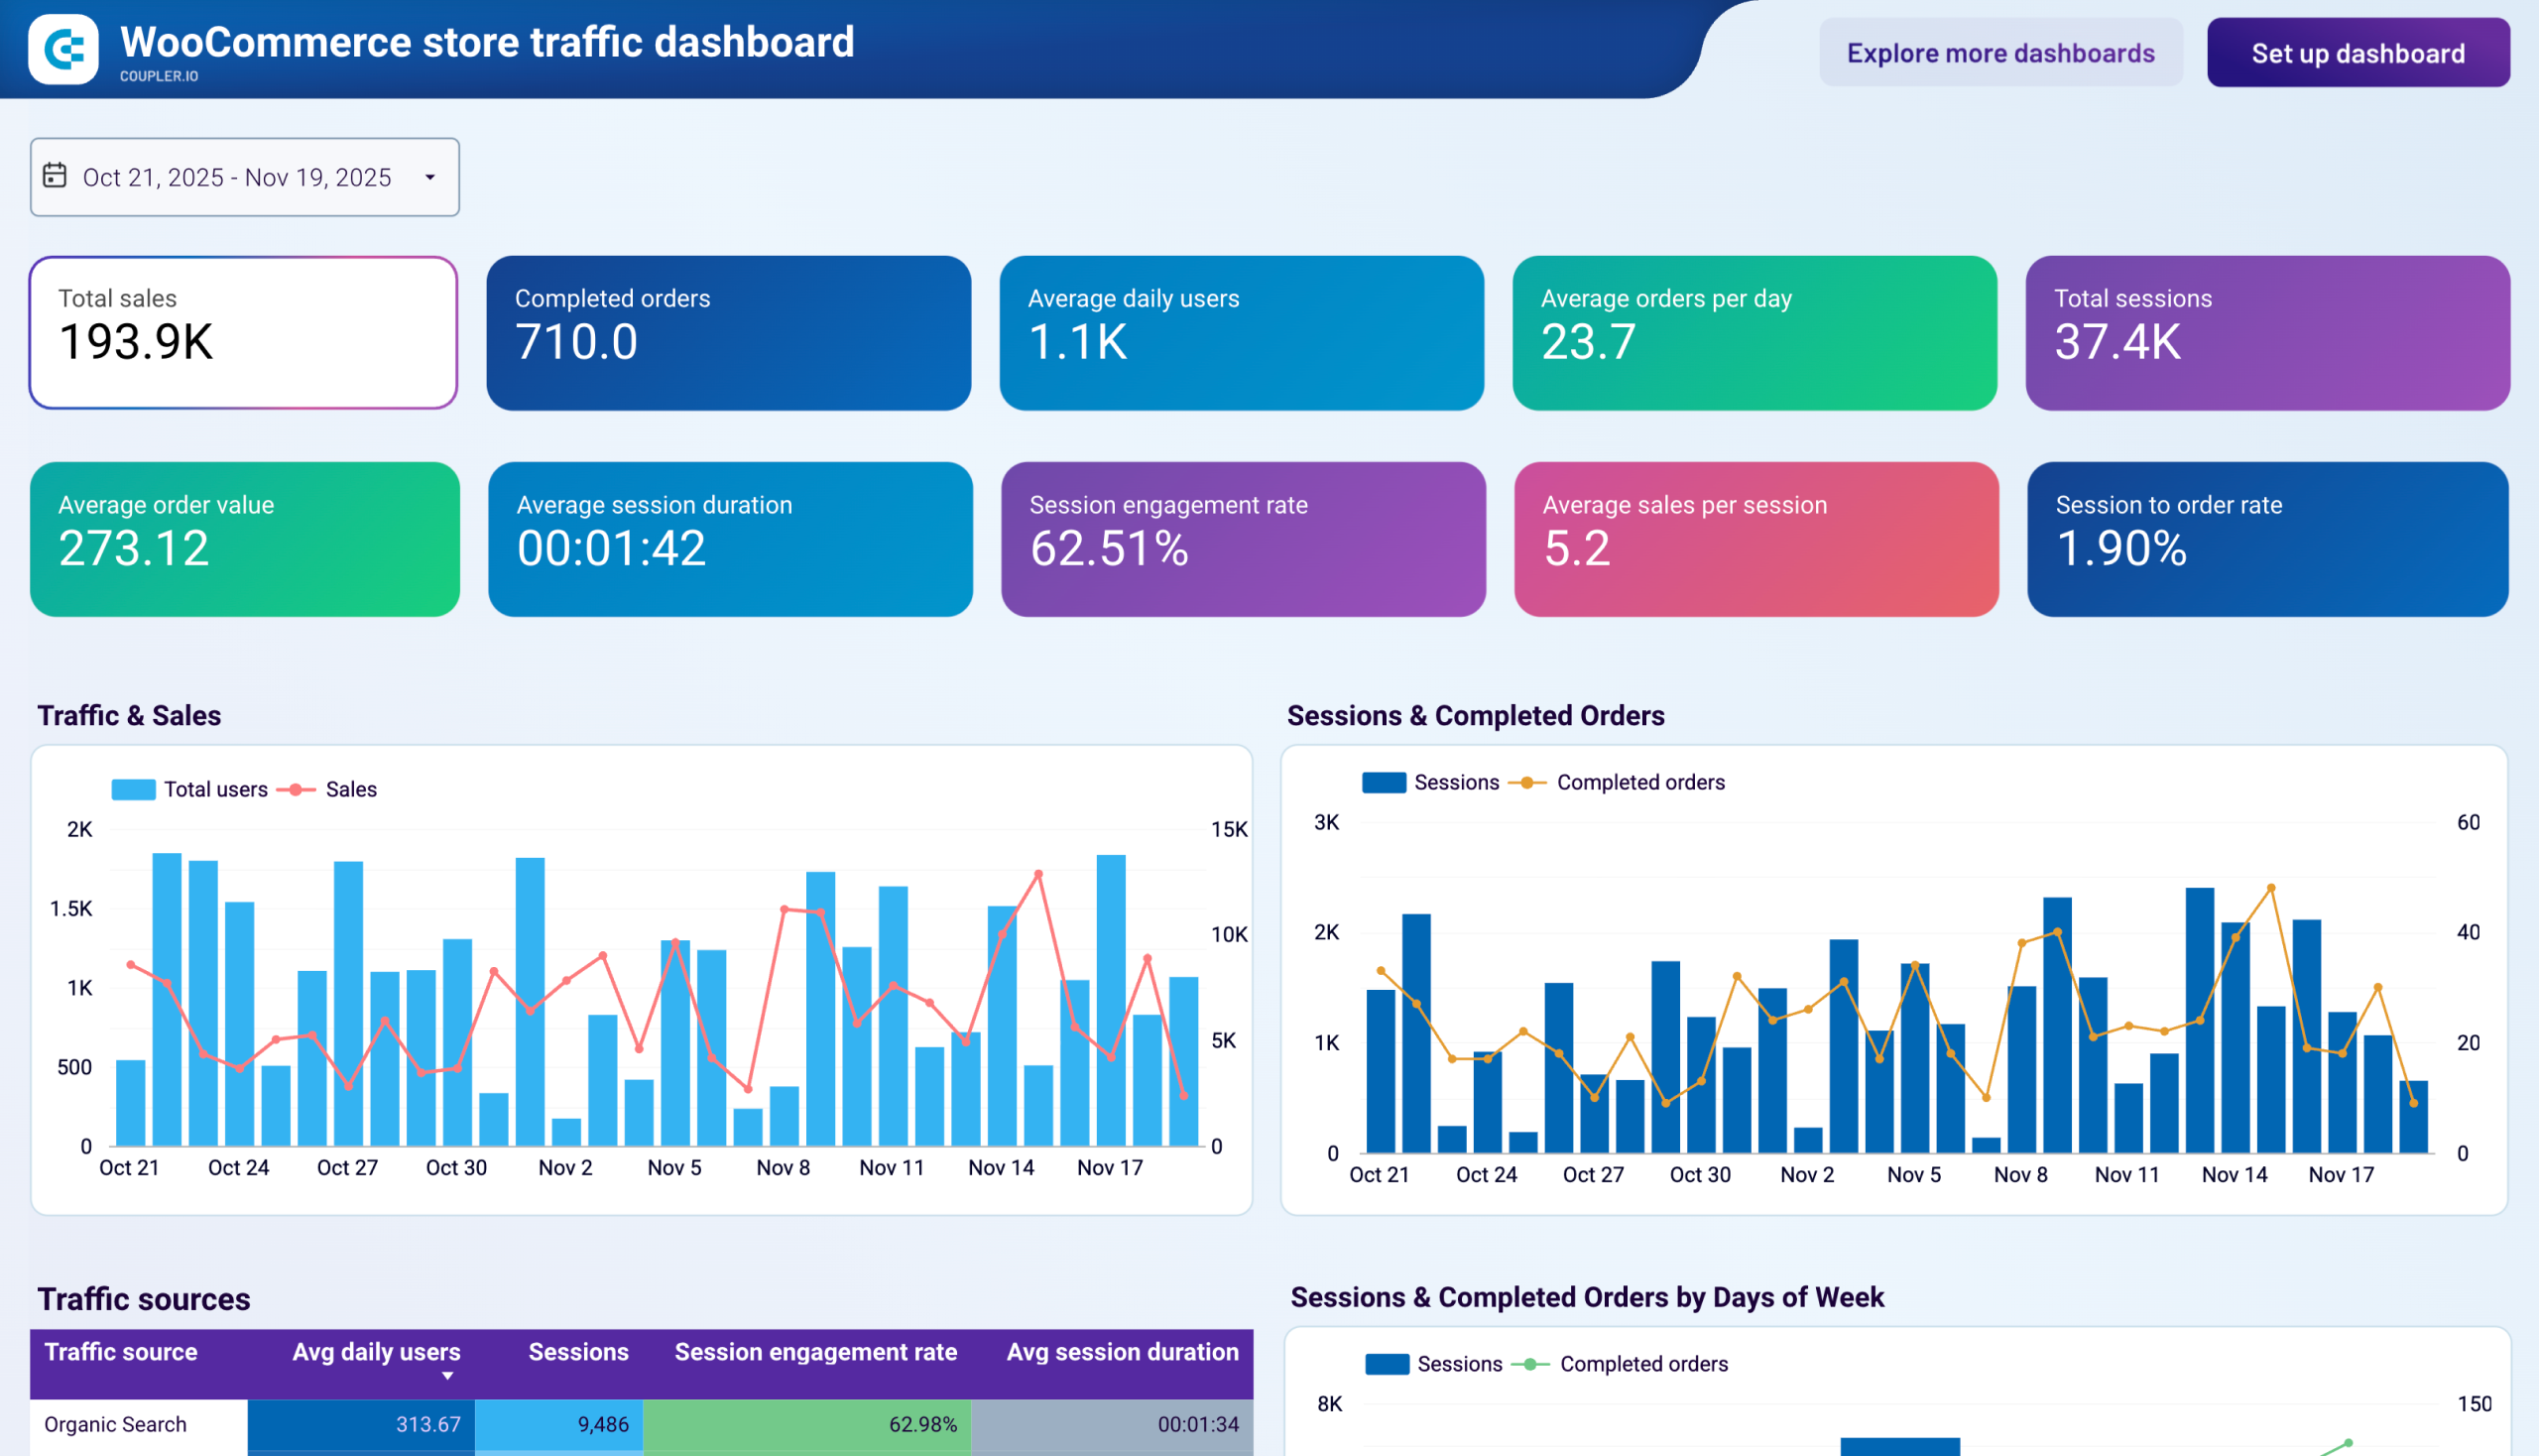
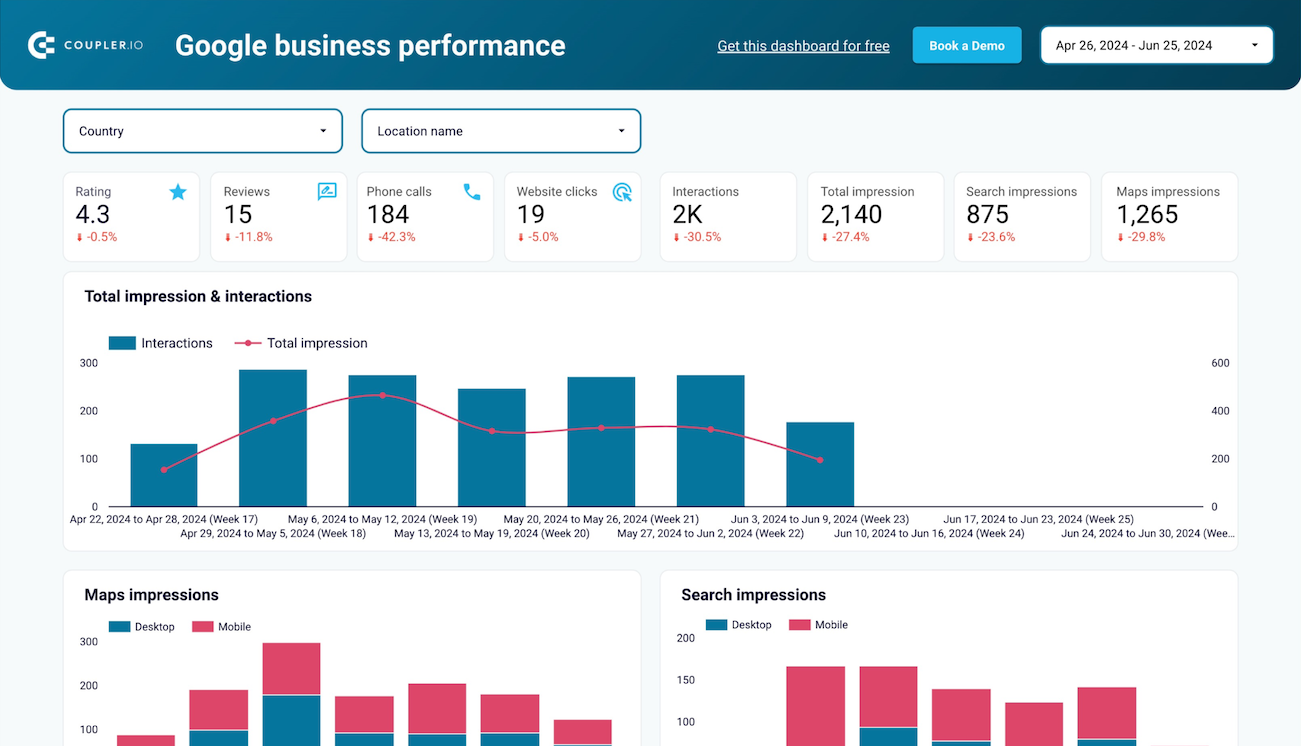
The web analytics template based on Google Analytics 4 provides daily updates on traffic growth, user acquisition sources, and engagement patterns. Acquisition reports identify which channels (organic search, social media, paid advertising, referral traffic) drive the most valuable visitors to your properties. Behavior analysis tracks engagement time per session, event counts, and views per user to understand how effectively your content holds attention. Conversion reports detail how users progress from initial visits to completed actions like purchases or form submissions. This integrated view of traffic sources, engagement quality, and conversion outcomes enables data-driven decisions about where to invest in customer acquisition and how to optimize the on-site experience for better results..

How to use a Looker Studio report template?

Step 1
1
Go to the Setup guide tab where you can see instructions on how to configure the template.
Step 2
2
Click the button to set up the Coupler.io connector for your data source accounts (advertising platforms, accounting software, CRM systems, or analytics tools).
Step 3
3
Follow the instructions to prepare and load data to your dashboard in Looker Studio.
Step 4
4
Go back to Coupler.io to configure the schedule for automatic data refresh of your reporting dashboard.
Steps Coupler.io image

Metrics you can track with the Google Looker Studio templates

Impressions

The total number of times your content, advertisements, or search results appeared on user screens. This reach metric shows how many potential customers encountered your brand message across channels. Track impressions alongside engagement metrics to assess whether high visibility translates into meaningful interactions or requires creative optimization.

Click-through rate (CTR)

The percentage of impressions that resulted in clicks and reveal how compelling your messaging is to audiences. High CTR indicates strong relevance between your creative and target audience, while low CTR suggests messaging misalignment. Analyze CTR across campaigns and creatives to identify which combinations drive engagement most effectively.

Cost per click (CPC)

The average amount paid each time someone clicks your advertisement or link. This efficiency metric evaluates whether your bidding strategies deliver cost-effective traffic. Compare CPC across platforms and campaigns to identify where you achieve the most affordable engagement and optimize budget allocation accordingly.

Conversion rate

The percentage of visitors or clicks that completed desired actions like purchases, form submissions, or downloads. This metric reveals how effectively your landing pages convince prospects to take action. Compare conversion rates across traffic sources to identify which combinations of targeting and design drive the strongest results.

Return on ad spend (ROAS)

The revenue generated for every dollar invested in advertising activities. This profitability metric connects marketing investment directly to business outcomes. Track ROAS across platforms and campaigns to identify which initiatives deserve increased investment and which require optimization or discontinuation.

Accounts receivable aging

The distribution of unpaid customer invoices across time periods, categorized as current, 1-30 days, 31-60 days, 61-90 days, and 91+ days overdue. This cash flow metric helps prioritize collection efforts by identifying which customers have the oldest outstanding balances requiring immediate attention and forecasting cash inflows.

Revenue by customer

The amount of income each customer contributes to your total revenue, presented as absolute dollar amounts and a percentage of total sales. This segmentation reveals customer concentration risk and identifies your most valuable relationships. Use these insights to inform account management priorities and marketing investments in retention versus acquisition.

Pipeline value by stage

The total dollar amount of sales opportunities at each stage of your sales process, from initial contact through closed-won. This forecasting metric provides visibility into future revenue potential and reveals where opportunities concentrate. Monitor stage values over time to set realistic revenue targets and identify process bottlenecks.

Session duration

The average time visitors spend on your website during a single visit, which indicates engagement level with your content. Longer durations typically suggest visitors find your content valuable, while short durations may indicate poor content fit. Compare session duration across traffic sources to understand which channels drive the most engaged visitors.

New user acquisition rate

The number of first-time visitors to your digital properties shows the effectiveness of efforts to expand your audience. This growth metric reveals whether your marketing successfully attracts new potential customers rather than simply re-engaging existing visitors. Track acquisition trends to assess whether your reach is expanding or contracting.

Use pre-built Looker Studio templates for your reporting