Connect TikTok Shop to Power BI
Route TikTok Shop orders, SKU performance, and shop reports into Microsoft Power BI through Coupler.io and build the reporting layer your business intelligence team can govern. Model dimensions, calculate KPIs in DAX, and let Power Query shape the pipeline. Refresh runs on schedule so Power BI dashboards always reflect current numbers.


What data you can export from TikTok Shop?
-
OrdersCustomer orders with details like products, pricing, payment status, and fulfillment information from your TikTok Shop
-
Orders with line itemsCustomer orders including detailed line item information such as product variants, quantities, and pricing breakdowns from your TikTok Shop
-
Products (with SKUs)Product details including titles, descriptions, prices, inventory levels, and other relevant information from your TikTok Shop
-
Shop performance reportPerformance metrics and reports related to your TikTok Shop, including sales data, traffic statistics, and customer engagement insights
-
Products performance reportPerformance metrics and reports related to your products on TikTok Shop, including sales figures, views, and conversion rates
-
SKU performance reportPerformance metrics and reports related to your product SKUs on TikTok Shop, including sales data, inventory levels, and customer engagement insights
All-in-one TikTok Shop Power BI connector for data exports and analytics
Combine TikTok Shop orders with TikTok Ads data, Google Ads, Shopify, and Google Sheets into one Power BI data model. Coupler.io functions as a data integration layer, so every data source lands in the same semantic layer for BI teams.

Reshape order fields, filter SKUs, and standardize dimensions before Coupler.io hands data to Power Query. Cleaner inputs let data modeling stay focused on relationships and DAX measures instead of upstream cleanup.

Keep Power BI dashboards in sync with TikTok Shop numbers through refresh intervals from monthly and daily to hourly, 30-minute, or 15-minute. Coupler.io runs the data pipeline so dataflows stay stocked without manual pulls.

Ask about conversions, ad spend, or shipping fee patterns in your TikTok Shop data through plain language. Coupler.io routes the same dataset to AI tools, so questions get answered without opening Power BI Desktop or building a new DAX measure.

Why export TikTok Shop data to Power BI - real life cases

Model orders alongside ad performance for full-funnel BI

Build interactive dashboards with drill-down for leadership

Track KPIs against marketing strategy targets

Consolidate ecommerce reporting across shops and warehouses
How to connect TikTok Shop to Power BI
 30 seconds
30 seconds
10 seconds
30 seconds
30 seconds
30 seconds
10 seconds
Automate data exports with the no-code TikTok Shop Power BI integration
Connect similar Ecommerce apps and get data in minutes



Quick start with dashboard templates
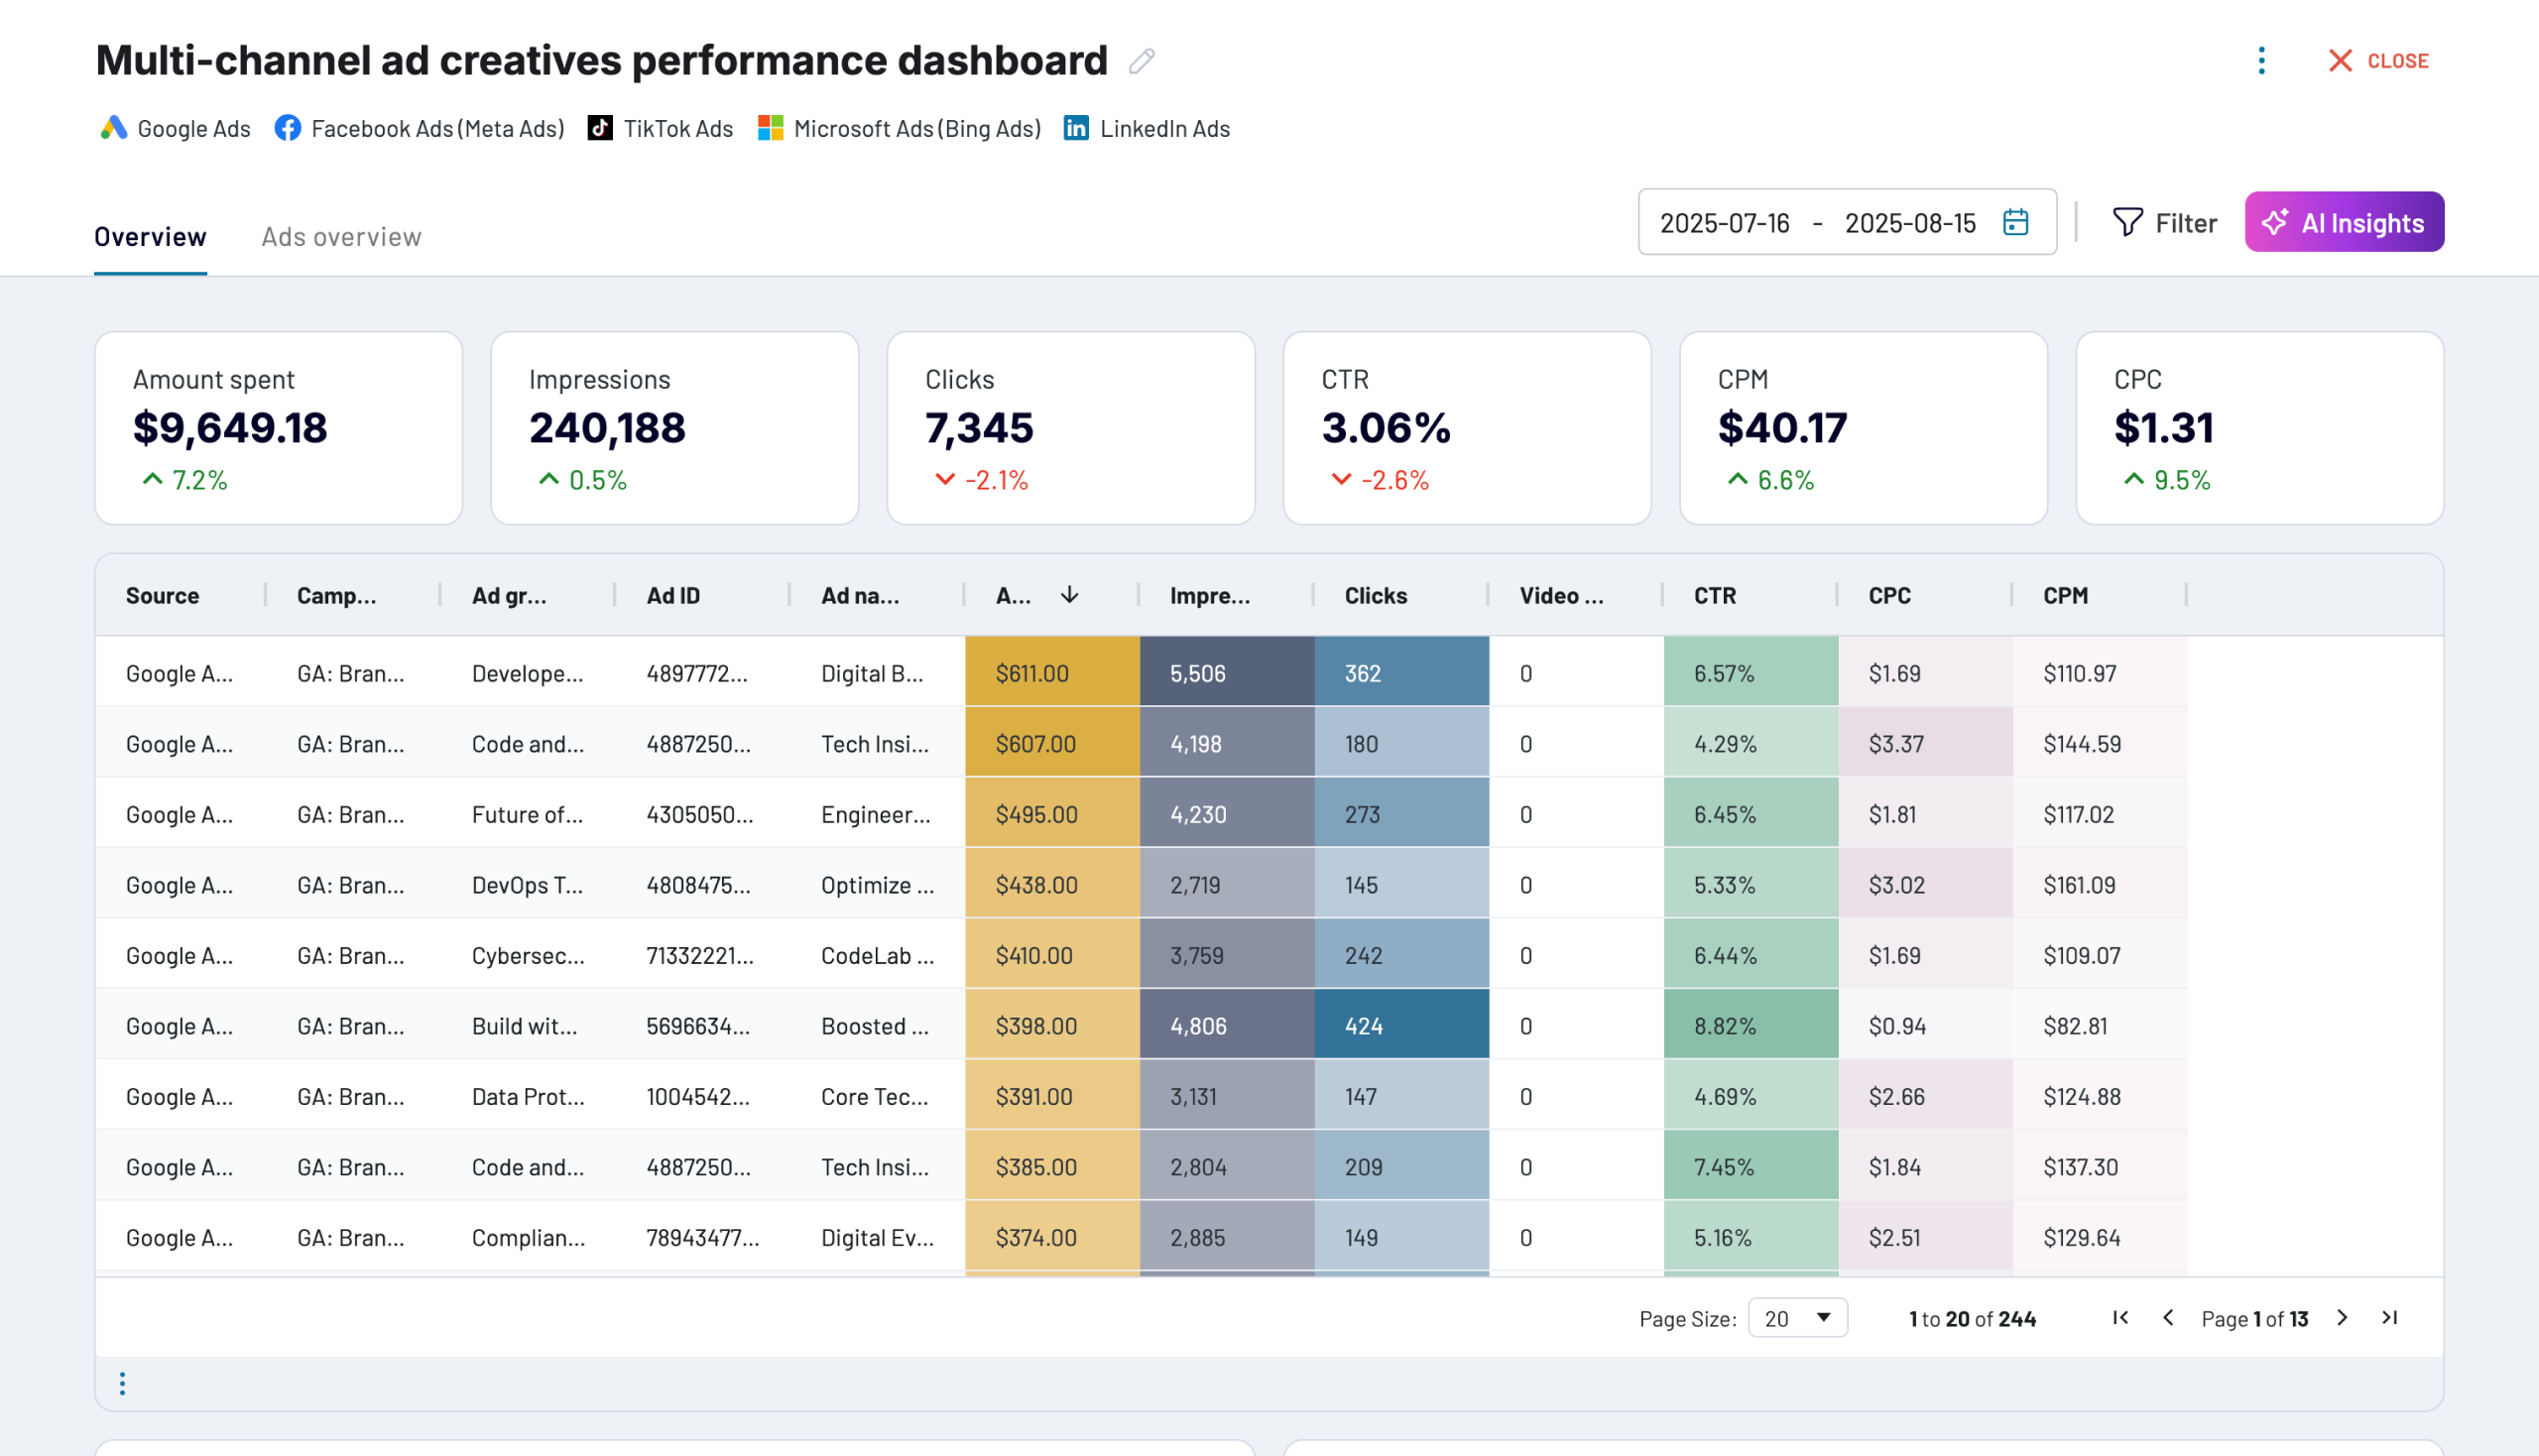


 +0
+0


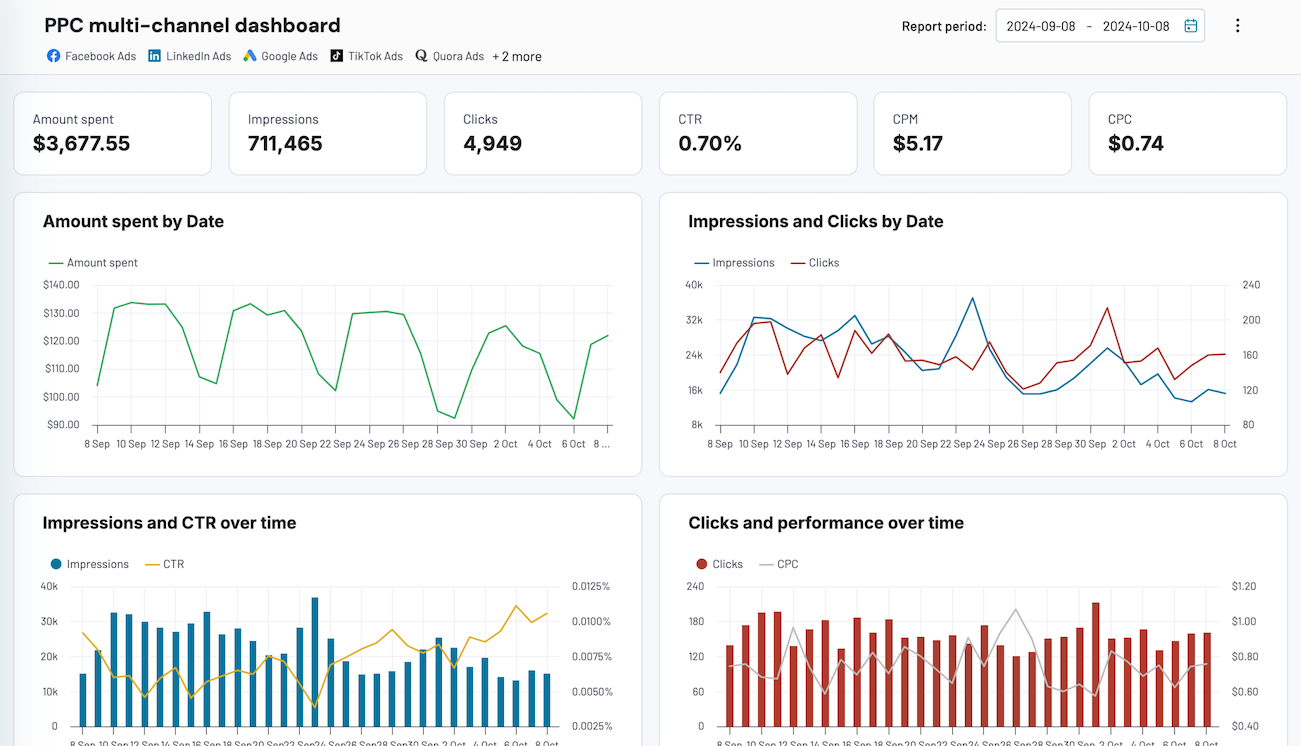


 +4
+4
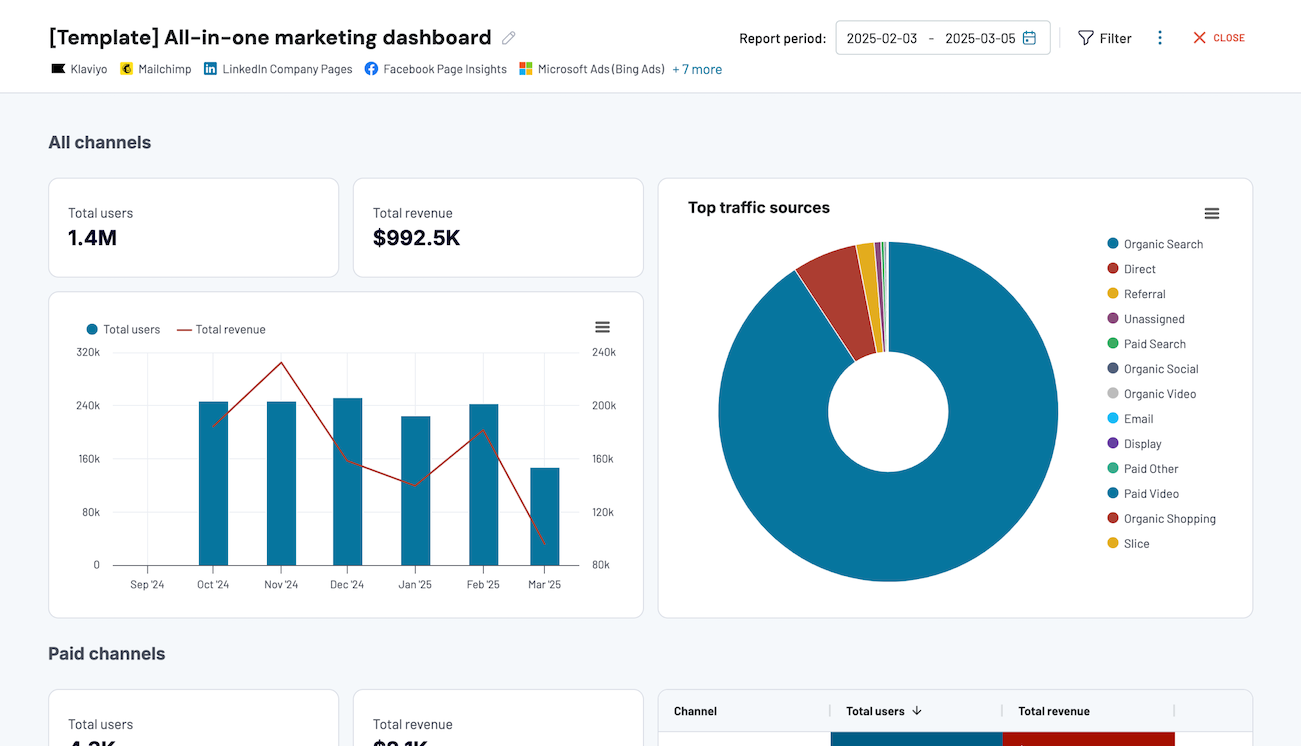


 +7
+7
about your case. It doesn't cost you a penny 😉
Talk to AI about your TikTok Shop data
Coupler.io's AI Agent does more than answer questions. Tell it what you need, like a weekly TikTok Shop summary or a comparison across periods, and it guides the data flow setup. The Analytical Engine runs the numbers and validates every result.
Ask questions like:
- "Which SKUs delivered the highest conversion rate this quarter, and how did ad spend against them compare across TikTok and Google?"
- "Break down refunds by product category and rank the top drivers by lost revenue over the last 90 days."
- "Which shipping fee bands correlate with higher cart abandonment across our top-selling SKUs?"
- "Compare video views on paid content against actual TikTok Shop orders and flag creative that punches above or below its click share."

Customer success stories


Your data is secured by industry standards
 SOC 2 Type II
Certified
 Google Cloud
Certified
 GDPR
GDPRCompliant
 HIPAA
HIPAACompliant
Export data from TikTok Shop to alternative destinations