Connect Shopify to Power BI with Coupler.io to simplify reporting
Get and prepare data effortlessly
Export Shopify to Power BI without any experience in coding. Take advantage of various data transformation options, set up a schedule for automated report updates, and combine records exported from multiple sources within a single web app.
Automate reporting tasks
Thanks to Coupler.io, you can automate data imports from Shopify to Power BI in minutes. Minimize copying and pasting tasks to focus on strategic decision-making and have your data visualized through dynamic dashboards with our free templates.
Stand out as a data-driven expert
Demonstrate your proficiency to clients and stakeholders with the help of timely, insightful reports. Now, you can leave manual reporting activities to Coupler.io and clear your schedule for tasks that truly make a difference to your business.
Export data from Shopify to alternative destinations
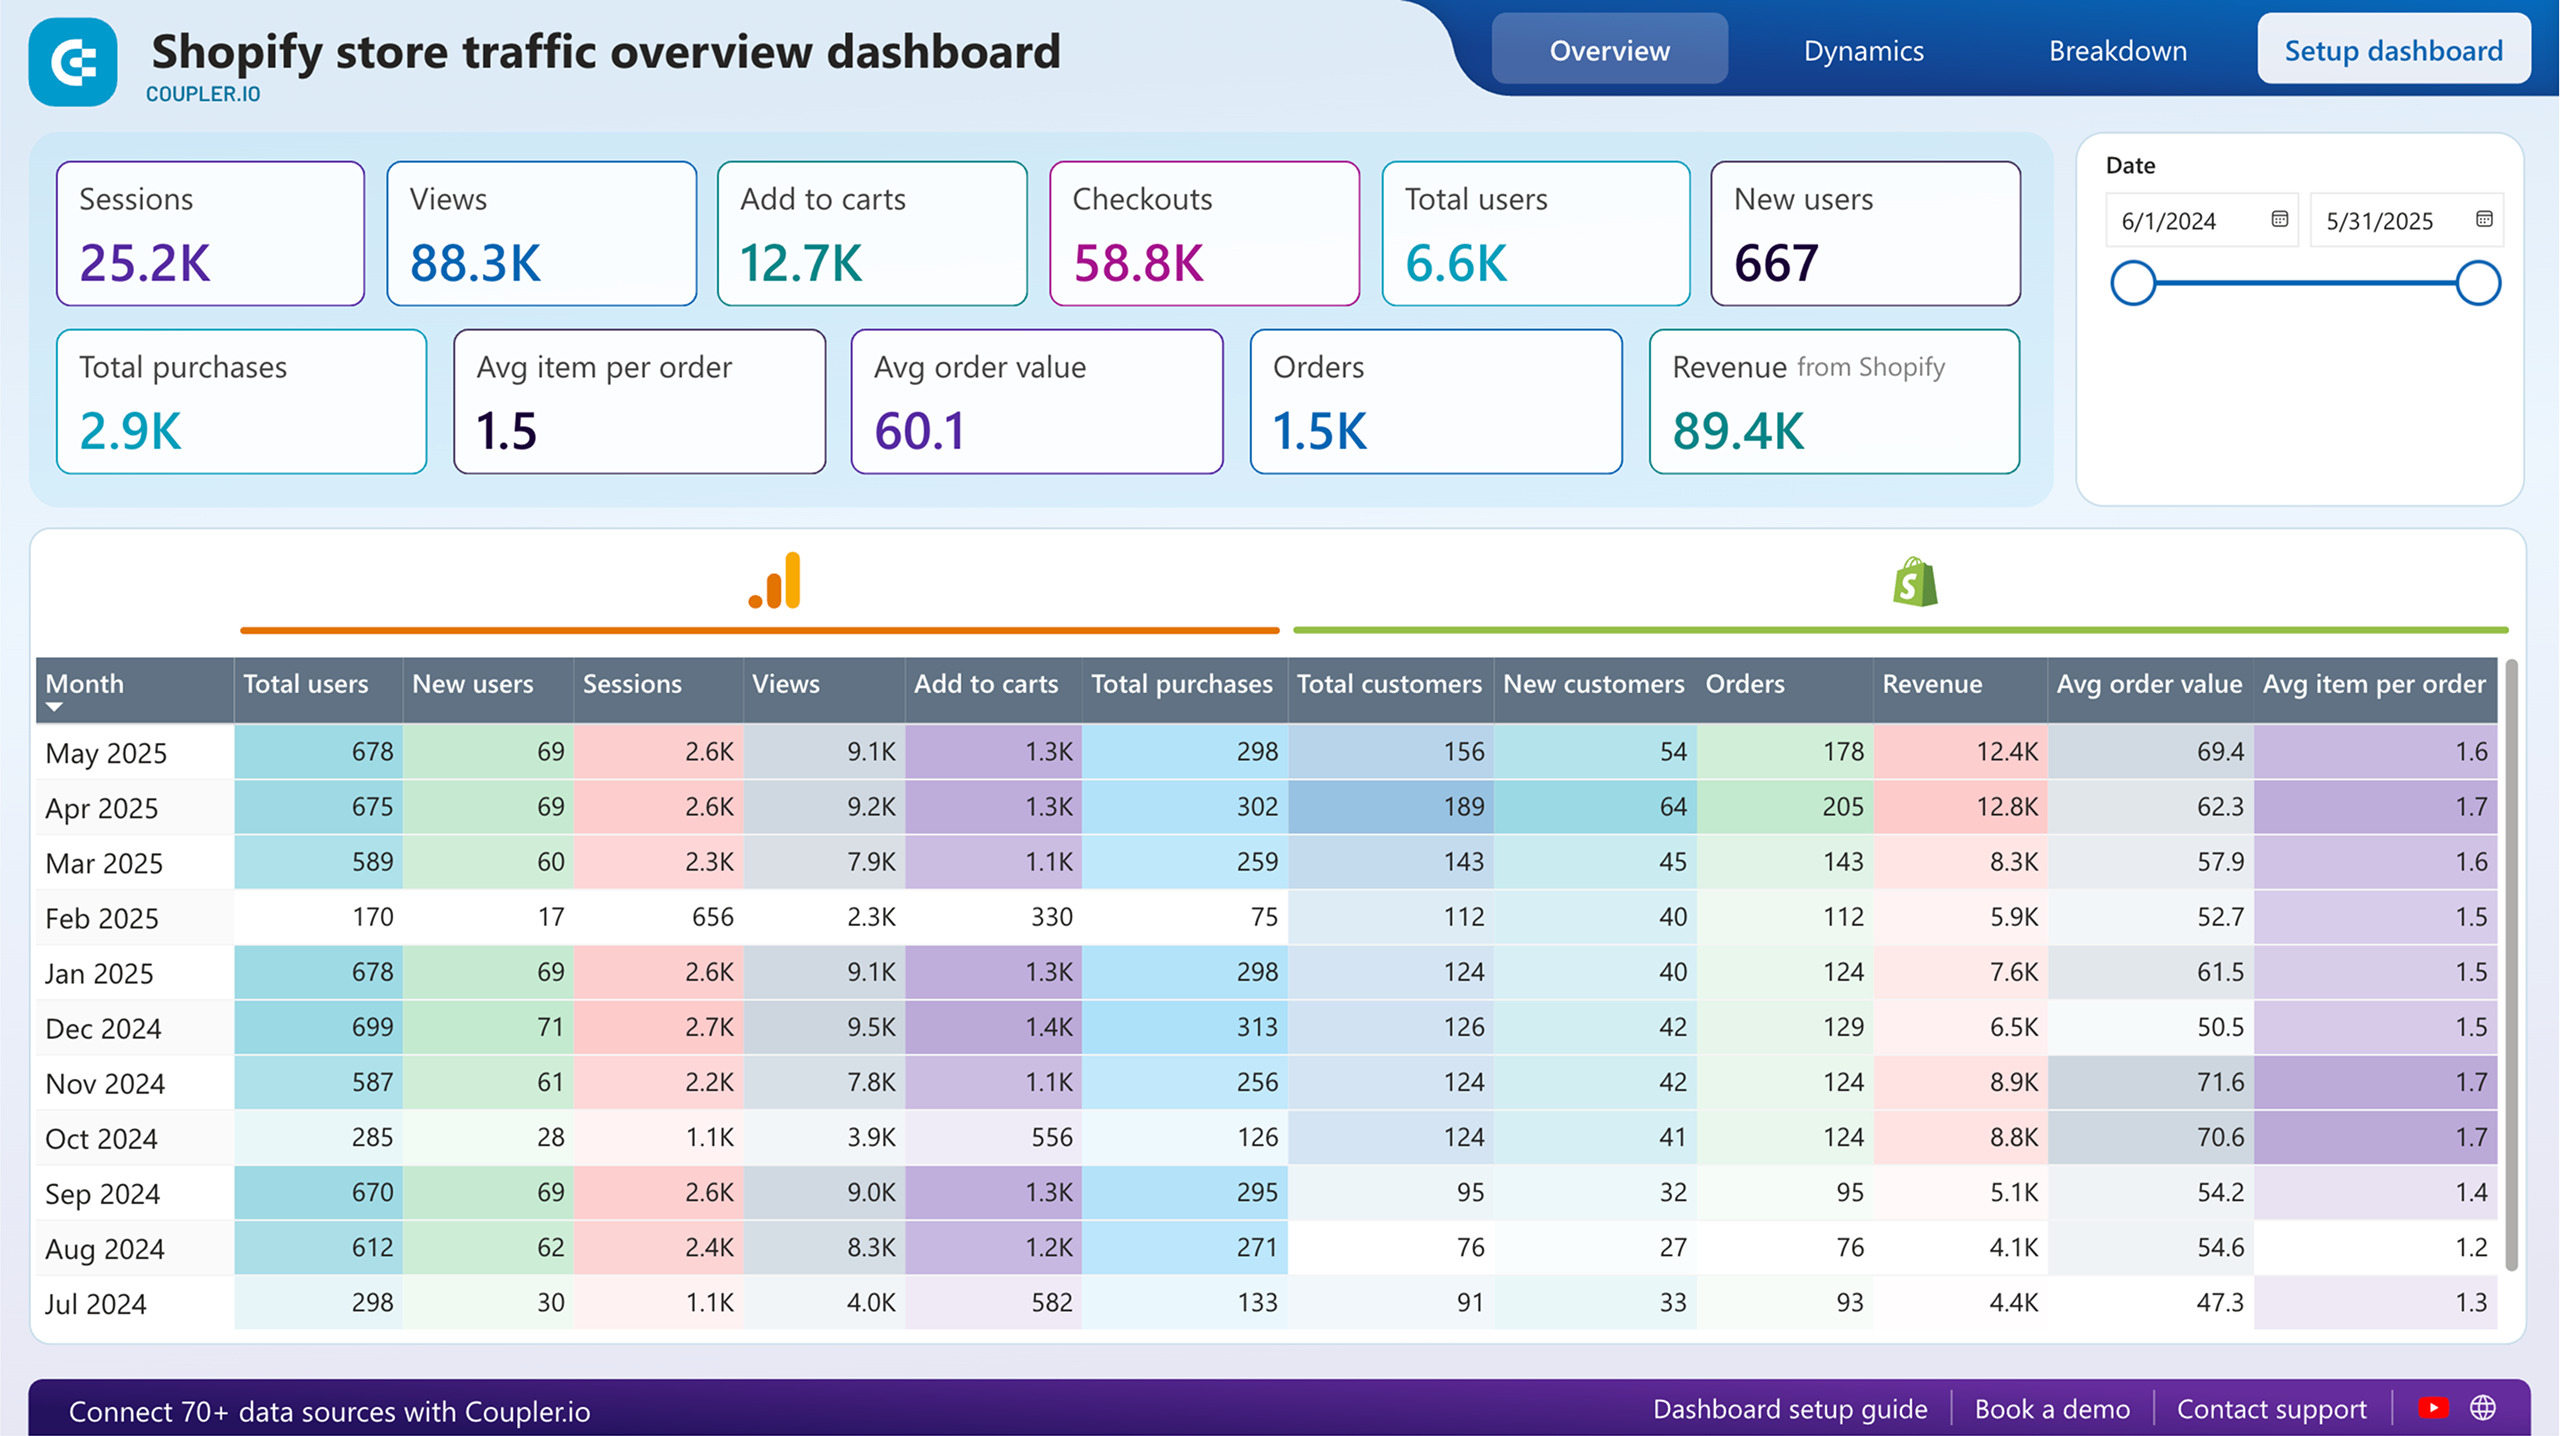
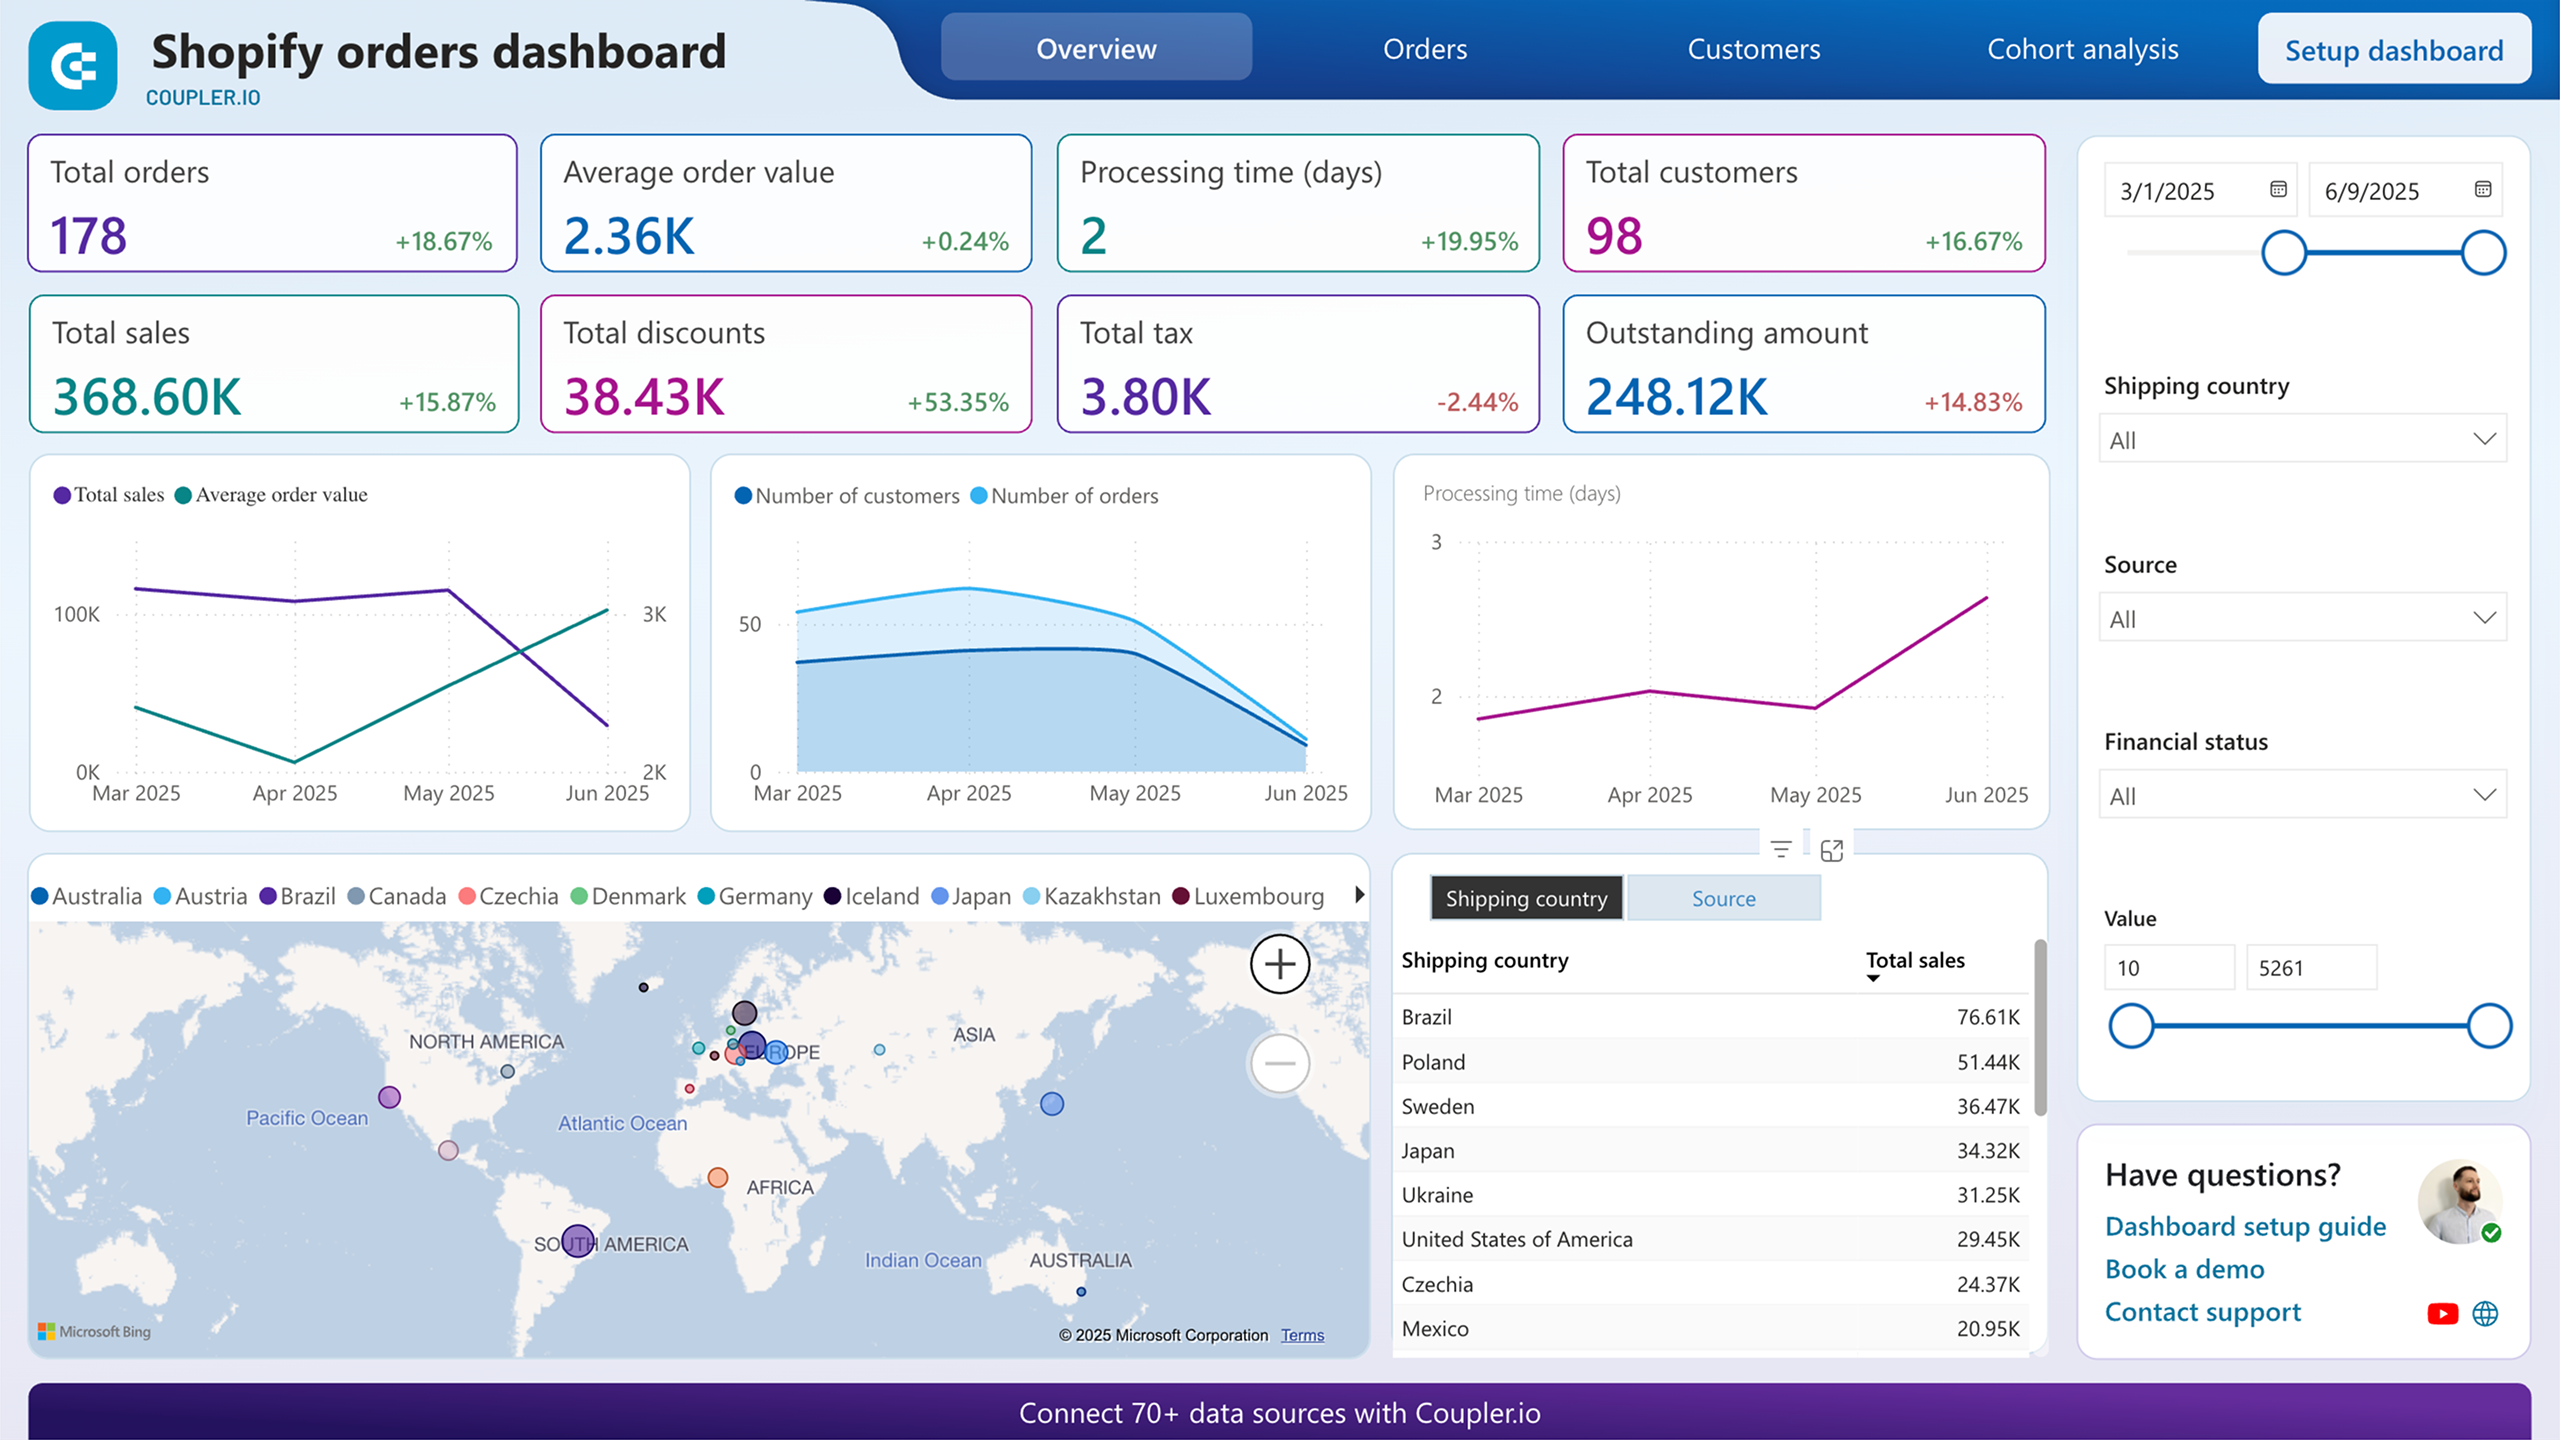
Quick start with Ecommerce dashboard templates
No such template is available yet.
No worries. Our team will create a template that fits your needs, just tell us more
about your case. It doesn't cost you a penny 😉
Request a custom report
about your case. It doesn't cost you a penny 😉
Export Shopify to Power BI automatically with just a few clicks.
Connect similar Ecommerce apps and get data in minutes
What to export from Shopify to Power BI
Customers
Shopify's customer data encompasses vital information about your customer base, including demographics, purchasing behaviors, and contact details. Understanding this data is helpful in targeting your marketing efforts, creating personalized customer experiences, and improving customer retention strategies.
Inventory
You can also connect Shopify to Power BI to load inventory data, which is useful for tracking stock levels, monitoring product availability, and optimizing inventory management. This data covers details like SKU, quantity on hand, stock status, and product variants for informed decisions about restocking and product promotions.
Products
Product data gives insights into your merchandise catalog, including product attributes, categories, prices, and descriptions. Analysis of product performance metrics like sales volume, revenue generated, and popularity will help you identify top-selling items, optimize product assortment, and enhance overall sales strategies.
Orders
By exporting Shopify's order data, you can monitor sales trends, track revenue generation, and evaluate transactional metrics such as order status, payment methods, and fulfillment details. Analyzе this information to identify sales patterns, forecast future demand, and take order processing efficiency to the next level.
Orders with line items
This data category focuses on detailed line item information within orders, including product IDs, quantities, prices, and discounts. By looking at data regarding orders with line items, you can see the bigger picture of product-level sales performance, customer purchase behavior, and cross-selling opportunities available.
Orders with shipping lines
Another reason to export Shopify to Power BI is the data of orders with shipping lines. It provides visibility into shipping methods, carrier information, tracking numbers, and shipping costs associated with each order. Use it to optimize fulfillment processes, minimize shipping expenses, and boost customer satisfaction through timely delivery.
Orders refund transactions
Refund transaction data exported from Shopify allows you to track and analyze refund activities, including reasons for refunds, refund amounts, and refund methods. Knowledge of refund trends is crucial to detecting product issues, elevating customer service processes, and minimizing revenue loss due to returns.
Orders with refunded items
Load this kind of data from Shopify to Power BI and build a report on orders containing refunded items. It may comprise refunded product details, quantities, and refund reasons. This information ensures you a clear grasp of product quality issues, customer satisfaction levels, and opportunities for product improvements or replacements.
How do you export Shopify to Power BI?
Step 1. Connect your Shopify account and choose a data entity to export
Step 2. Organize and transform data before loading it to Power BI
Step 3. Connect the Power BI account and copy the integration URL to the desktop app
Step 4. Schedule auto-refreshes to export Shopify to Power BI at desired intervals
Pricing plans
- Monthly
- Annual (save 25%)
Keep your data safe
Coupler.io safeguards your shared information and data transfers from breaches, leaks, and unauthorized disclosures.

How to export Shopify to Power BI (detailed guide)
Connect Shopify to Power BI in just a few steps:
Step 1: Collect data
First, connect your Shopify account. Next, select the Data entity – the particular data type you will export.
Depending on the chosen data entity, adjust the other mandatory settings if there are any. After that, click Finish and proceed, and then press Transformations to move on.
Step 2: Organize and transform
Before importing Shopify to Power BI, check the data for accuracy. If you like, make any of the following transformations to your dataset:
This way, you can get your data ready for further reporting and analysis.
As soon as you're done with this step, click Destinations.
Step 3: Load and automate
To finally load your data from Shopify to Power BI, take note of the in-app instructions to generate the integration URL and paste it into the Power BI desktop app.
Click Setup a schedule to turn on the Automatic data refresh and select the interval you're comfortable with. Lastly, click Save and run importer.
Step 1: Collect data
First, connect your Shopify account. Next, select the Data entity – the particular data type you will export.

Depending on the chosen data entity, adjust the other mandatory settings if there are any. After that, click Finish and proceed, and then press Transformations to move on.
Step 2: Organize and transform
Before importing Shopify to Power BI, check the data for accuracy. If you like, make any of the following transformations to your dataset:
- Edit, rearrange, hide, or add columns.
- Apply various filters and sort your data.
- Create new columns with custom formulas.
- Combine data from multiple accounts or apps.
This way, you can get your data ready for further reporting and analysis.

As soon as you're done with this step, click Destinations.
Step 3: Load and automate
To finally load your data from Shopify to Power BI, take note of the in-app instructions to generate the integration URL and paste it into the Power BI desktop app.

Click Setup a schedule to turn on the Automatic data refresh and select the interval you're comfortable with. Lastly, click Save and run importer.
Connect Shopify to Power BI and import data on schedule
By activating automated data refreshes, you make your Power BI report constantly updating. To customize your experience using this feature, specify the desired frequency of report updates. You can set it up to occur monthly, daily, hourly, or every 30 or 15 minutes. For maximum customization, select the preferred days of the week, hours, and time zone.
With this feature, rest assured your report always provides data that reflects the latest changes to the source.

With this feature, rest assured your report always provides data that reflects the latest changes to the source.
What key metrics can you export from Shopify to Power BI?
Total orders
Description: Total orders represent the overall number of orders placed by customers within a specific period.
How to calculate: Count all individual orders made by customers during the defined timeframe.
Total sales
Description: Total sales indicate the overall revenue generated from product sales over a certain period.
How to calculate: Sum up the prices of all orders, excluding taxes and discounts, made by customers during the defined timeframe.
Total tax
Description: Total tax is the sum of all taxes collected on sales transactions within a particular period.
How to calculate: Add up the tax amounts applied to each order made by customers during the defined timeframe.
Total discounts
Description: Total discounts represent the aggregate amount reduced from the total sales due to promotional offers, coupons, or discounts within a specific period.
How to calculate: Sum up the discounts applied to each order made by customers during the defined timeframe.
Average order value
Description: Average order value is the average amount spent by customers per order over a certain period.
How to calculate: Divide the total sales by the total number of orders during the defined timeframe.
Processing time (days)
Description: Processing time is the average duration taken to process an order from the time it is placed until it is fulfilled.
How to calculate: Calculate the time elapsed between order placement and fulfillment for each order, then find the average across all orders.
Total customers
Description: Total customers represent the number of unique individuals who have made purchases within a specific period.
How to calculate: Count the unique customers who have placed orders during the defined timeframe.
Paid by customer
Description: Paid by customer is the total amount spent by customers on their orders within a particular period, excluding taxes and discounts.
How to calculate: Sum up the prices paid by customers for their orders, excluding taxes and discounts, during the defined timeframe.
Export Shopify to Power BI or another destination
Not only can you export Shopify to Power BI, but it's also possible to replicate data importers to load data to alternative destinations:
Importing Shopify data into these apps is essentially the same as loading it into Power BI, as demonstrated earlier.
- Spreadsheet applications: Microsoft Excel and Google Sheets.
- Data warehousing software: BigQuery, PostgreSQL, and Redshift.
- Other business intelligence (BI) tools: Looker Studio, Tableau, and Qlik Sense.

Importing Shopify data into these apps is essentially the same as loading it into Power BI, as demonstrated earlier.