Export Data from Excel to Power BI
Connect Excel to Power BI with Coupler.io to import data automatically, even if coding is missing from your skill set. Export, organize, and transform data on the go, resulting in change-making reports for your business.


Connect Excel to Power BI with Coupler.io to simplify reporting
Get and prepare data effortlessly
Coupler.io enables you to export data from Excel to Power BI without any technical expertise. Make various transformations to your data, select a preferred schedule for auto-updates, and add sources to combine records from various applications.
Automate reporting tasks
You only need a few simple actions to connect Excel to Power BI and automate data imports. Avoid manual uploads, build cross-channel reports for broader analytics, and identify trends in your data by visualizing it with our free dashboard templates.
Stand out as a data-driven expert
Reduce time spent on reporting routine to prioritize strategic initiatives, thanks to Coupler.io's sophisticated data analytics and automation. Impress clients and stakeholders with your proficiency by presenting clear, ever-updating Power BI reports.
Export data from Microsoft Excel to alternative destinations


Quick start with dashboard templates

Multi-channel ad creatives performance dashboard


PPC multi-channel dashboard


 +3
+3

All-in-one marketing dashboard


 +6
+6
No such template is available yet.
No worries. Our team will create a template that fits your needs, just tell us more
about your case. It doesn't cost you a penny 😉
Request a custom report
about your case. It doesn't cost you a penny 😉
Export data from Excel to Power BI automatically with just a few clicks.
Connect similar Files & Tables apps and get data in minutes


What to export from Excel to Power BI

Marketing data
Load marketing data from Excel to Power BI, including campaign performance, audience engagement, and conversion rates. This dataset will help you evaluate the effectiveness of various marketing initiatives, understand audience behavior, refine strategies for optimal results, improve customer acquisition, and enhance overall ROI.
Sales data
Besides, you can export data from Excel to Power BI to analyze metrics like revenue, sales trends, customer segmentation, and product performance. That's how you dive into sales operations, identify growth opportunities, make informed decisions to optimize sales strategies, forecast future sales trends, and drive revenue growth.
Finance data
By extracting financial statements, cash flow projections, and profitability metrics, you can perform in-depth financial analysis. Ensure financial stability and growth, identify trends and patterns in your data, detect anomalies, and draw meaningful conclusions that will drive business success and profitability.
Accounting data
Accounting data comprises financial statements, ledger entries, expense reports, etc. It enables you to optimize accounting processes, improve financial transparency, and ensure regulatory compliance. By visualizing this data in Power BI, you can gain a deeper understanding of financial performance and identify cost-saving opportunities.
SEO data
Another data type is focused on SEO and refers to website traffic, keyword rankings, and backlink profiles. You can export it to evaluate the effectiveness of your SEO strategies, identify areas for improvement, enhance online visibility as well as optimize website content to improve search engine rankings and attract organic traffic.
E-commerce data
Information like sales transactions, customer behavior, and product performance metrics empowers you to analyze sales trends, identify top-selling products, and optimize the online shopping experience. By analyzing this data, you can gain actionable insights into customer preferences and adjust pricing strategies.
PPC data
Export PPC metrics such as click-through rates, cost per click, and conversion metrics to evaluate the effectiveness of your paid advertising campaigns, optimize ad spend, and maximize ROI. By loading this data from Excel to Power BI and scheduling imports, you can constantly track and improve campaign performance to drive business growth.
Social media data
Keep an eye on audience demographics, engagement metrics, and sentiment analysis to delve into your social media performance, understand audience preferences, and enhance brand perception. By doing so, you can identify influential content and develop targeted strategies to engage audiences across various social media platforms.
How do you export data from Excel to Power BI?
Step 1. Connect your Excel account and specify from where you'd like to export data
Step 2. Organize and transform data before loading it to Power BI
Step 3. Connect the Power BI account and copy the integration URL to the desktop app
Step 4. Schedule refreshes to automate data flow from Excel to Power BI
Pricing plans
- Monthly
- Annual (save 25%)
Your data is secured by industry standards
 Google Cloud
Certified
 SOC 2 Type II
Certified
 GDPR
GDPRCompliant
 HIPAA
HIPAACompliant
Don’t just take our word for it


How to export data from Excel to Power BI (detailed guide)
Here's how you can connect Excel to Power BI:
Step 1: Collect data
First of all, connect your Excel account. After that, specify the File and Sheet(s) from where you'd like to load data.
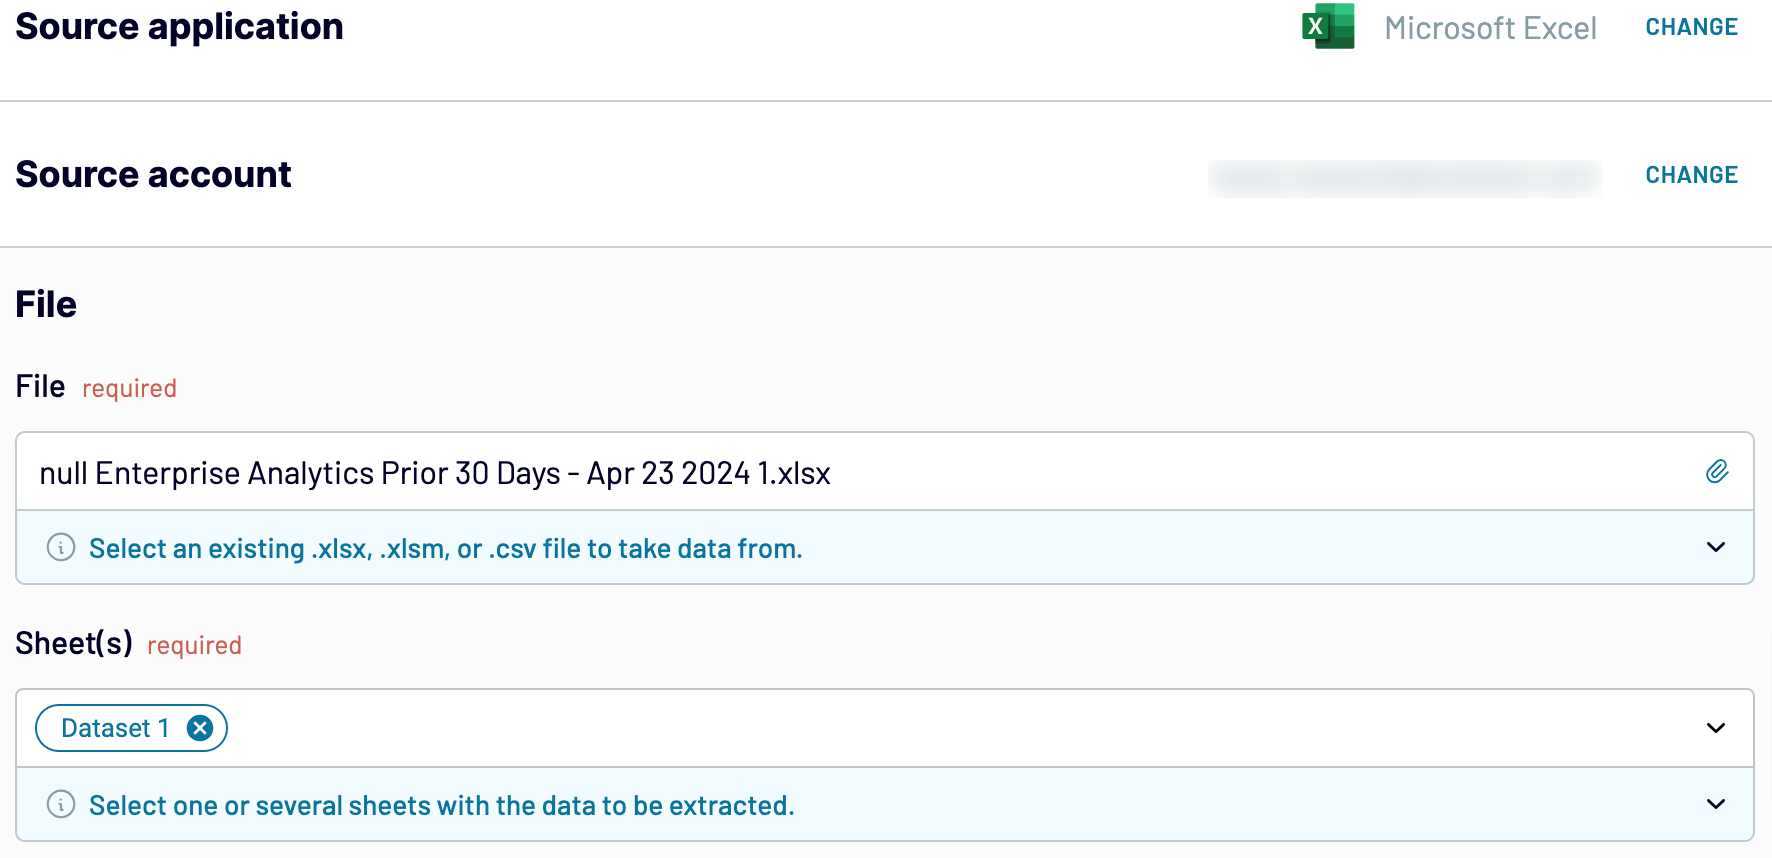
Click Finish and proceed. Next, press Transformations to move forward.
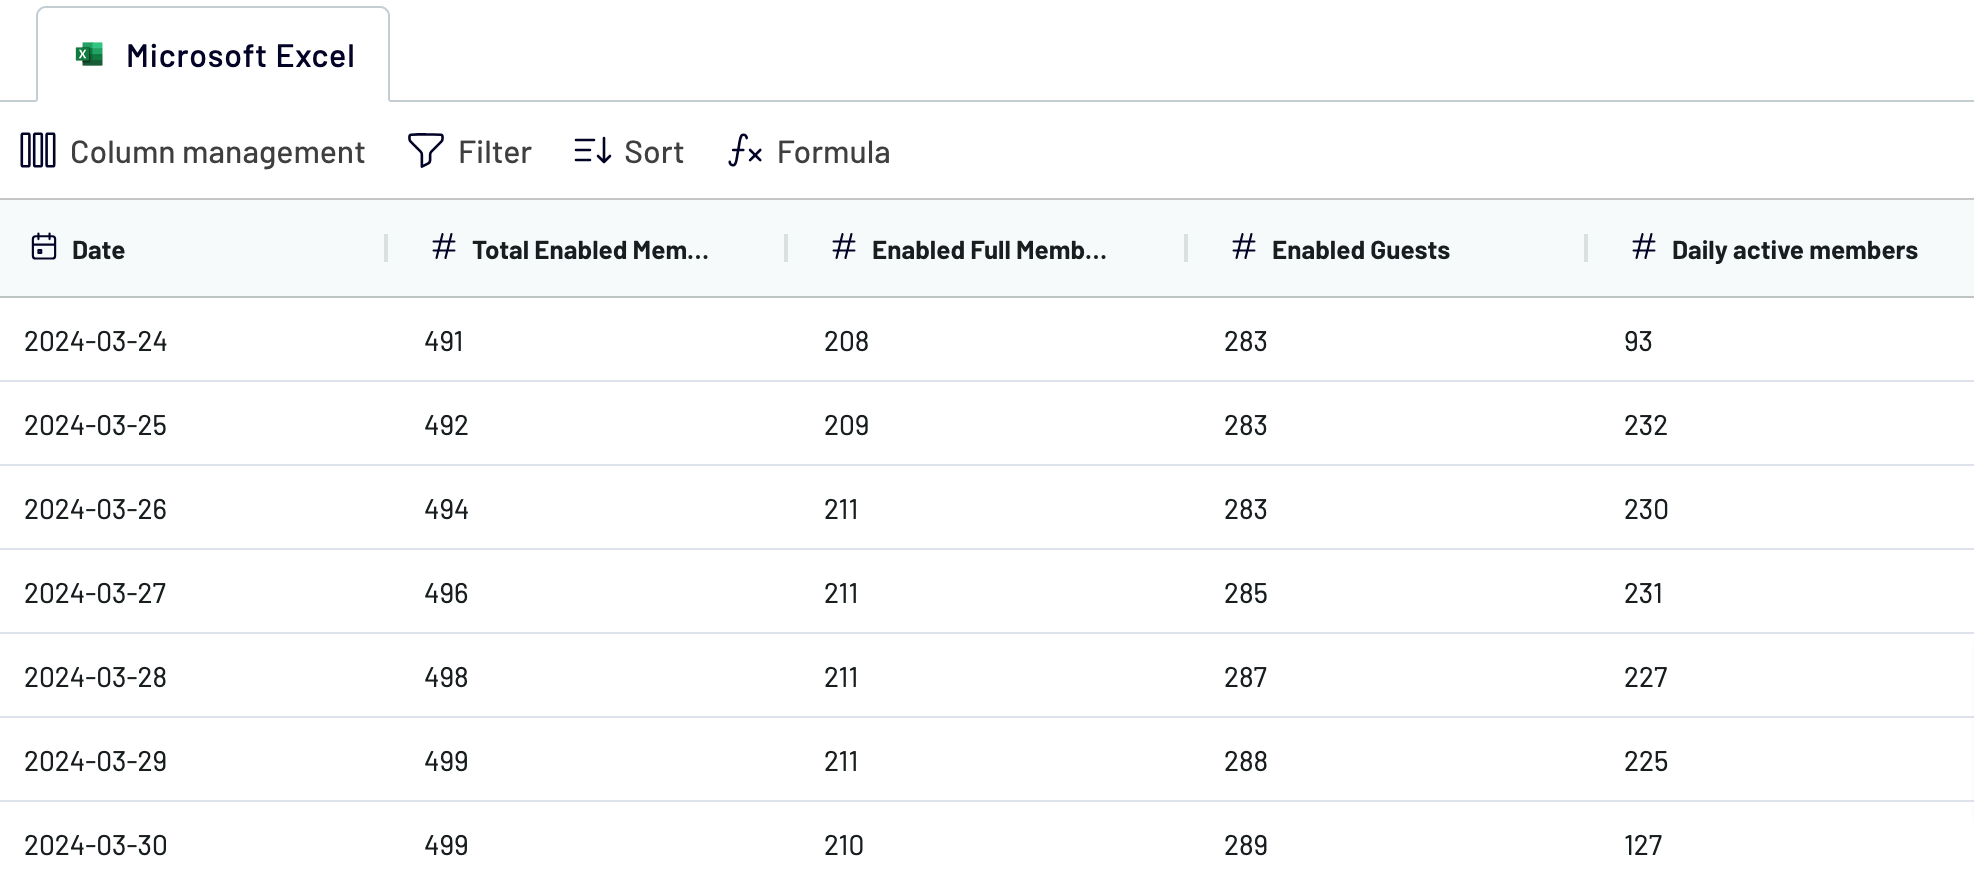
Step 2: Organize and transform
Now, it's time to preview your data before sending it from Excel to Power BI. If you'd like to make some data transformations, you have the following options:
When you're confident of data accuracy, click on Destinations.
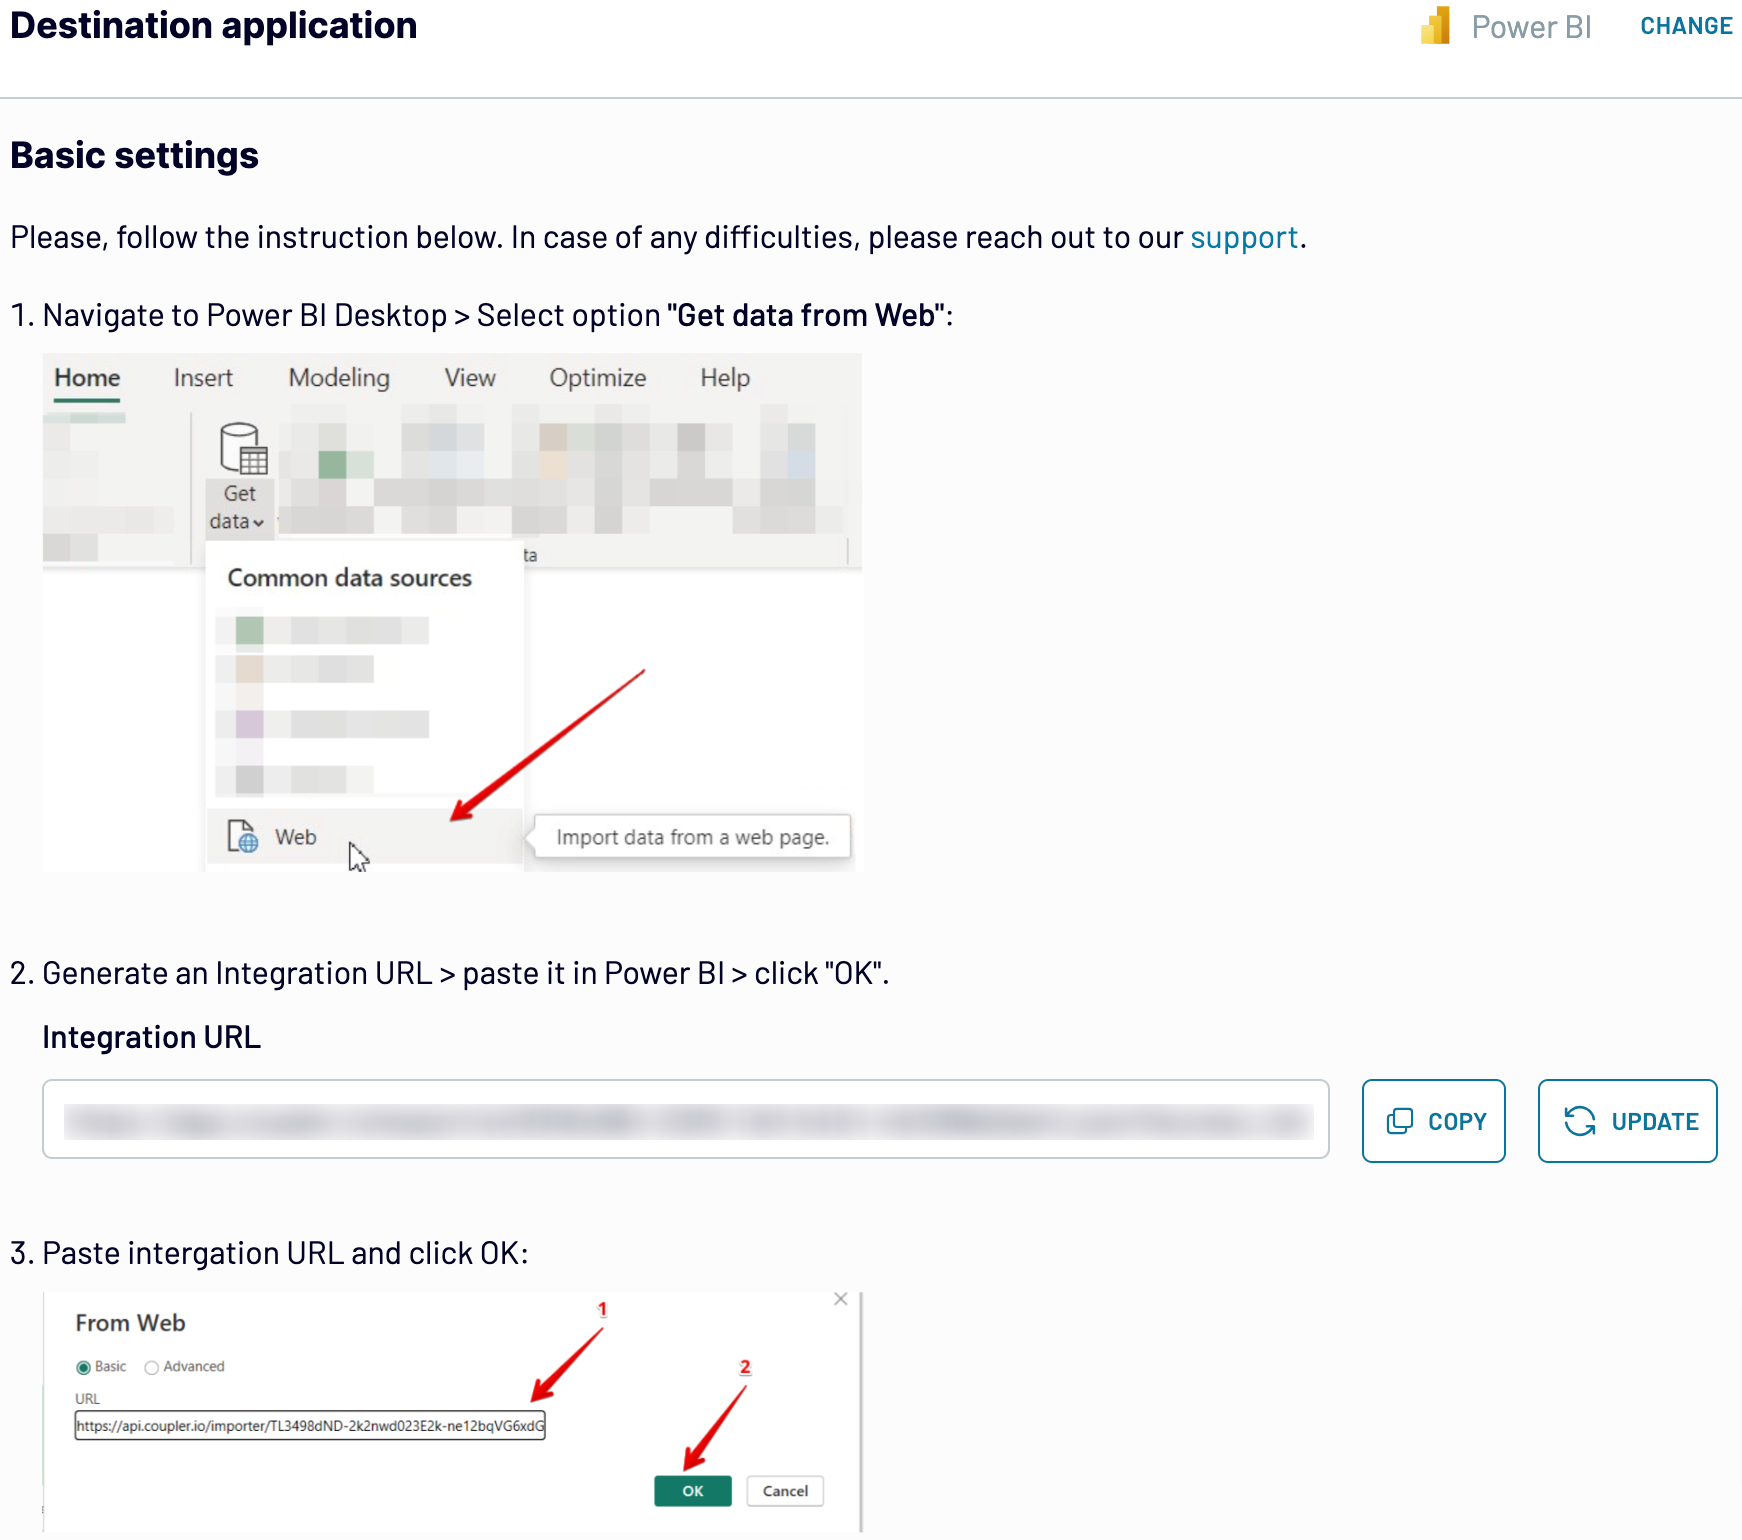
Step 3: Load and automate
To finally export data from Excel to Power BI, follow the in-app instructions to generate the integration URL and paste it into the Power BI desktop app.
Go back to Coupler.io and click Set a schedule to enable Automatic data refresh. Specify the required interval for self-updates in the respective field. The last click must be on the Save and run importer button.
Step 1: Collect data
First of all, connect your Excel account. After that, specify the File and Sheet(s) from where you'd like to load data.
Click Finish and proceed. Next, press Transformations to move forward.
Step 2: Organize and transform
Now, it's time to preview your data before sending it from Excel to Power BI. If you'd like to make some data transformations, you have the following options:
- Edit, rearrange, hide, or add columns.
- Filter and sort data in the preferred order.
- Create new columns with custom formulas.
- Combine data from different accounts or apps.
When you're confident of data accuracy, click on Destinations.
Step 3: Load and automate
To finally export data from Excel to Power BI, follow the in-app instructions to generate the integration URL and paste it into the Power BI desktop app.
Go back to Coupler.io and click Set a schedule to enable Automatic data refresh. Specify the required interval for self-updates in the respective field. The last click must be on the Save and run importer button.
Connect Excel to Power BI and automate data exports on schedule
To have your Power BI report auto-updated, you must activate automated data refreshes. Decide how often you'd like your data to update: this can be monthly, daily, hourly, or even more frequently – every 30 or 15 minutes. You can also select the days of the week, specify time preferences, and choose the relevant time zone.
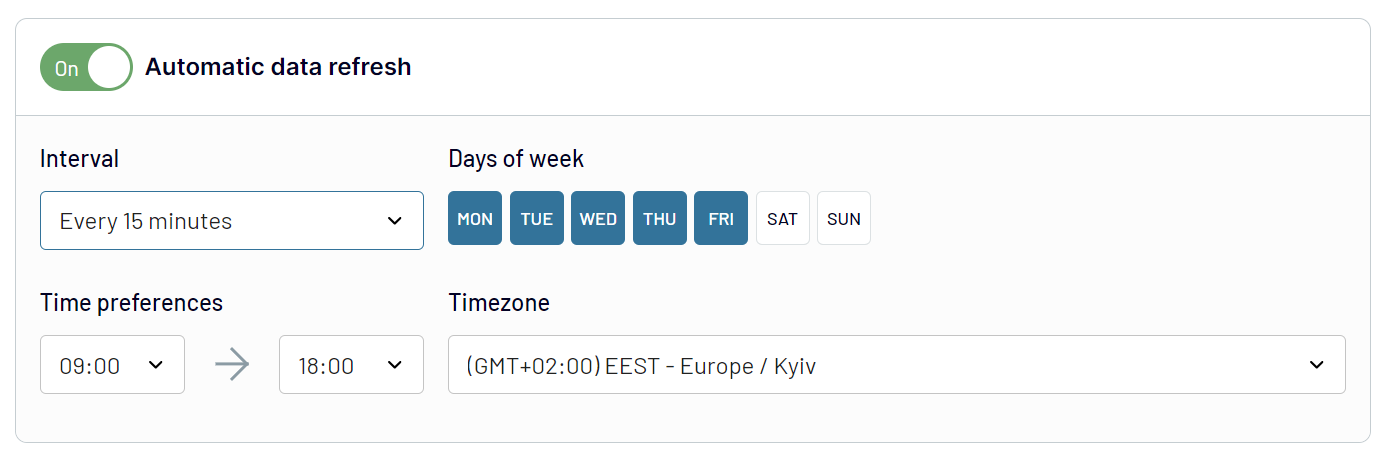
By performing the above actions, you'll always have recent data at hand. Your report will be continuously refreshed according to changes made to the source data.
By performing the above actions, you'll always have recent data at hand. Your report will be continuously refreshed according to changes made to the source data.
Replace or append the data you export from Excel to Power BI
With Coupler.io, you have access to various import modes tailored for loading data from multiple sources.
To make this happen, press the Connect one more source button in the Data sources step. Then, you'll have to complete a process similar to the setup of the initial data source. Coupler.io supports the integration of diverse source applications or different accounts of the same app within one importer.
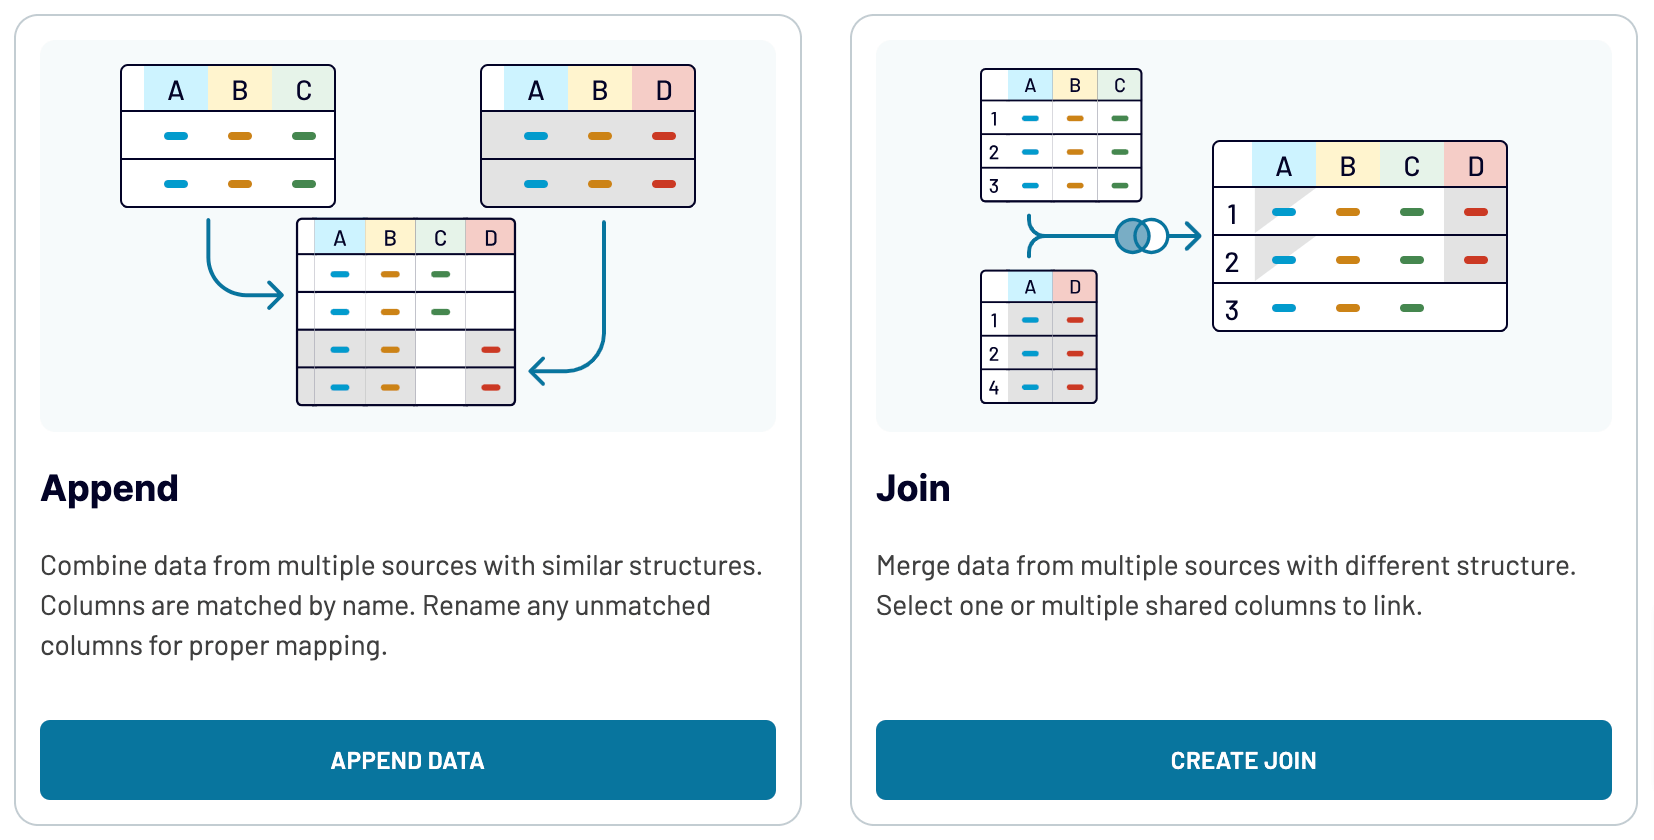
Additionally, Coupler.io offers a cross-platform data blending feature. It allows you to merge Excel data with information sourced from other platforms. After adding the desired sources and proceeding to the Transformations step, you get two options to blend your data:
By integrating diverse sources, you can enrich and broaden your analytics to see the bigger picture of your data.
To make this happen, press the Connect one more source button in the Data sources step. Then, you'll have to complete a process similar to the setup of the initial data source. Coupler.io supports the integration of diverse source applications or different accounts of the same app within one importer.
Additionally, Coupler.io offers a cross-platform data blending feature. It allows you to merge Excel data with information sourced from other platforms. After adding the desired sources and proceeding to the Transformations step, you get two options to blend your data:
- Append: Merge data elements from one source into another, providing identical column names are shared between the datasets.
- Join: Combine datasets side-by-side, which requires at least one identical column in each dataset.
By integrating diverse sources, you can enrich and broaden your analytics to see the bigger picture of your data.
Import data from Excel to Power BI or another destination
Not only can you export data from Excel to Power BI, but you also have the flexibility to replicate importers to load data into alternative destinations:
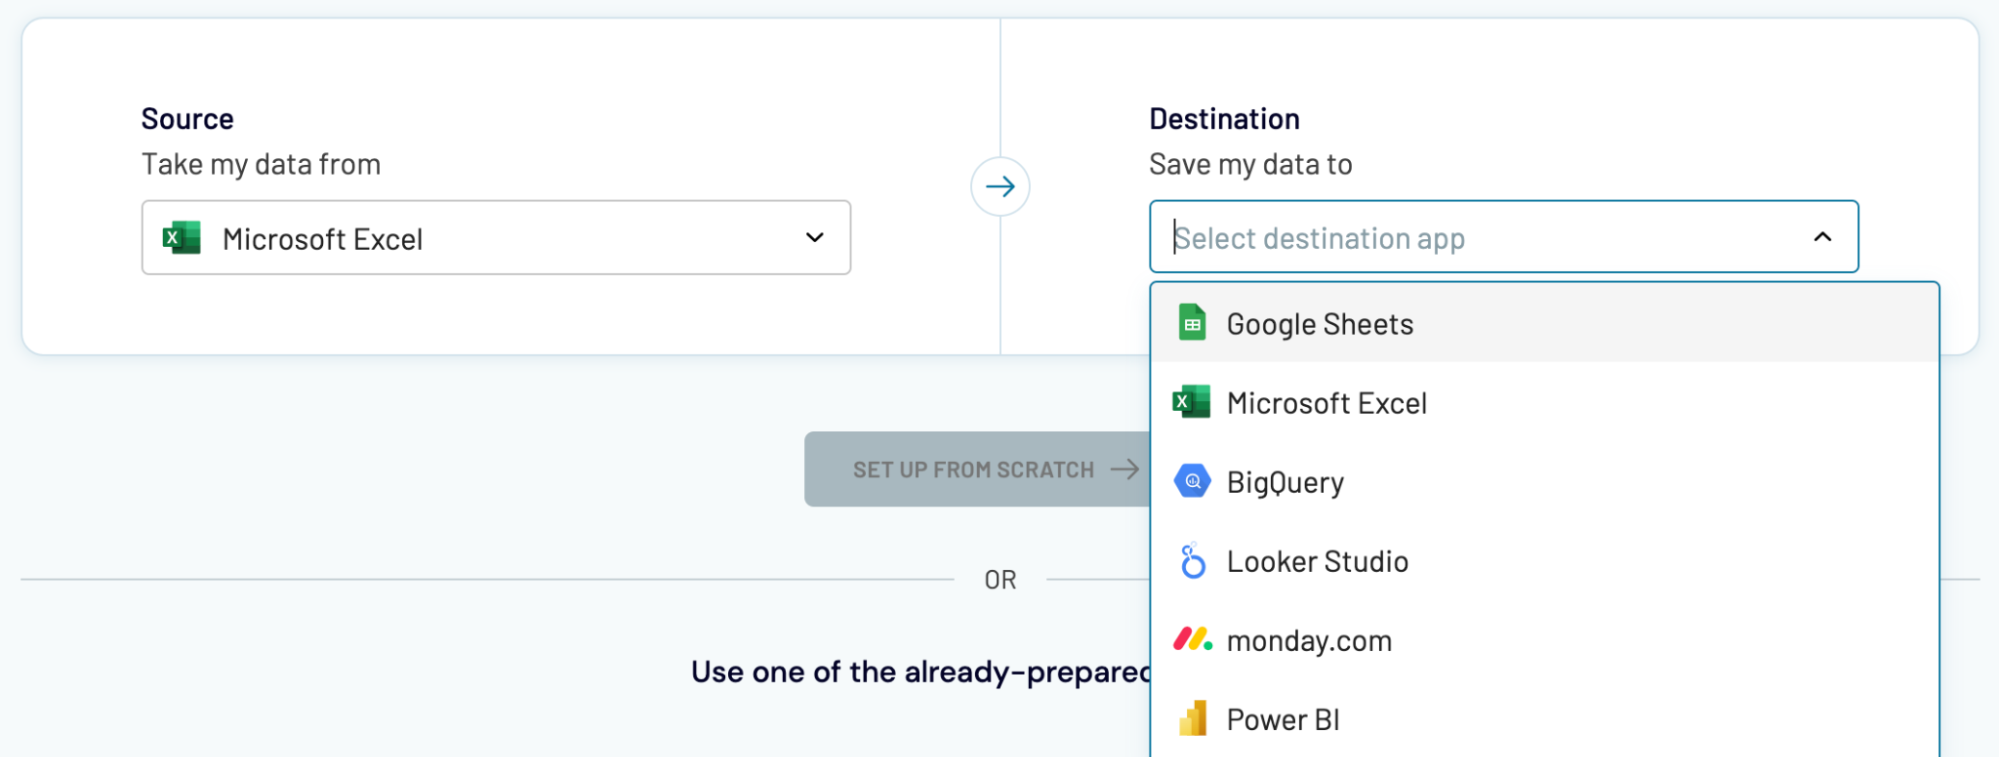
Exporting Excel data into these destinations is a straightforward process similar to the one we overviewed earlier for Power BI.
- One more spreadsheet app: Google Sheets – to ensure simple and quick reporting.
- Data warehouses: BigQuery, PostgreSQL, and Redshift – to store, query, and perform an elaborate analysis of Excel data.
- Other business intelligence (BI) tools: Looker Studio and Qlik Sense – to have your data visualized through dashboards.
Exporting Excel data into these destinations is a straightforward process similar to the one we overviewed earlier for Power BI.