Connect Redshift to Power BI
Quickly retrieve, organize, and transform your data to match your requirements. With Coupler.io, you can connect Redshift with Power BI and schedule updates to keep your reports up-to-date. Unlock valuable insights that drive informed decision-making.


Connect Redshift to Power BI with Coupler.io to simplify reporting
Get and prepare data effortlessly
Easily export Redshift data to Power BI using Coupler.io without any coding. Choose from a wide array of data transformations to compile single or cross-app reports. Set a custom schedule for automatic updates to keep your reports live.
Automate reporting tasks
Eliminate the hassle of manual reporting using the Coupler.io connector. Import data from Redshift to Power BI and automate the flow easily. Use our free templates to turn your data into informative dashboards that will drive your decision-making.
Stand out as a data-driven expert
Build confidence in your expertise by providing live reports to clients and stakeholders. Rely on Coupler.io to connect Redshift to Power BI and handle data import. Concentrate on strategic, forward-looking tasks, keeping the data flow automated.
How to connect Redshift to Power BI (detailed guide)
With Coupler.io, it’s quite simple to collect and organize your data. It takes a few simple steps to set up the data integration between the data warehouse and the business intelligence tool. Here is what it looks like to connect Redshift to Power BI:
Step 1: Collect data
Start by connecting your Redshift account. Then, configure your data source settings according to your preferences:
Step 2: Organize and transform
Before importing Redshift data to Power BI, preview your data to ensure its accuracy. If necessary, apply data transformations using the following options:
These transformations ensure your dataset is ready for analysis upon import.
Step 3: Load and automate
To finally import data from Redshift to Power BI, follow the in-app instructions to generate the integration URL. Then open the Microsoft Power BI desktop application and click Get data => Web. Insert the copied integration URL and proceed with the data load. Your data from Redshift will first land in the Power Query editor. Here, you can make additional transformations and eventually load the dataset to Power BI. After that, your data is ready for visualization.
Turn on automatic data updates and choose the interval you're comfortable with. Lastly, save and run the importer.
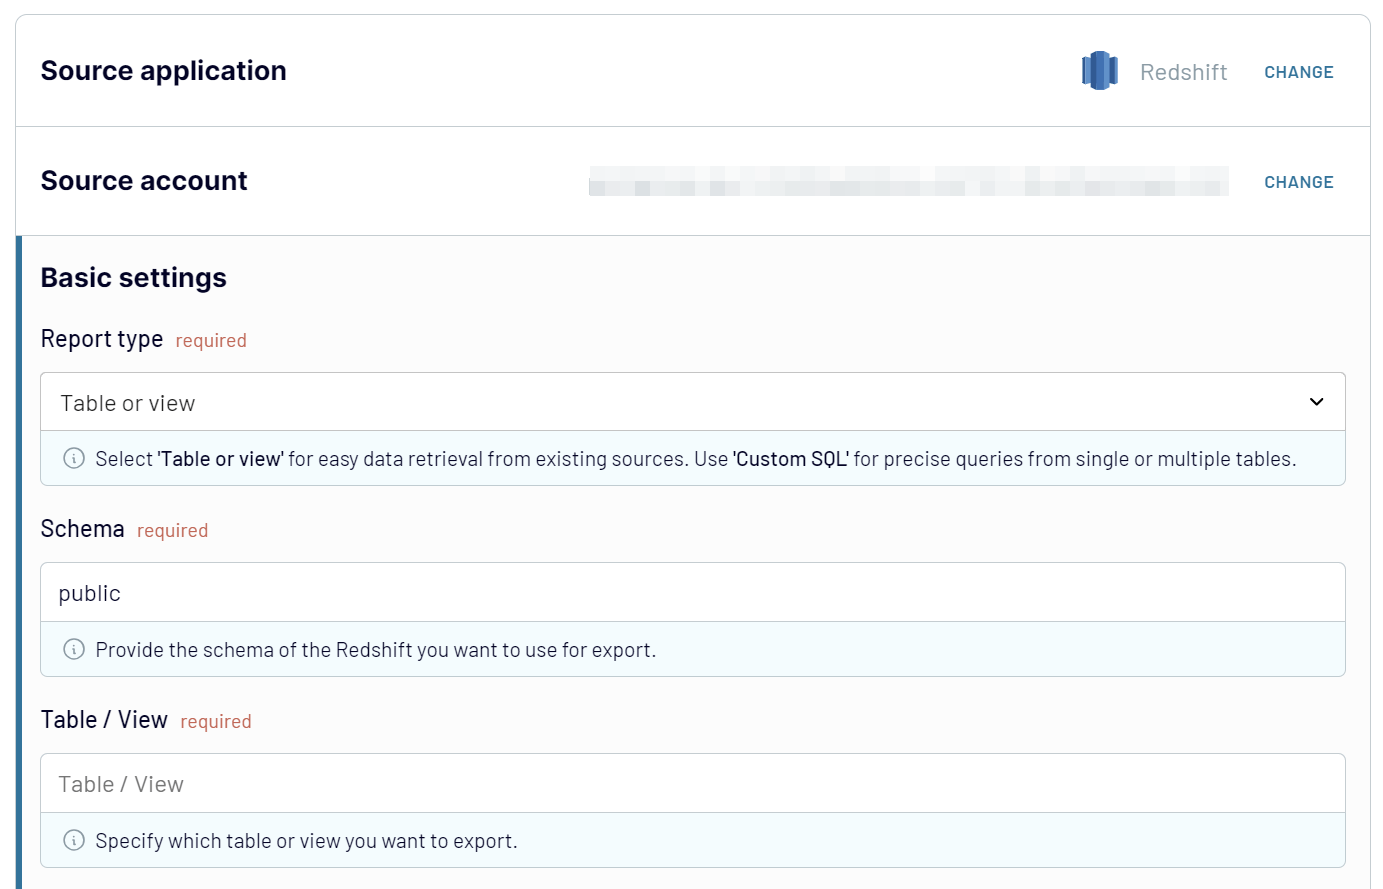
Step 1: Collect data
Start by connecting your Redshift account. Then, configure your data source settings according to your preferences:
- Report type. Table or view is selected by default for easy data retrieval from existing sources. Select custom SQL for precise queries from single or multiple Redshift tables.
- Schema. Specify the schema you want to export.
- Table/view. Enter the name of the specific table or view you wish to load from the database.
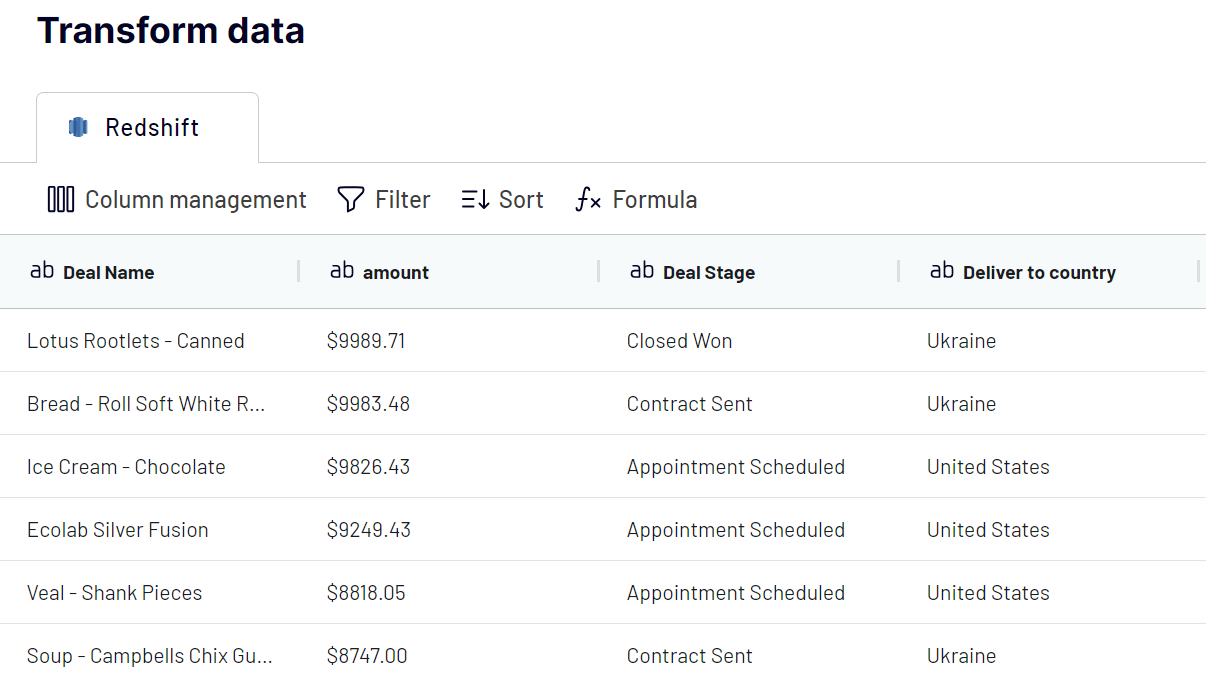
Step 2: Organize and transform
Before importing Redshift data to Power BI, preview your data to ensure its accuracy. If necessary, apply data transformations using the following options:
- Edit, Rearrange, Hide, or Add Columns: Customize your dataset structure.
- Apply Filters and Sort Data: Refine your data for better analysis.
- Create New Columns with Custom Formulas: Enhance your dataset with calculated fields.
- Hide and rename Columns: Change column names to make them more descriptive and relevant to your business context. Hide the columns that are of no use to you.
- Blend Data from Multiple Accounts or Apps: Combine data sources for a comprehensive view.
These transformations ensure your dataset is ready for analysis upon import.
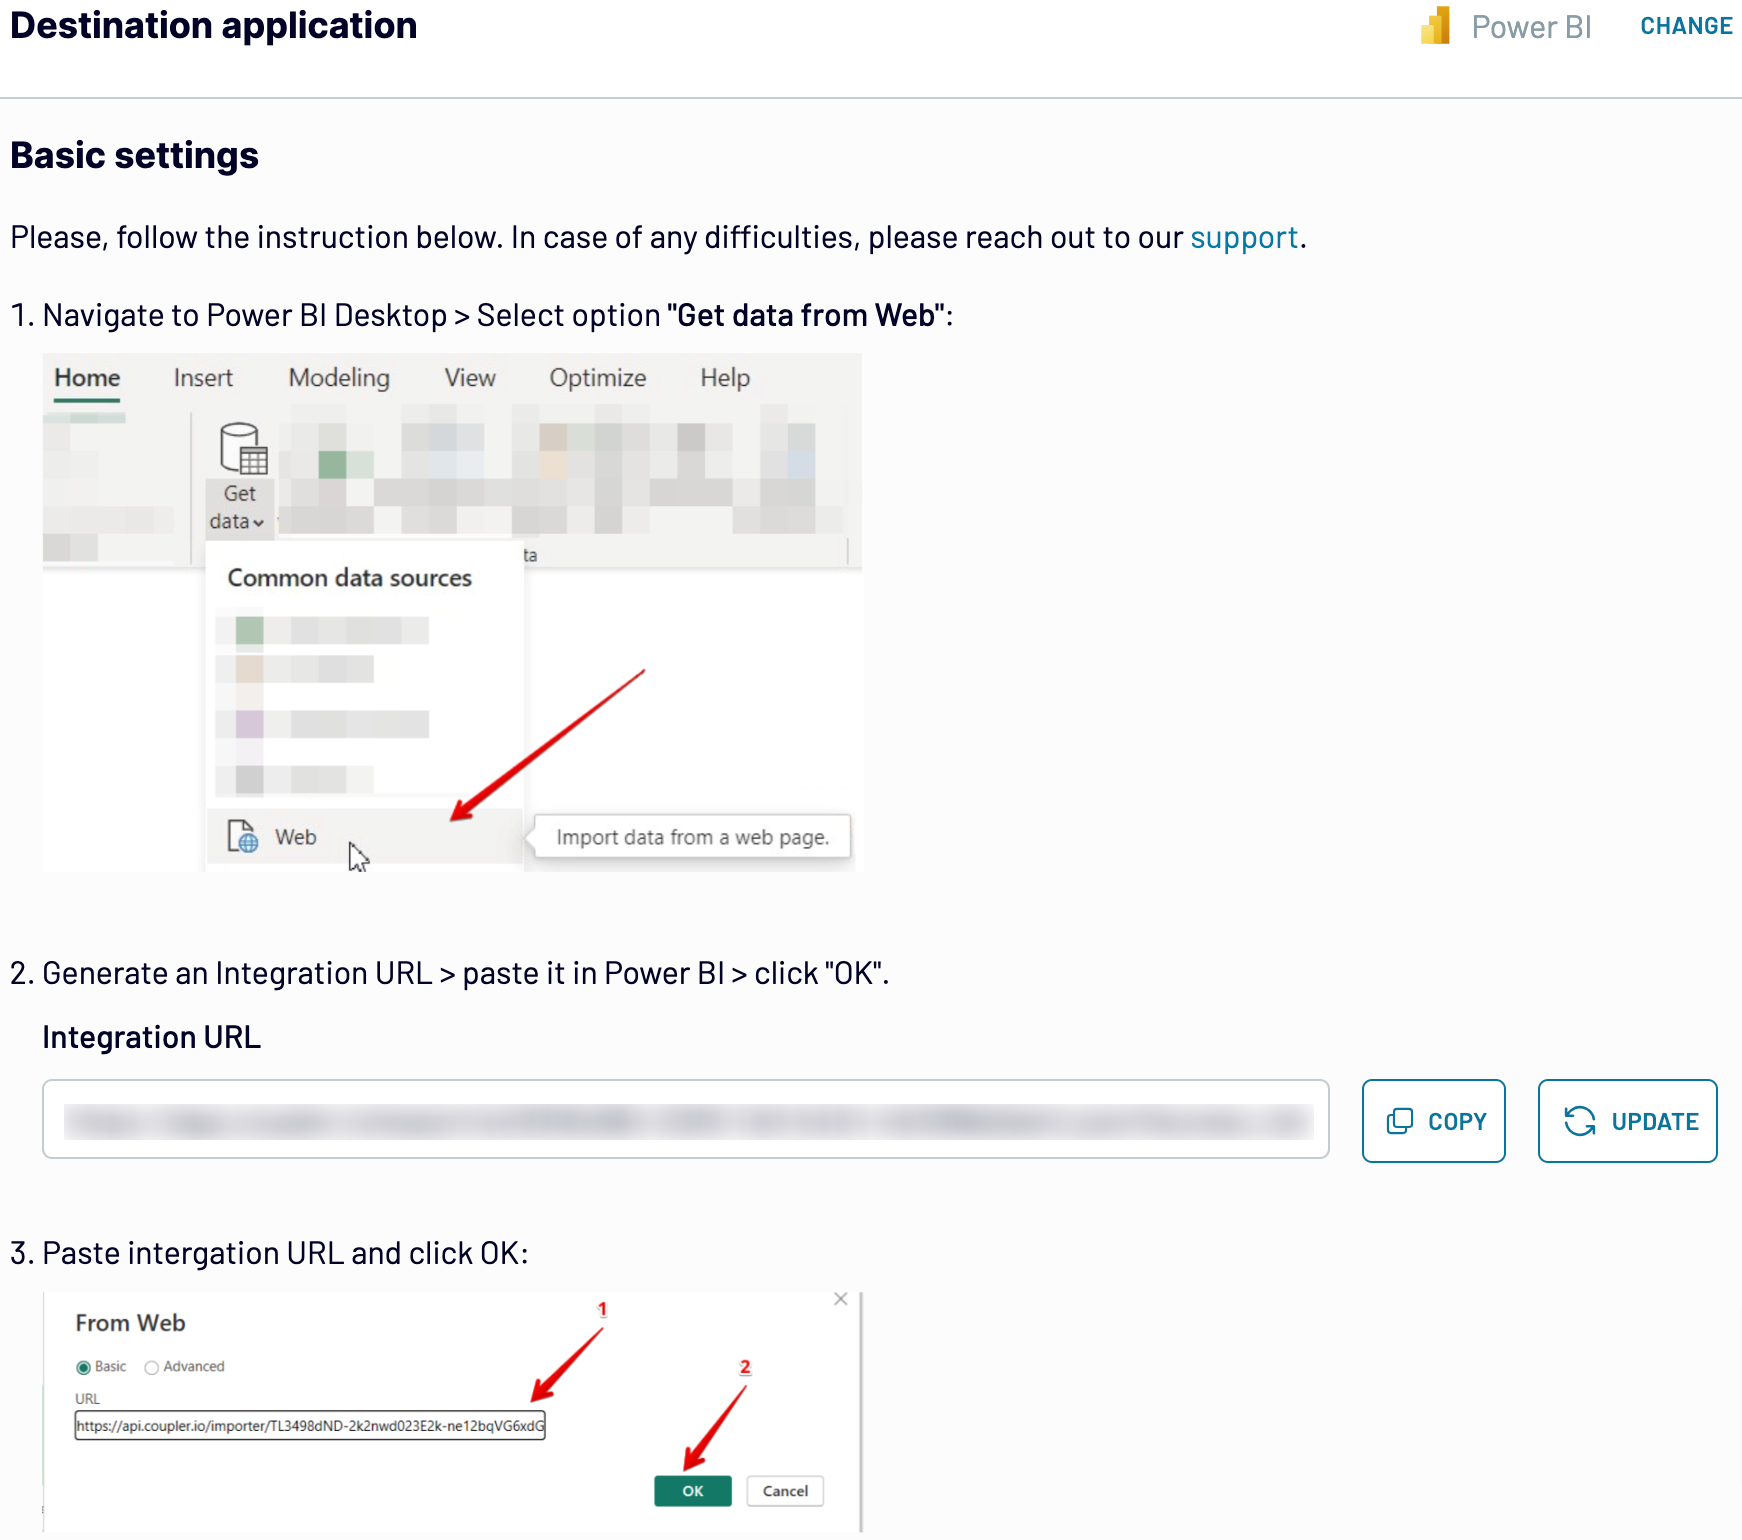
Step 3: Load and automate
To finally import data from Redshift to Power BI, follow the in-app instructions to generate the integration URL. Then open the Microsoft Power BI desktop application and click Get data => Web. Insert the copied integration URL and proceed with the data load. Your data from Redshift will first land in the Power Query editor. Here, you can make additional transformations and eventually load the dataset to Power BI. After that, your data is ready for visualization.
Turn on automatic data updates and choose the interval you're comfortable with. Lastly, save and run the importer.
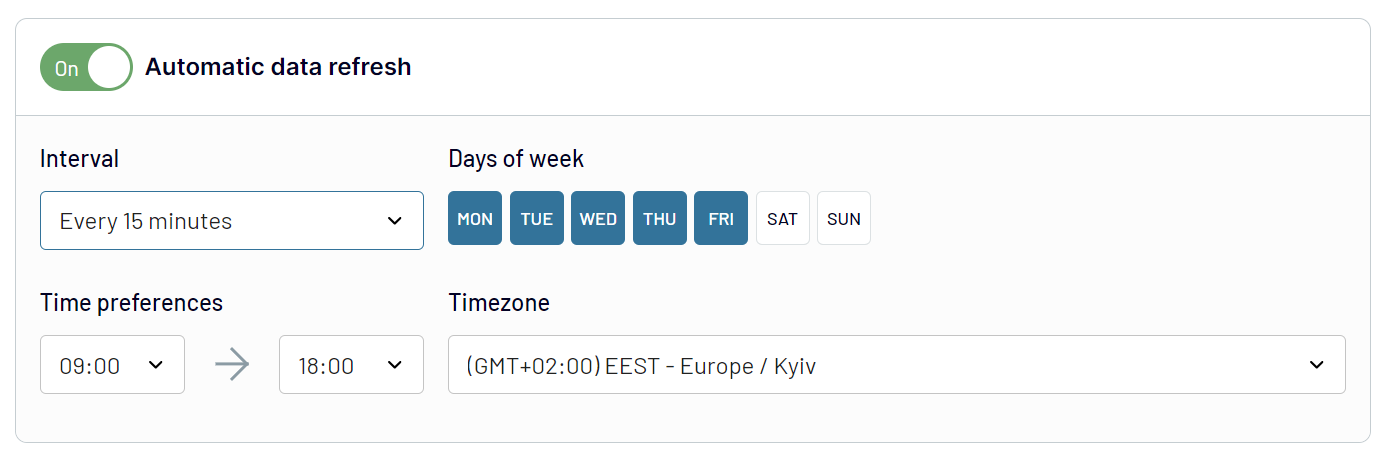
Export Redshift to Power BI and schedule refresh
Turn on the automated refresh feature to keep your imported data current. Select the frequency of updates, ranging from monthly to every 30 or 15 minutes. Customize your data refresh by specifying the days of the week, the time slot, and your preferred time zone.
This functionality from Coupler.io ensures that your Power BI reports always reflect the latest data from Redshift
This functionality from Coupler.io ensures that your Power BI reports always reflect the latest data from Redshift
Export data from Redshift to alternative destinations


Quick start with dashboard templates

Multi-channel ad creatives performance dashboard


PPC multi-channel dashboard


 +3
+3

All-in-one marketing dashboard


 +6
+6
No such template is available yet.
No worries. Our team will create a template that fits your needs, just tell us more
about your case. It doesn't cost you a penny 😉
Request a custom report
about your case. It doesn't cost you a penny 😉
Export AWS Redshift to Power BI automatically with just a few clicks.
Connect similar Files & Tables apps and get data in minutes


What Amazon Redshift data you can export to Power BI

Marketing Data
Analyze marketing data to track essential metrics like conversion rates, CTR, CPC, etc. This information helps evaluate campaign performance and identify the most effective channels. Ultimately, you can maximize your return on investment and improve overall marketing efforts.
Sales Data
Examine sales data to capture key metrics such as revenue, growth rates, and customer churn. Understanding these details allows you to identify sales trends and forecast future revenue. This is helpful for informed decision-making and driving business growth.
Finance Data
Finance data includes cash flow statements, expense ratios, and profit and loss statements. This information is crucial for budgeting, forecasting, and managing expenses. It helps you enhance profitability and ensure financial stability through informed financial decisions.
Accounting Data
Accounting data includes transaction volumes, tax liabilities, and audit trails. It ensures accurate financial reporting and minimizes errors. This information is vital for maintaining regulatory compliance and financial transparency.
SEO Data
SEO data encompasses keyword ranking, organic traffic, bounce rates, and other metrics. Analyzing this data helps assess website visibility and search engine ranking. As a result, you can refine your SEO strategies and improve overall digital marketing effectiveness.
Ecommerce Data
Ecommerce data includes customer retention rates, cart abandonment rates, and other product performance metrics. It provides insights into customer preferences and purchasing behavior. With this information, you can enhance customer satisfaction and optimize product offerings.
PPC Data
PPC data covers metrics like click-through rates, cost per click, and impressions. Understanding this data helps evaluate ad performance. You can uncover audience behavior and optimize PPC campaigns. All this will contribute to maximizing return on ad spend and achieving advertising goals.
Social Media Data
Social media data includes metrics such as likes, shares, follower growth rates, and engagement rates. Analyzing this information helps evaluate content performance. It lets you optimize social media strategies, increase audience engagement, and improve your overall brand presence online.
How do you connect Redshift to Power BI?
Step 1. Connect your Redshift account and choose what data you'd like to export
Step 2. Organize and transform data before loading it into Power BI
Step 3. Connect the Power BI account and copy the integration URL to the desktop app
Step 4. Schedule auto-refreshes to export Redshift to Power BI at desired intervals
Pricing plans
- Monthly
- Annual (save 25%)
Your data is secured by industry standards
 Google Cloud
Certified
 SOC 2 Type II
Certified
 GDPR
GDPRCompliant
 HIPAA
HIPAACompliant
Don’t just take our word for it


Dramatically improved our reporting speed by about 60%. The interface is user-friendly, even for team members with no technical background.
Helped solve data processing issues, and customer service is 10/10. It is extremely easy to use, and allows us to extract data from multiple sources.