Export Freshdesk to Looker Studio
Create compelling visual stories from customer support data with the Freshdesk to Looker Studio integration by Coupler.io. Transform ticket metrics, agent performance, and customer satisfaction data into interactive dashboards that engage stakeholders and drive support improvements.
What data you can export from Freshdesk
-
Discussion commentsCommunity interaction data with engagement metrics formatted for visualization of user participation patterns, response trends, and community health through compelling visual formats.
-
Email configsCommunication channel configuration data structured for channel performance visualization, setup optimization analysis, and operational effectiveness tracking through engaging visual representations.
-
ProductsProduct-related support data organized for issue trend visualization, product performance analysis, and feature request tracking through interactive visual dashboards and compelling storytelling.
-
Ticket fieldsCustom field usage and distribution data prepared for workflow visualization, categorization analysis, and process optimization through engaging visual analytics and trend monitoring.
-
RolesUser access and permission data structured for organizational visualization, responsibility distribution analysis, and team structure optimization through visual storytelling formats.
-
Business hoursOperational schedule data formatted for coverage visualization, workload distribution analysis, and resource allocation optimization through engaging visual representations and interactive dashboards.
-
SurveysCustomer feedback survey data organized for response trend visualization, satisfaction analysis, and service quality tracking through compelling visual formats and interactive analytics.
-
Discussion forumsCommunity platform data prepared for engagement visualization, topic performance analysis, and community growth tracking through visual analytics and compelling storytelling dashboards.
All-in-one tool for Freshdesk data exports and analytics
Import support tickets, agent metrics, and customer feedback from Freshdesk, then blend with operational data from other business systems to create comprehensive datasets that power interactive Looker Studio visualizations and compelling support storytelling.
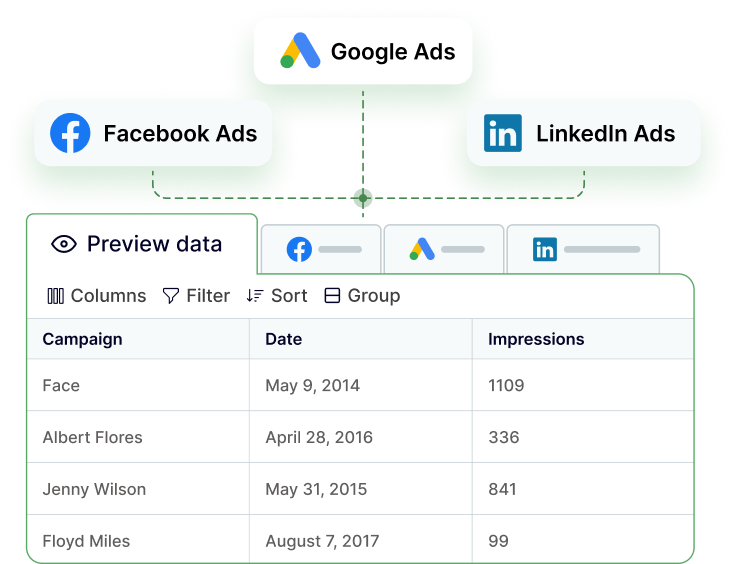
Format Freshdesk support data for optimal visualization performance in Looker Studio, with properly structured dimensions and metrics that enable interactive filtering, drilling, and dynamic dashboard functionality for engaging support analytics.
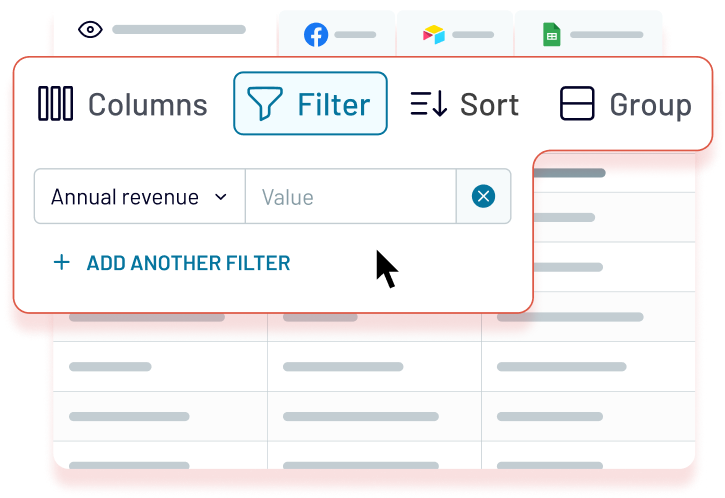
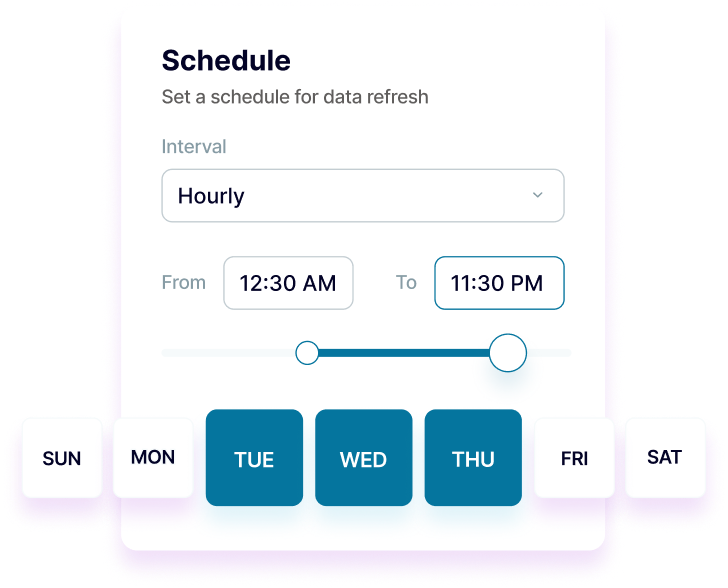
Keep Looker Studio dashboards updated with automatic data refresh from monthly to 15-minute frequencies. Ensure stakeholders always view the latest support performance through up-to-date visualizations and interactive reporting.
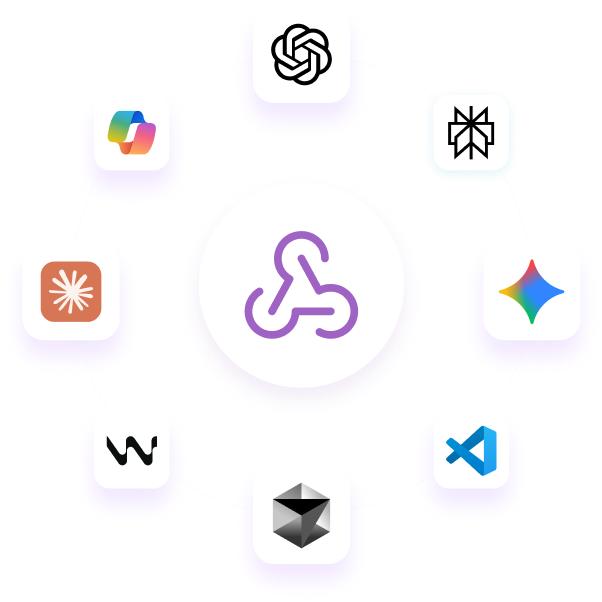
Enhance your support data insights with Coupler.io AI integrations. Connect your datasets to AI tools for natural language exploration of support trends and performance patterns that complement visual analytics.


Why export Freshdesk to Looker Studio - real life cases
Interactive executive support dashboards
Customer satisfaction storytelling and trend visualization
Support team performance visualization and motivation
Multi-channel support performance comparison
How to export Freshdesk to Looker Studio
Automate data exports with the no-code Freshdesk Looker Studio integration
Connect similar CRM apps and get data in minutes
Quick start with dashboard templates
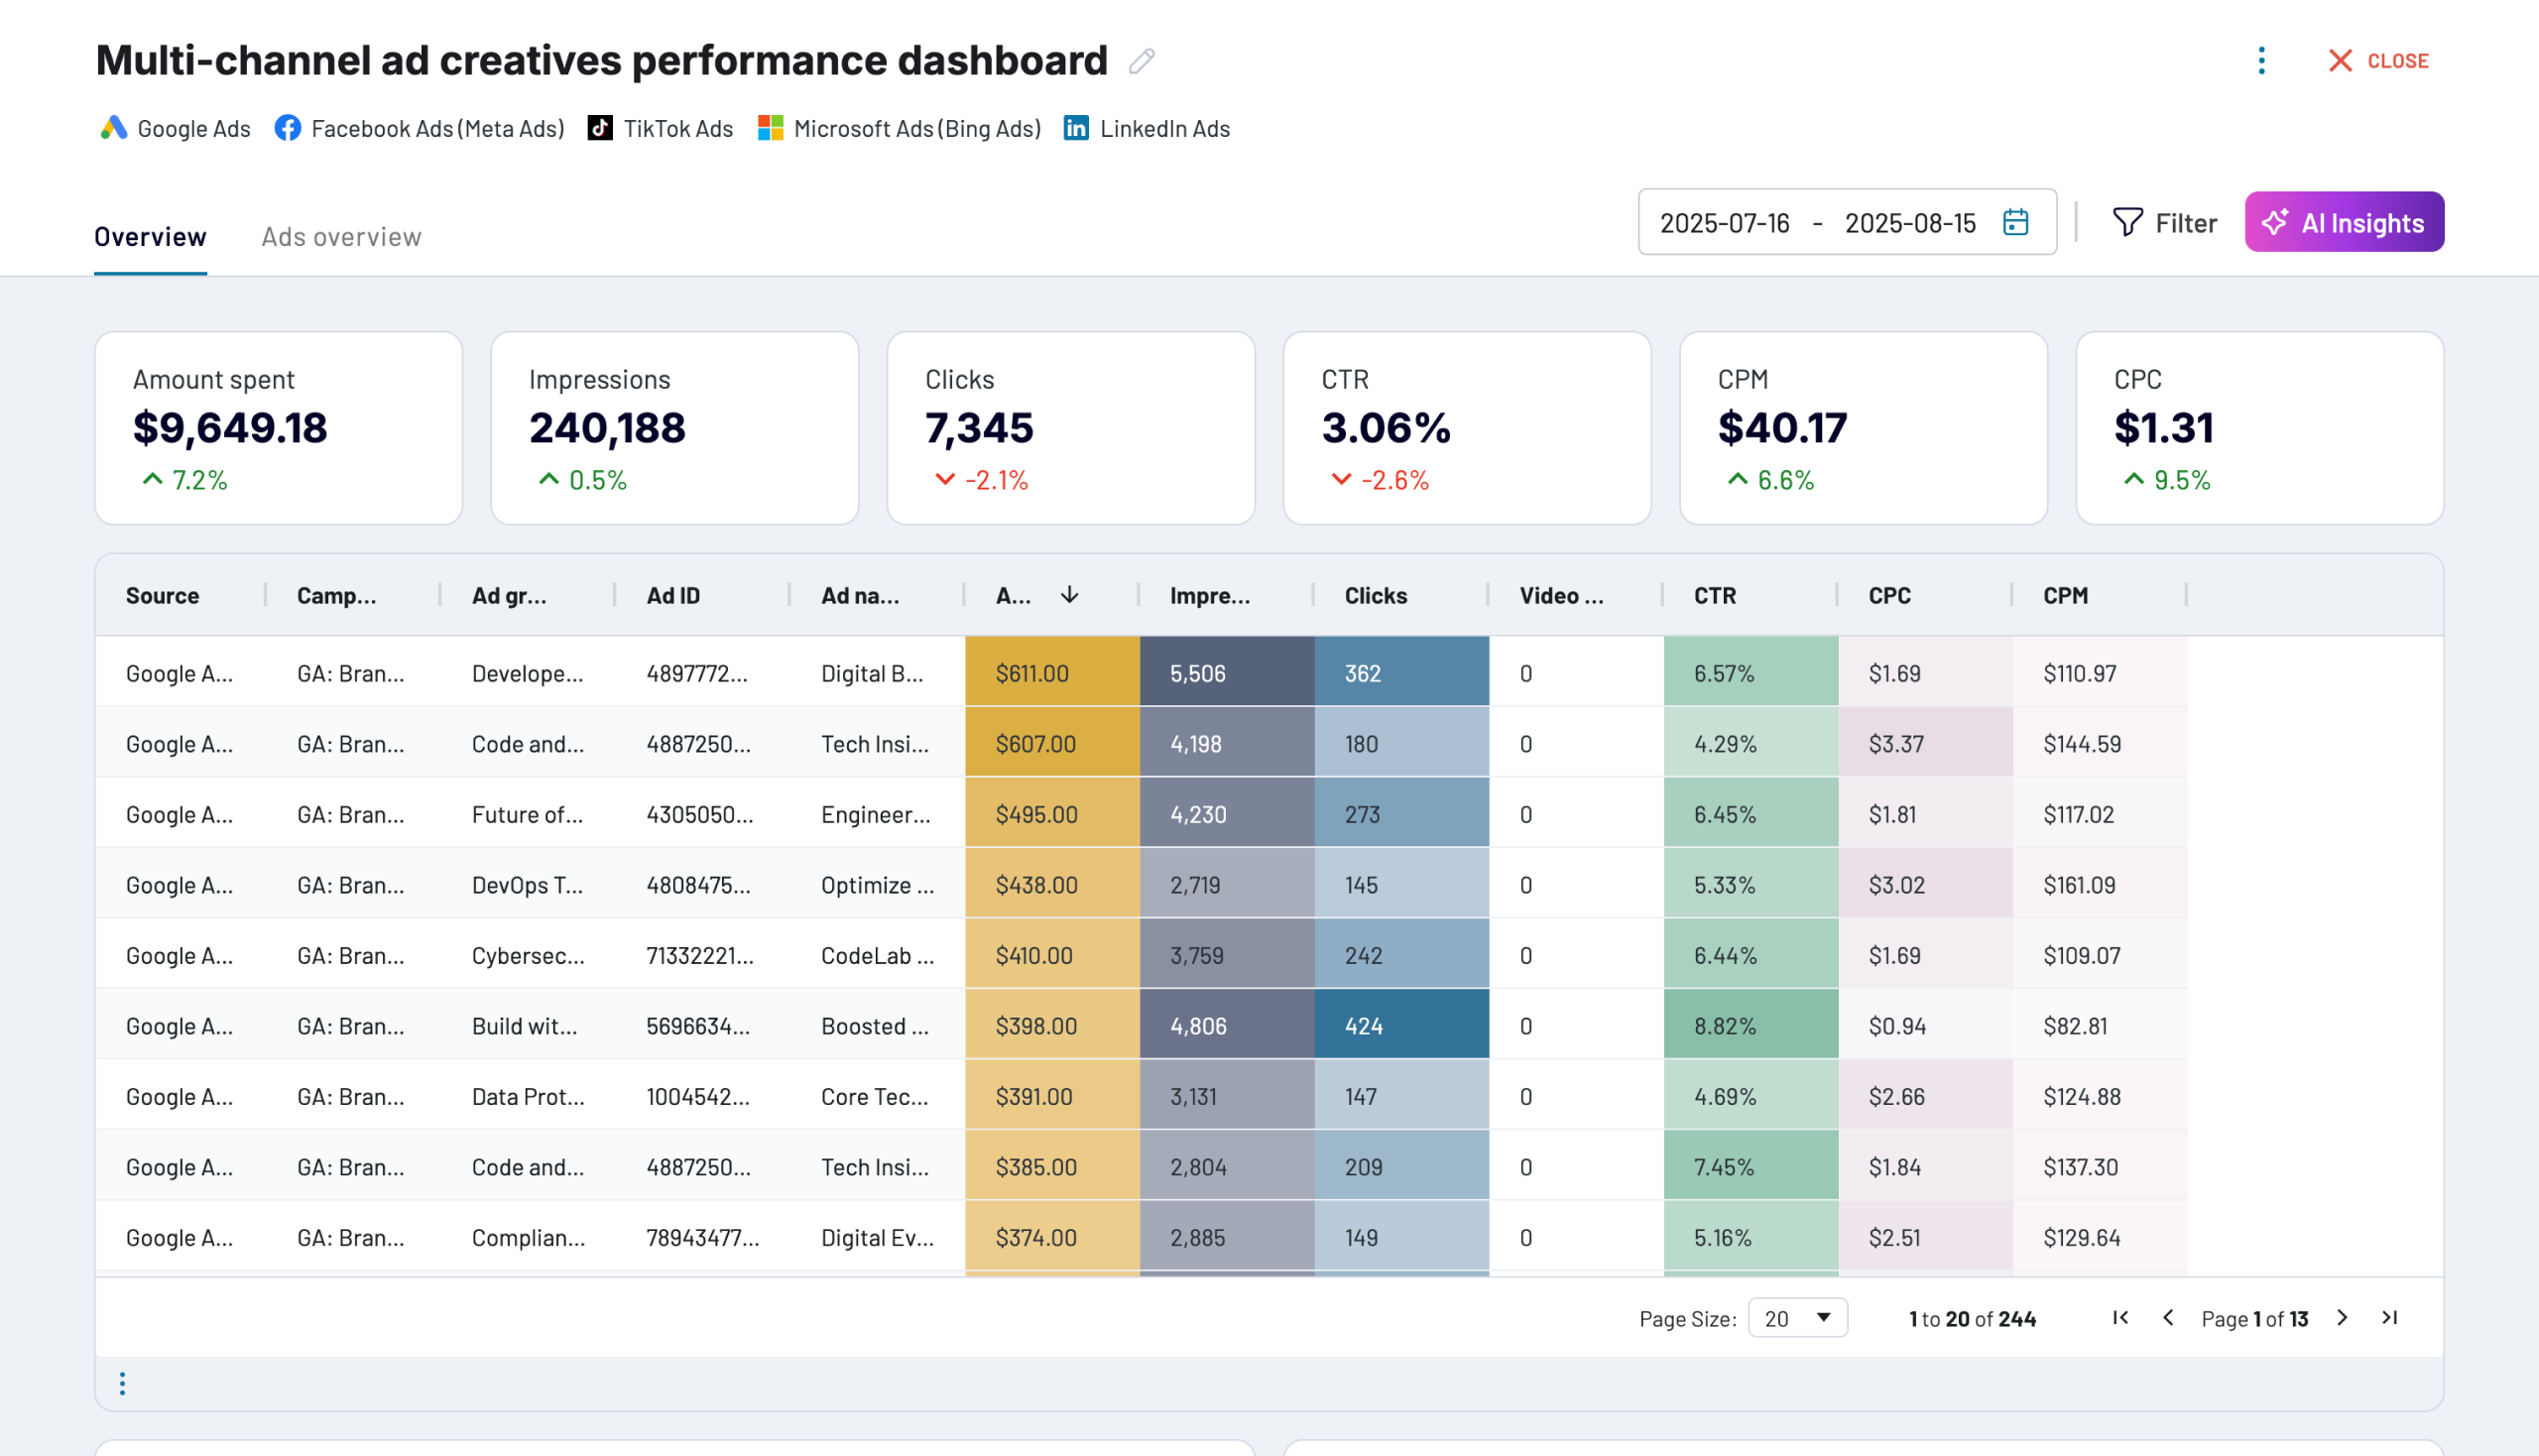


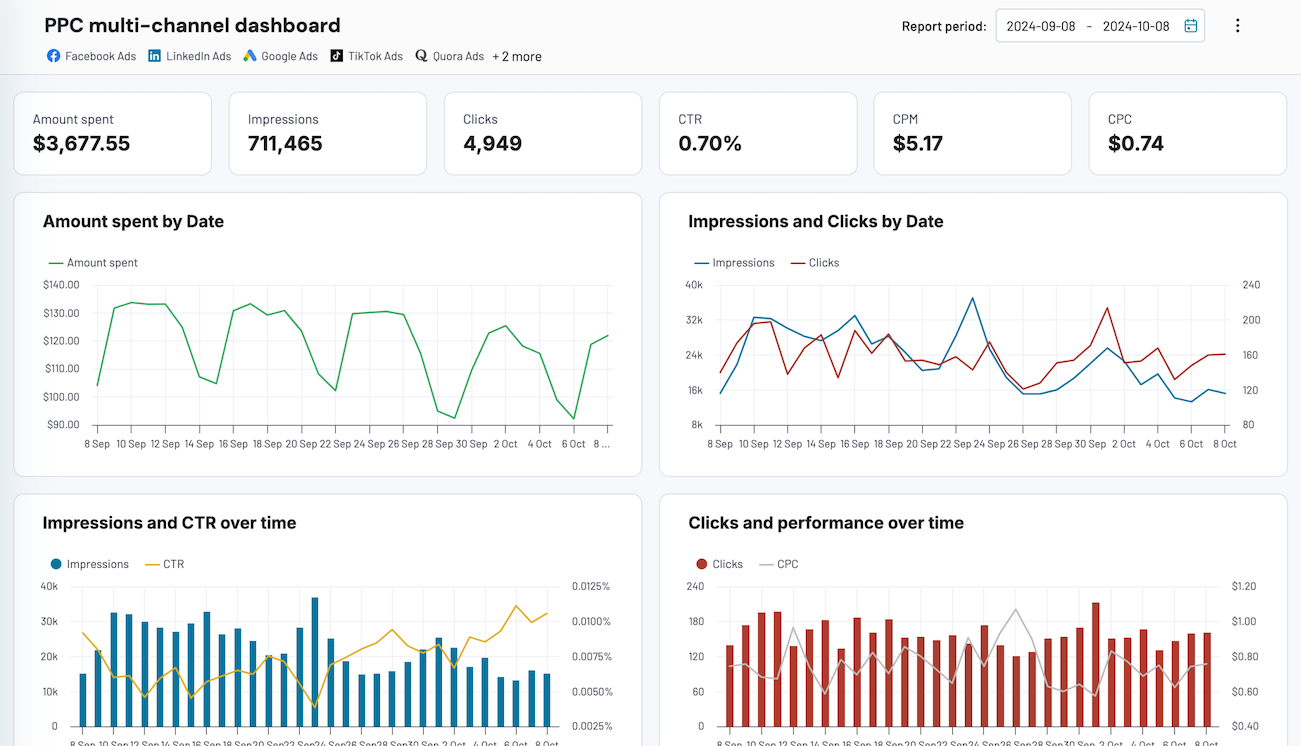


 +3
+3


 +6
+6

about your case. It doesn't cost you a penny 😉
Talk to AI about your Freshdesk data
Examples of questions you can ask about Freshdesk data:
- "Create visualizations showing seasonal patterns in support ticket volume and agent workload"
- "What are the key metrics I should include in this month's support performance dashboard?"
- "Identify the most effective visual formats for presenting customer satisfaction trends to executives"
- "Which support channels show the best performance and how should I visualize this comparison?"


Keep your data safe
Coupler.io safeguards your shared information and data transfers from breaches, leaks, and unauthorized disclosures.


