Export Datadog to Looker Studio
Create compelling operational visualizations and interactive monitoring dashboards with the Datadog to Looker Studio integration by Coupler.io. Transform complex monitoring data into engaging visual stories that communicate system health and performance trends effectively.
What data you can export from Datadog
-
DashboardsMonitoring visualization configurations optimized for operational storytelling, including widget performance data and layout information for consistent reporting across different visualization platforms and stakeholder environments.
-
Synthetic testsAutomated testing results formatted for performance visualization, enabling interactive charts showing availability trends, response time patterns, and user experience metrics across different services and environments.
-
Service level objectivesSLO performance data structured for reliability visualization, including achievement rates, error budget consumption, and compliance tracking for stakeholder reporting and service commitment monitoring.
-
DowntimesMaintenance windows and outage data optimized for availability visualization, showing impact patterns, duration analysis, and scheduling effectiveness for operational planning and reliability reporting.
-
Incident teamsTeam response data formatted for collaboration visualization, including assignment patterns, escalation effectiveness, and response time analysis for operational excellence tracking and team performance optimization.
-
MonitorsAlert configuration and performance data structured for monitoring effectiveness visualization, showing alert accuracy, response patterns, and threshold optimization for monitoring strategy improvement.
-
MetricsSystem performance measurements organized for trend visualization, including response times, throughput, and resource utilization patterns for capacity planning and performance optimization storytelling.
-
UsersTeam collaboration and access data formatted for operational security visualization, showing activity patterns, access management effectiveness, and team engagement metrics for monitoring governance and compliance.
All-in-one tool for Datadog data exports and analytics
Import comprehensive monitoring data and blend with business metrics, cost information, and operational data sources to create unified datasets that power interactive Looker Studio dashboards and compelling operational storytelling.
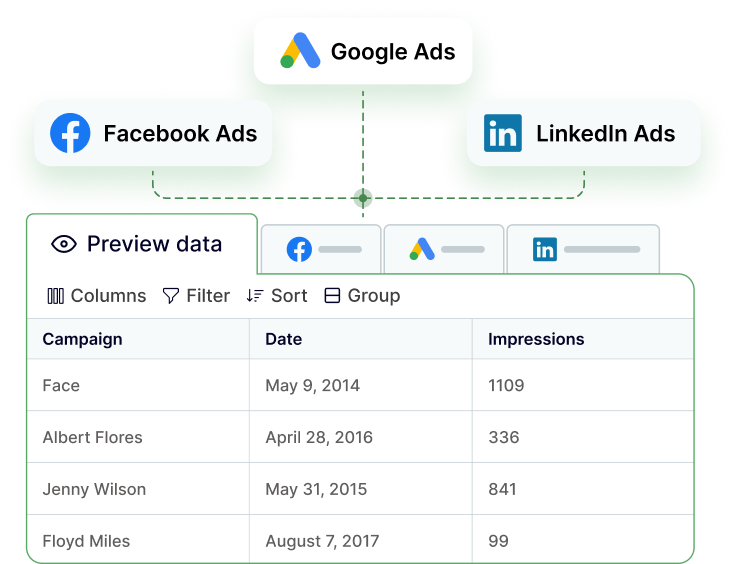
Format monitoring metrics for optimal visualization performance in Looker Studio, with properly structured dimensions and measures that enable interactive filtering, drill-down capabilities, and dynamic dashboard functionality.
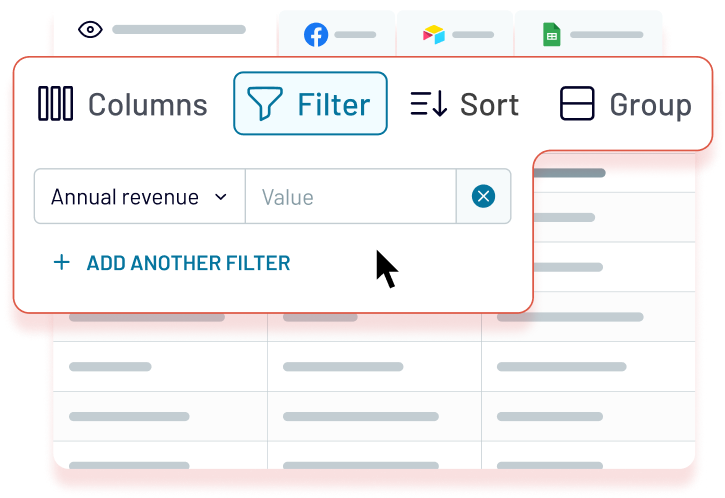
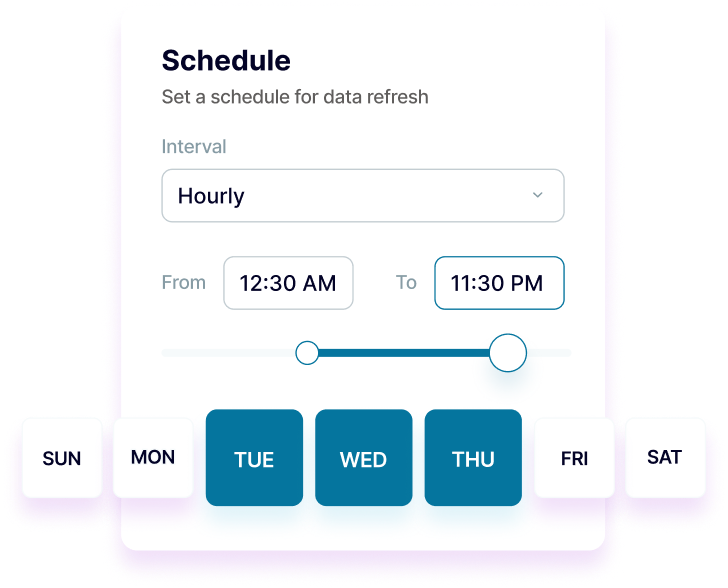
Keep Looker Studio dashboards up-to-date with automated data updates from monthly to 15-minute frequencies. Ensure stakeholders always view the latest operational performance through real-time visualizations and interactive reports.
Enhance your monitoring insights with Coupler.io AI integrations. Connect your operational datasets to AI tools for intelligent exploration of performance patterns and system optimization recommendations.


Why export Datadog to Looker Studio - real life cases
Executive operational dashboards
Client-facing SLA reporting
Cross-team performance visualization
Cost optimization storytelling
How to export Datadog to Looker Studio
Automate data exports with the no-code Datadog Looker Studio integration
Connect similar Project Management apps and get data in minutes
Quick start with dashboard templates
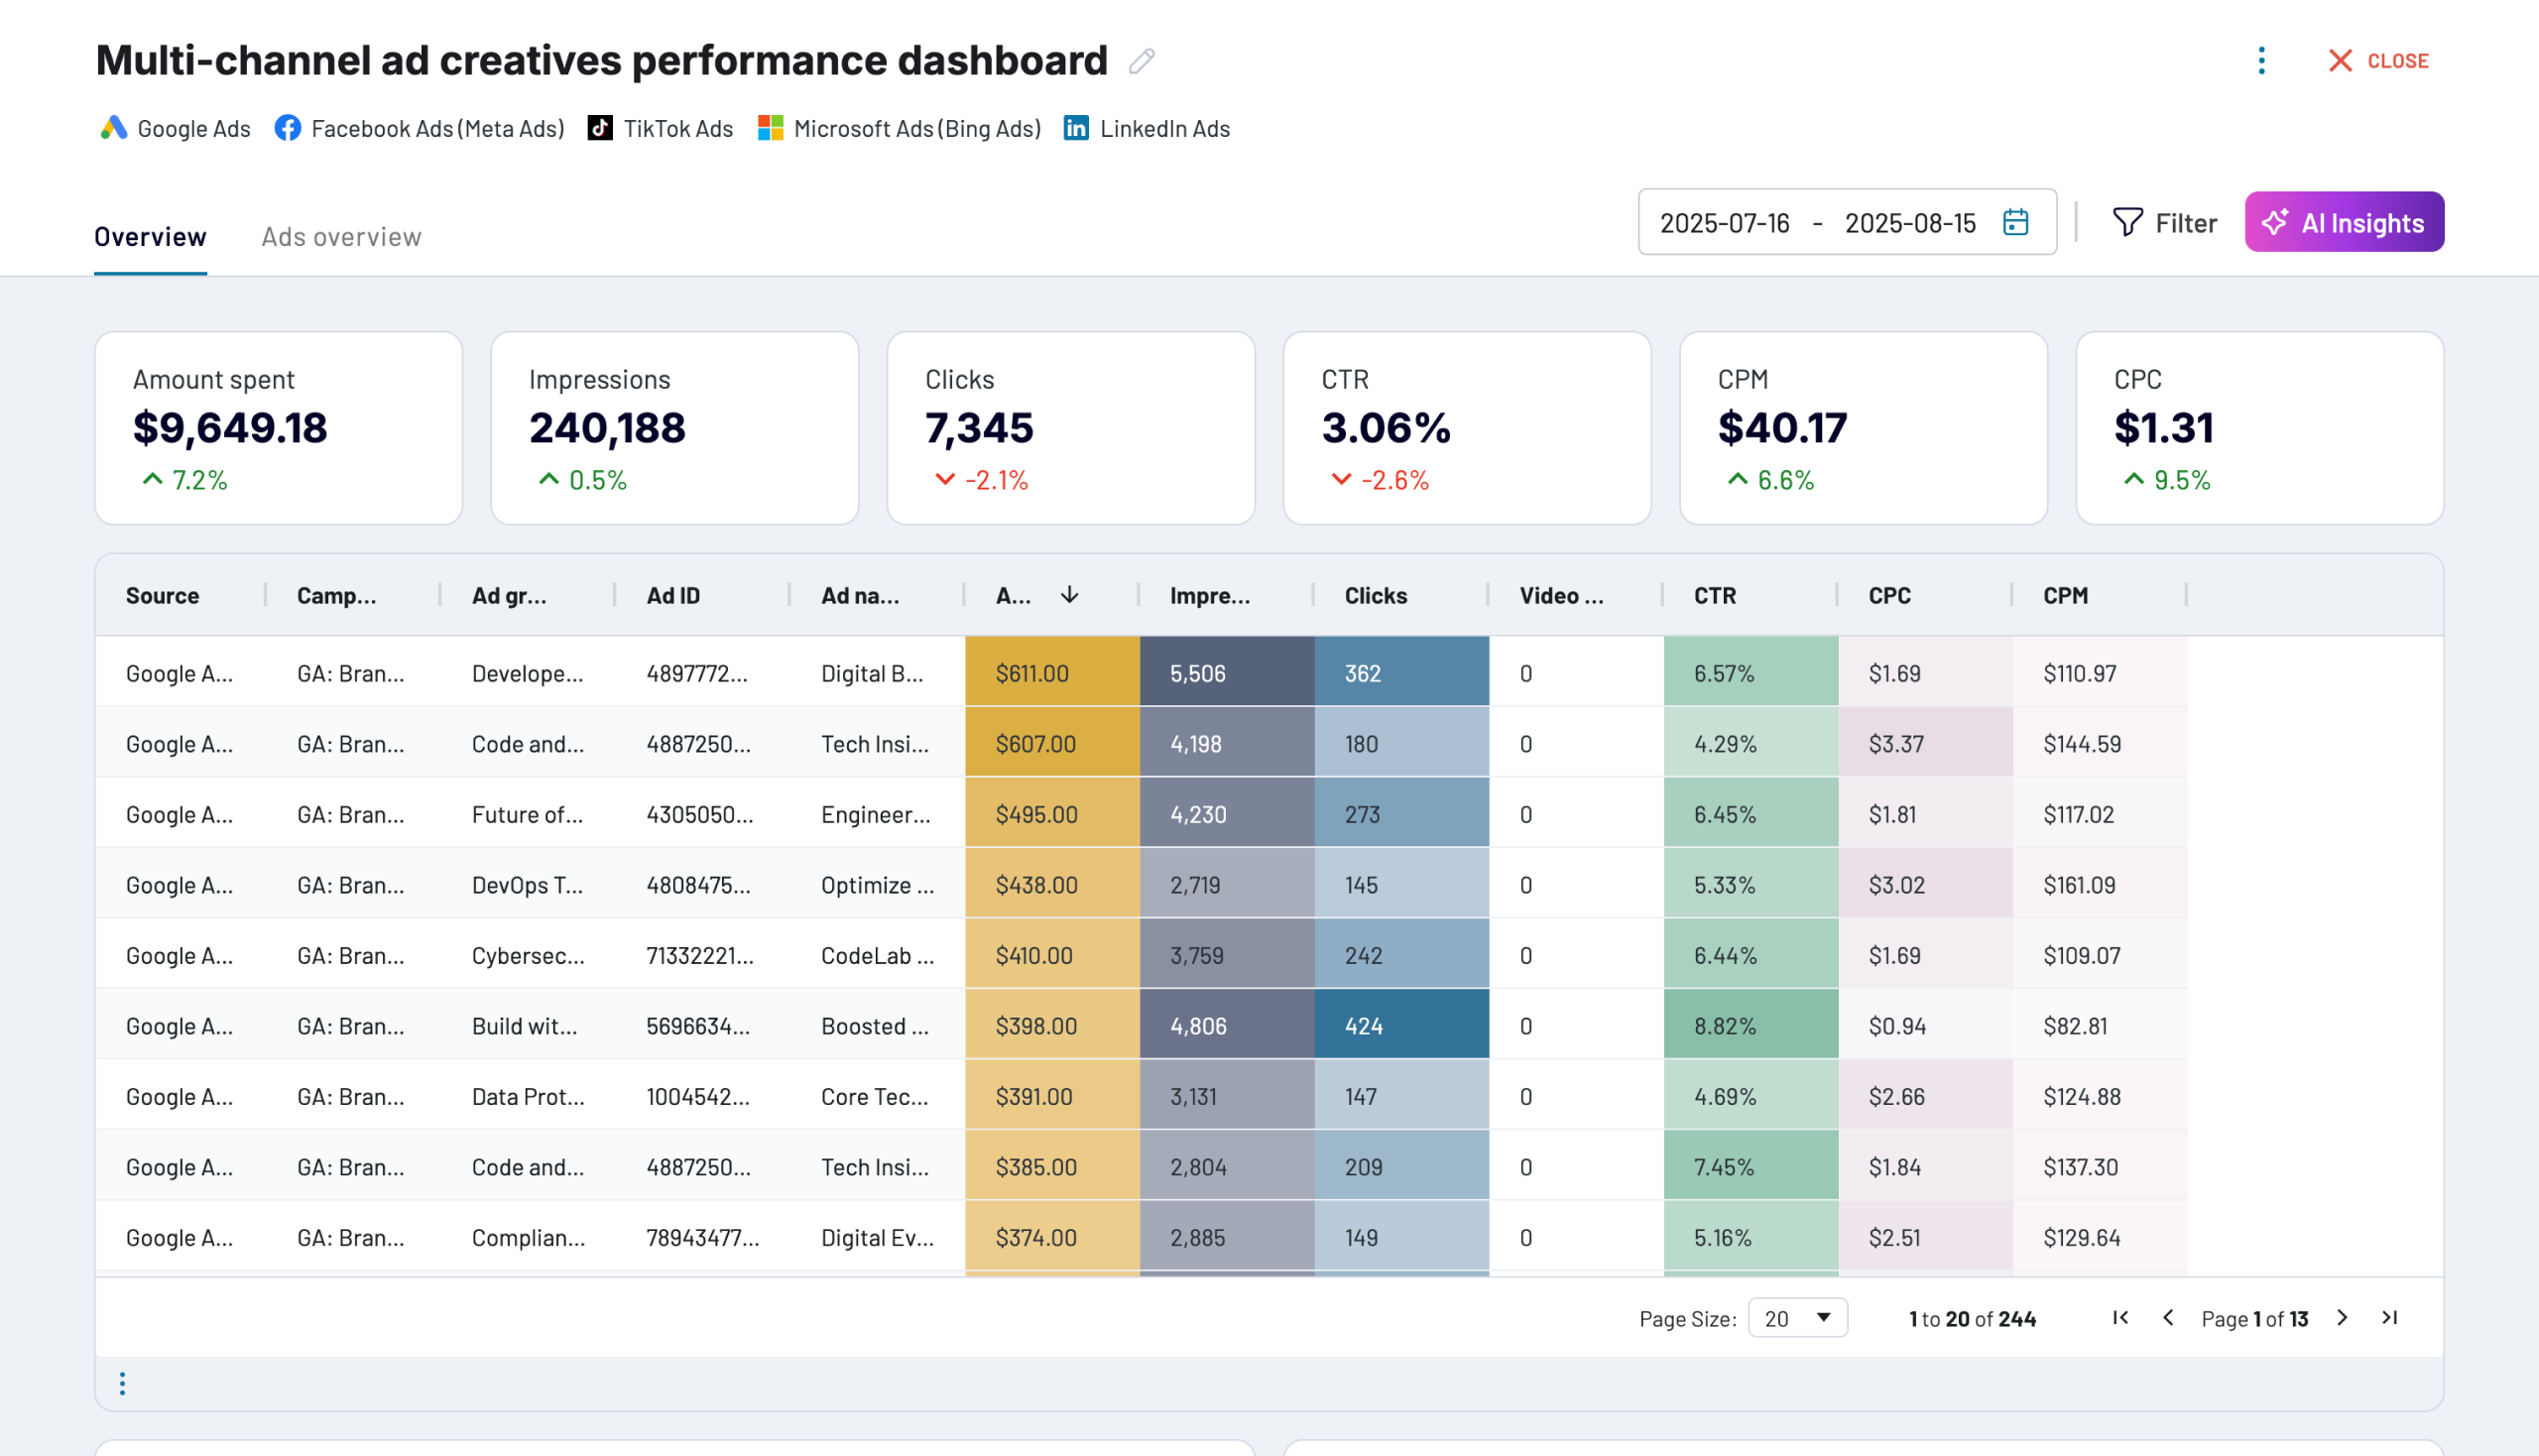


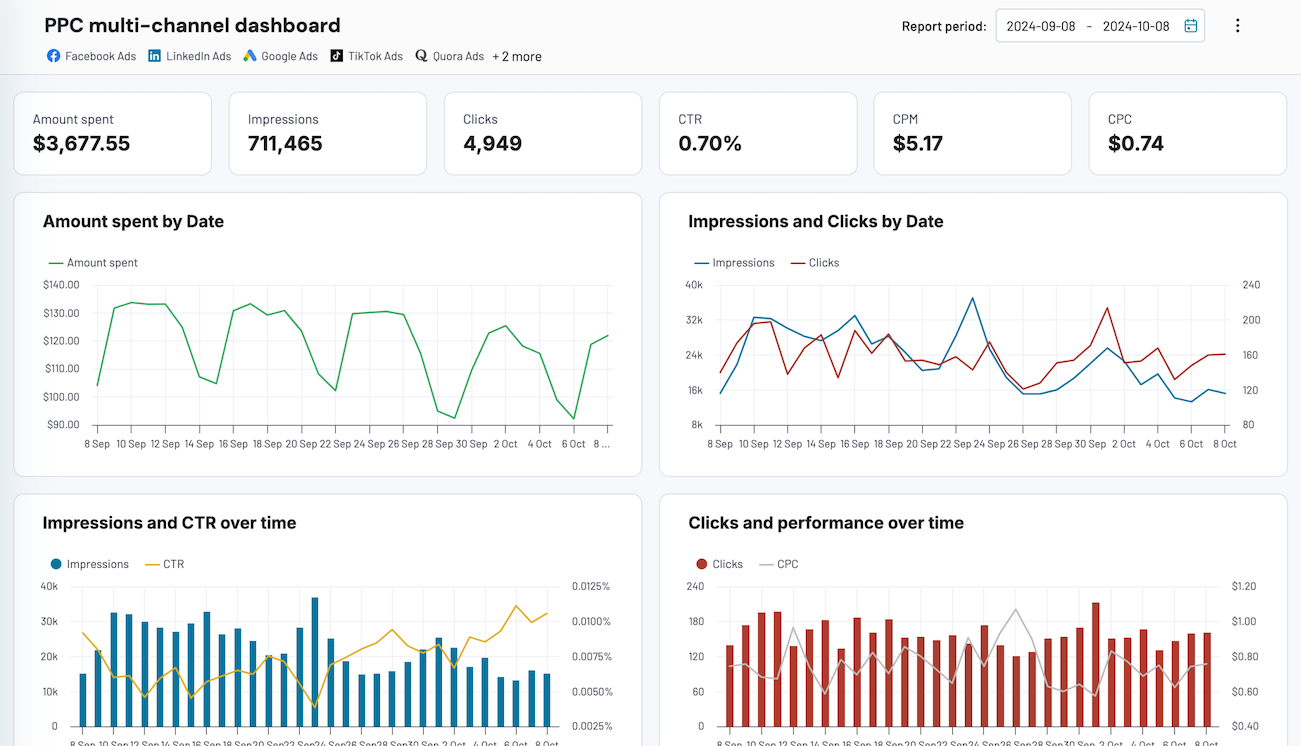


 +3
+3


 +6
+6

about your case. It doesn't cost you a penny 😉
Talk to AI about your Datadog data
Examples of questions you can ask about Datadog data:
- "Create visualizations showing seasonal patterns in our system performance and resource usage"
- "What are the most effective chart types for presenting SLA compliance to different stakeholders?"
- "Identify optimal visual formats for displaying incident response times and resolution patterns"
- "Which services show the most compelling improvement stories and how should we visualize progress?"


Keep your data safe
Coupler.io safeguards your shared information and data transfers from breaches, leaks, and unauthorized disclosures.


