Sales dashboard examples for every need










































about your case. It doesn't cost you a penny 😉
Sales Team Performance dashboards
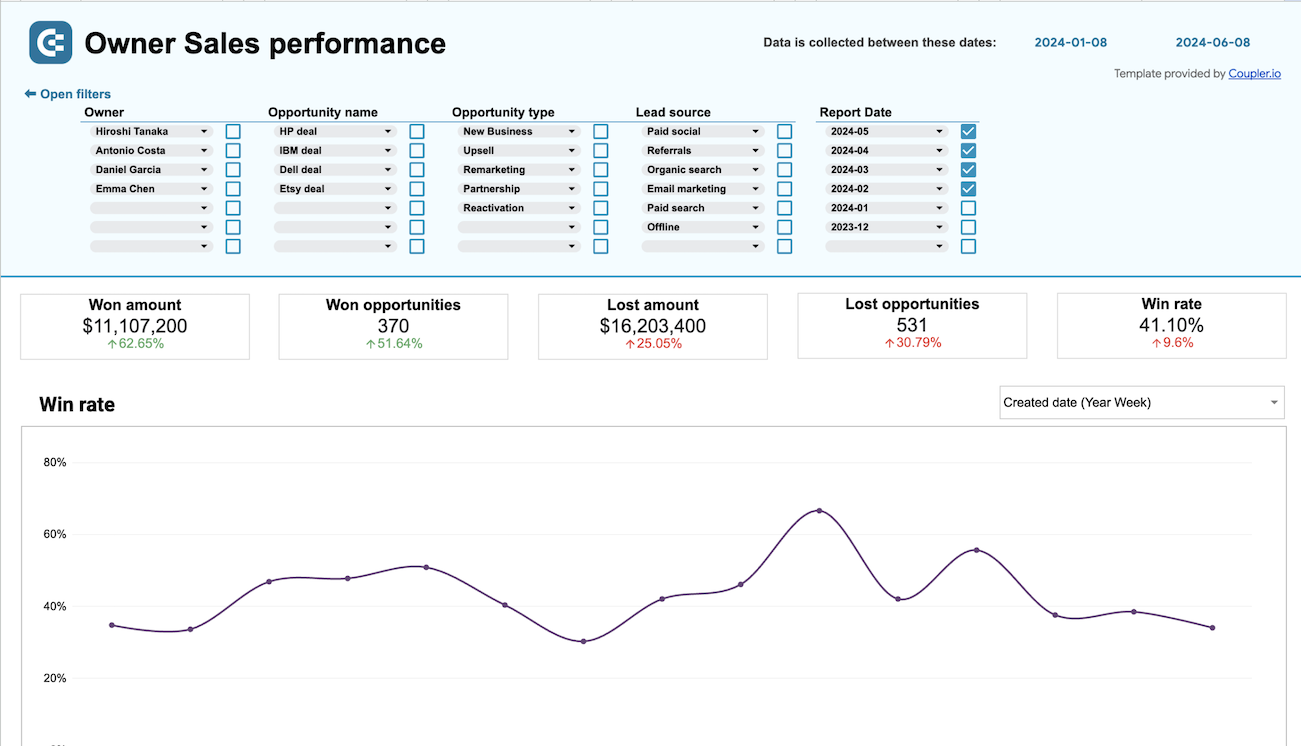
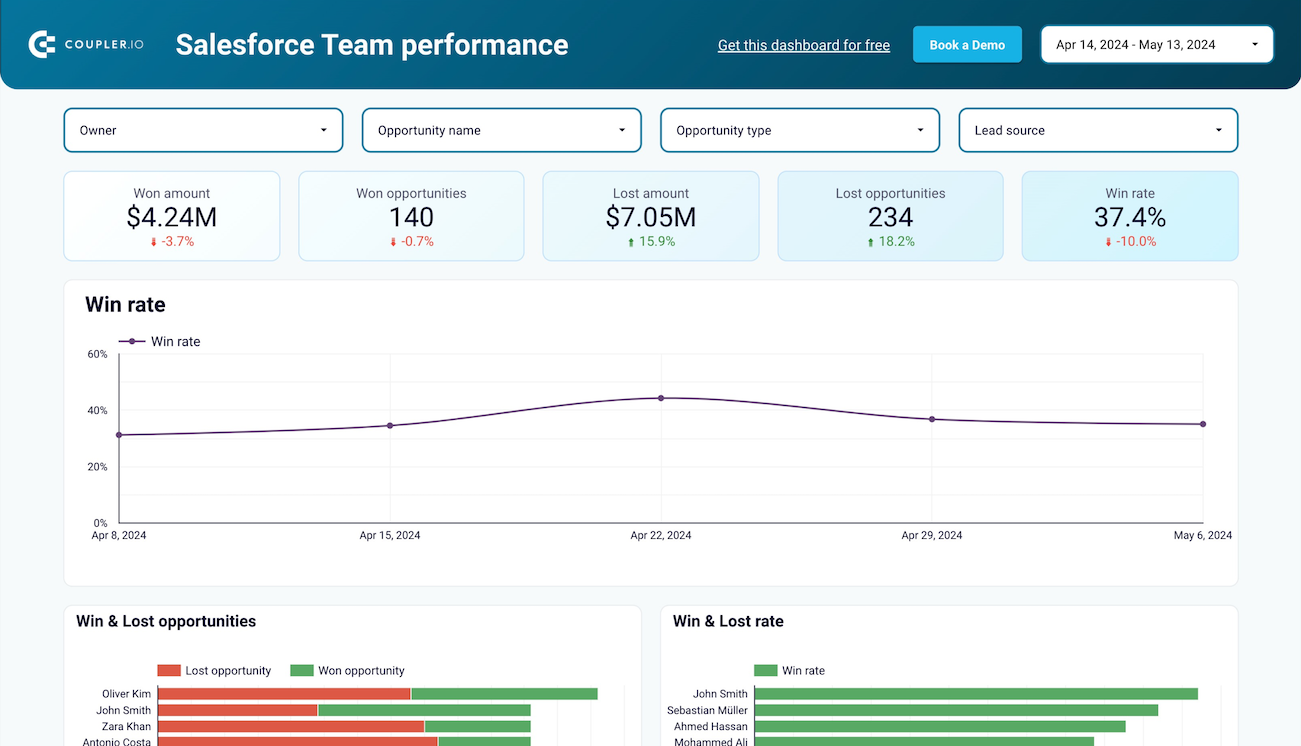
Monitor individual and collective productivity through comprehensive team analytics that track activities, deal closure rates, quota attainment, and performance comparisons. Our dashboards help identify top performers, coaching opportunities, and resource allocation needs while providing visibility into workload distribution and achievement trends across your sales organization.
Sales Funnel dashboards
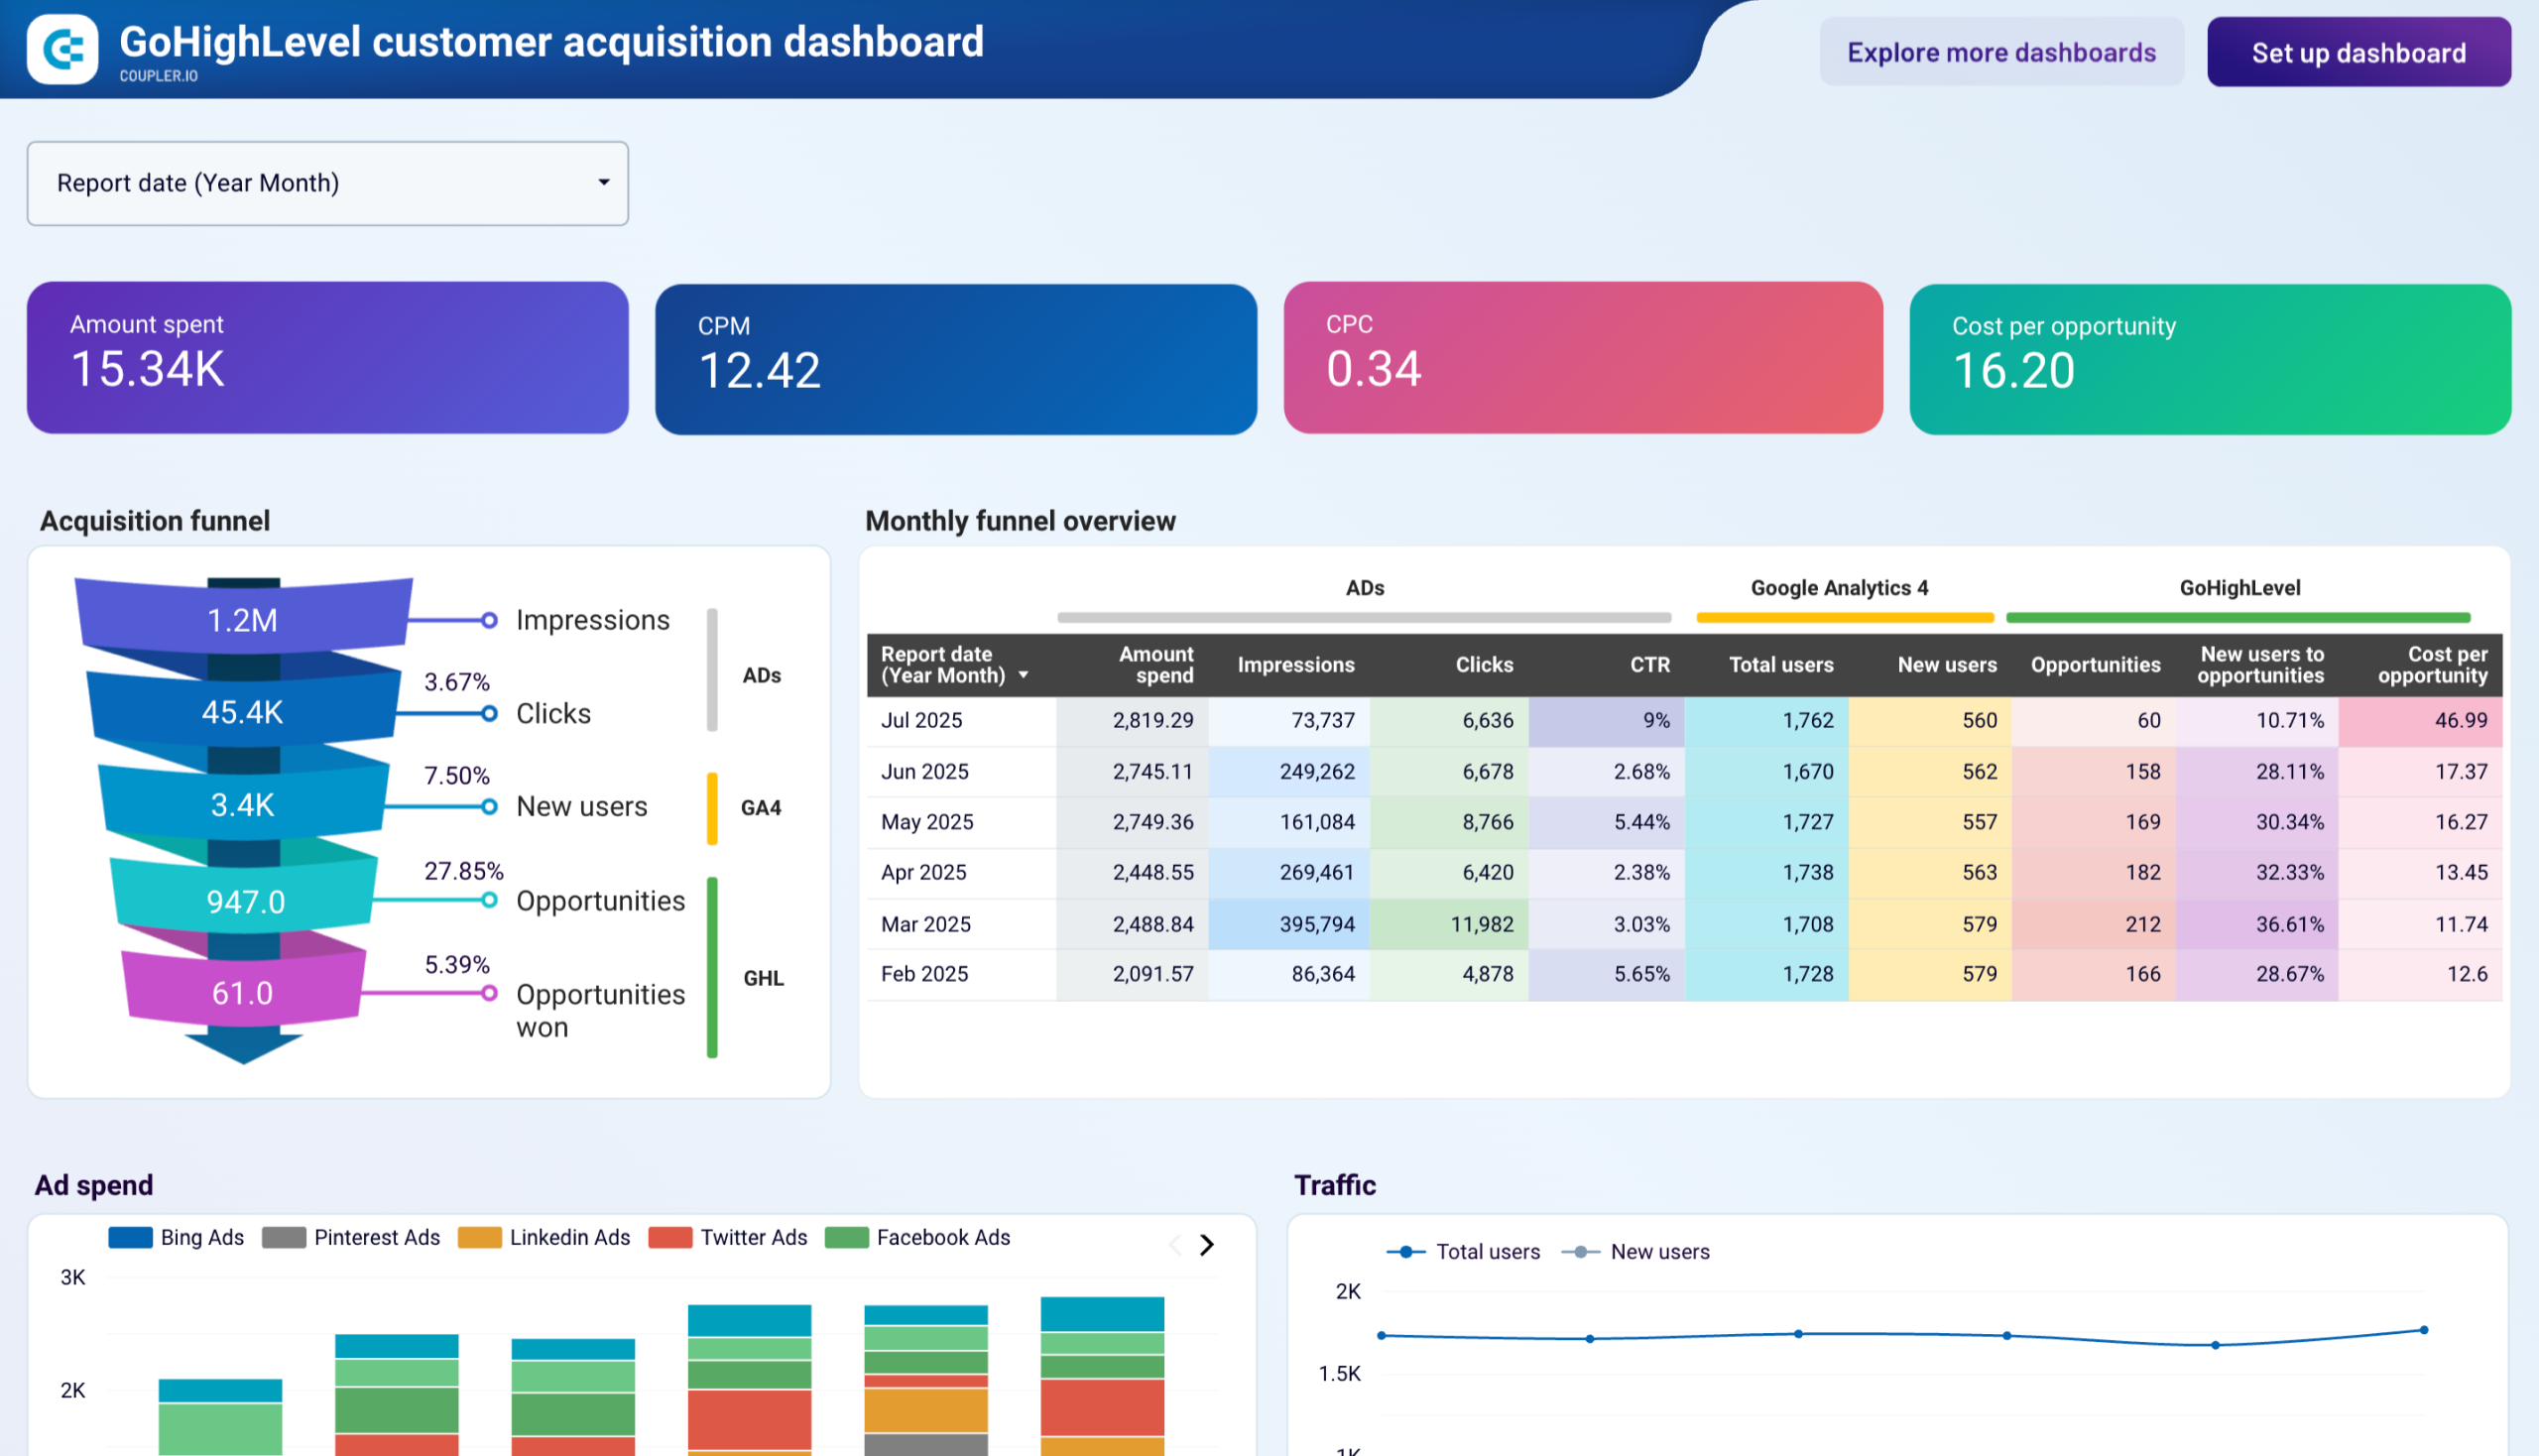
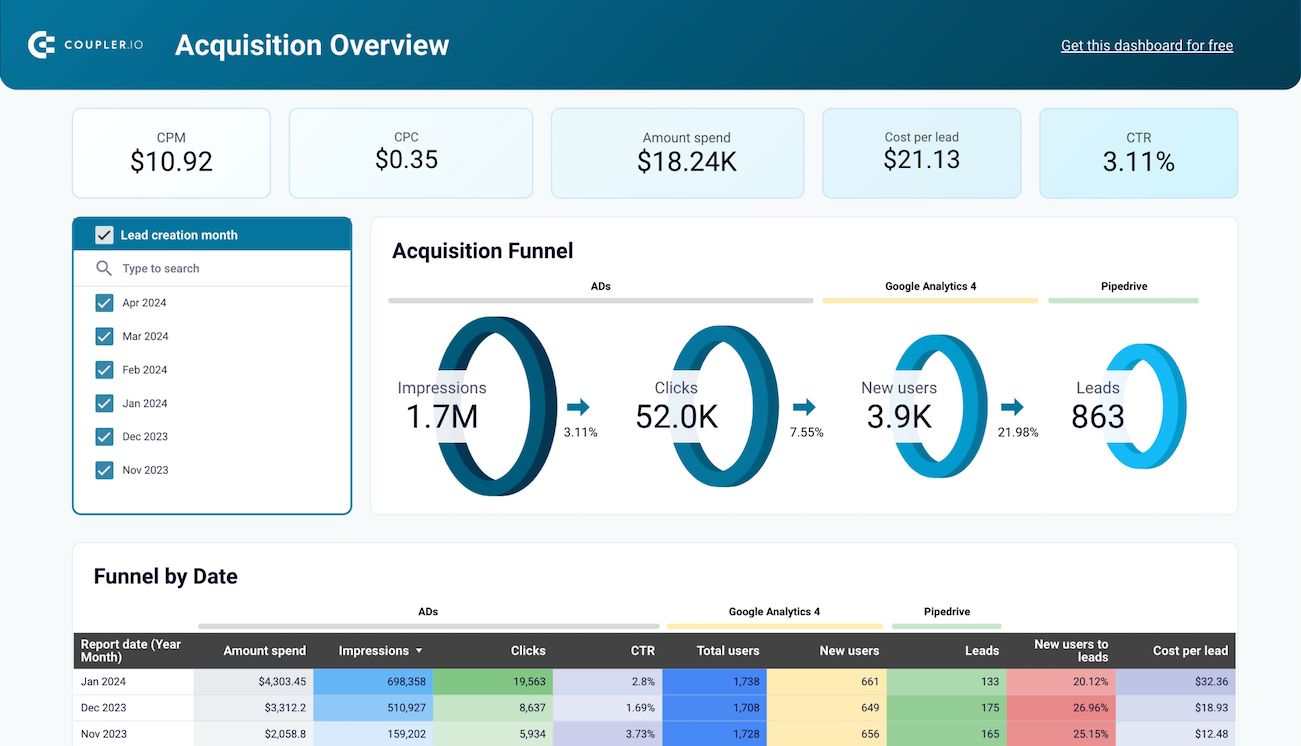
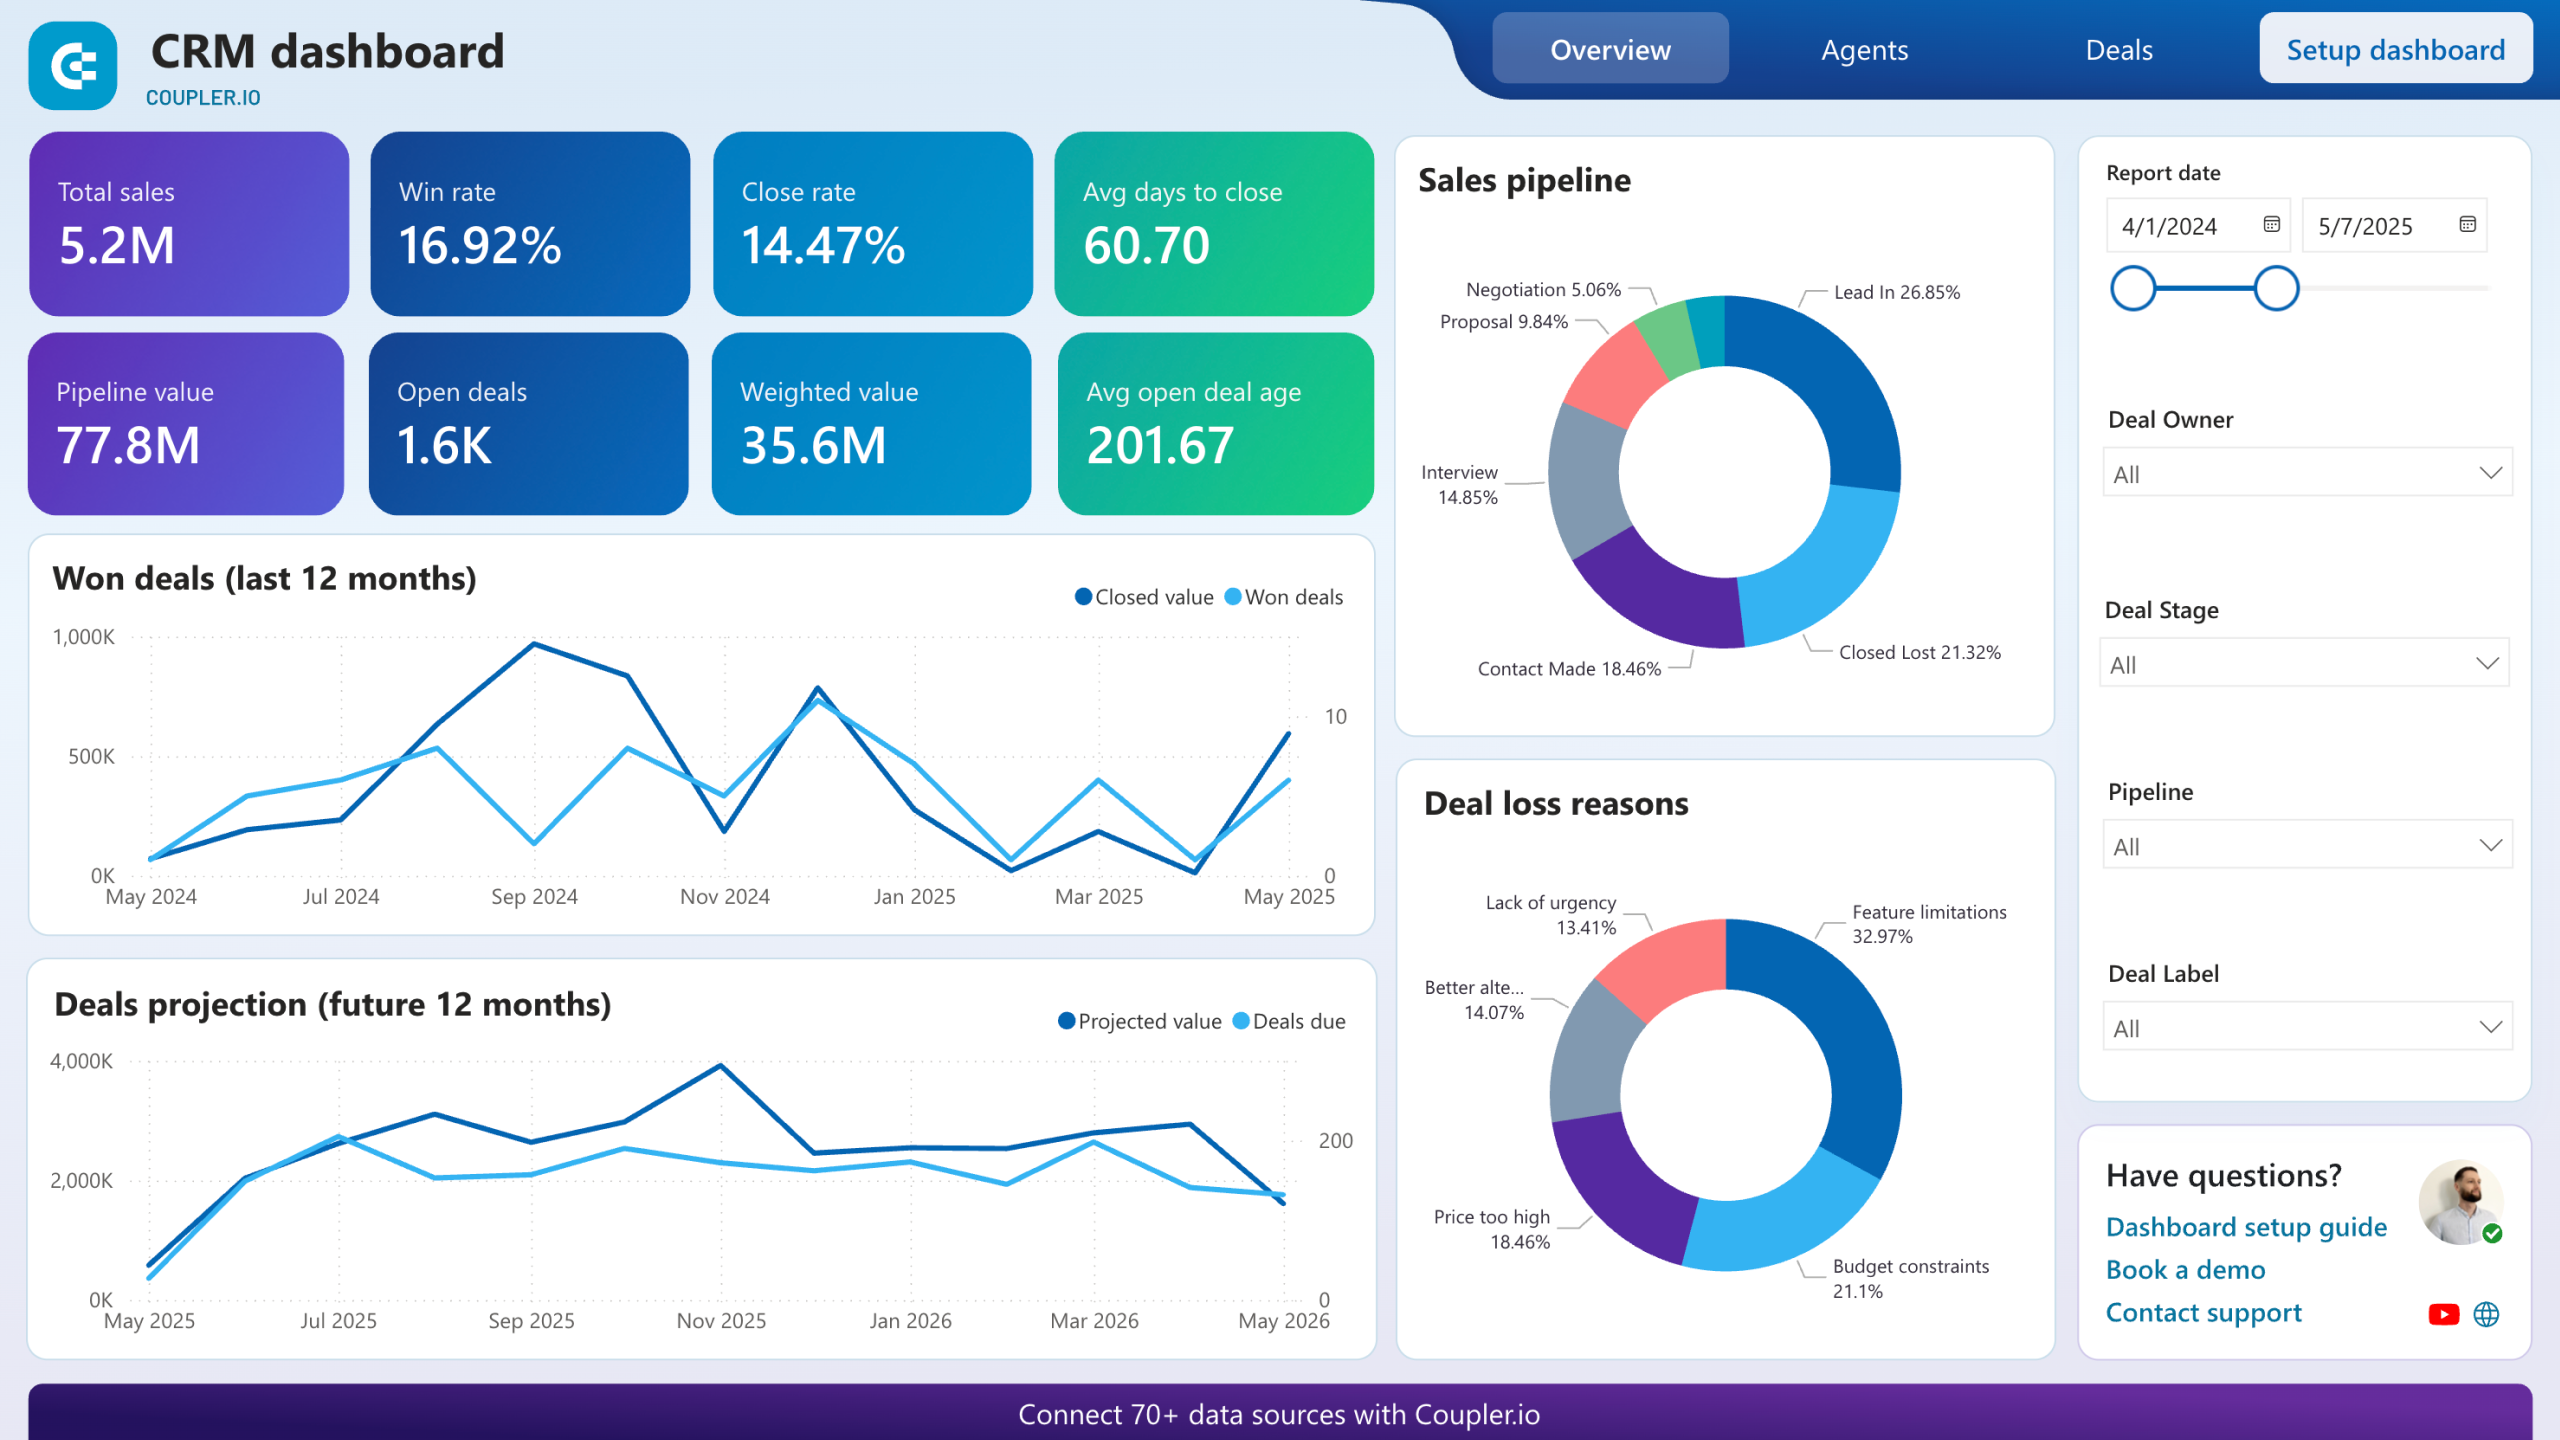
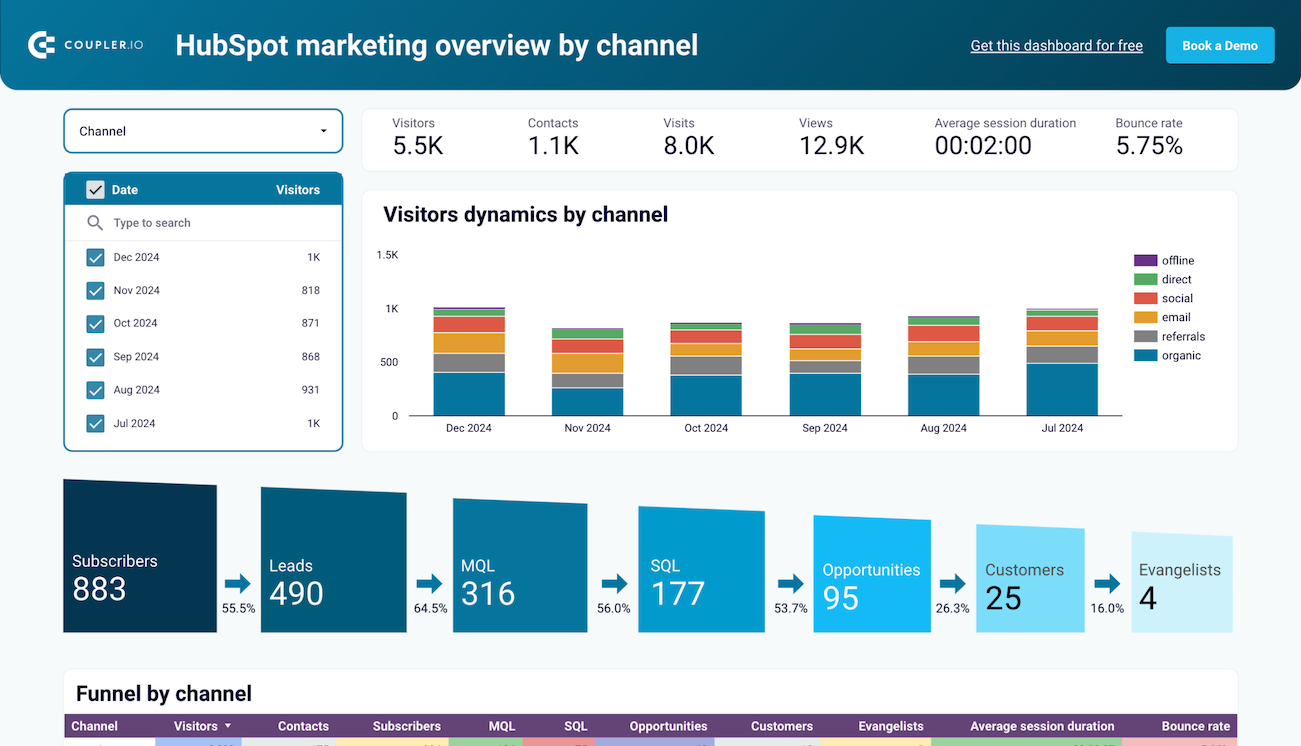
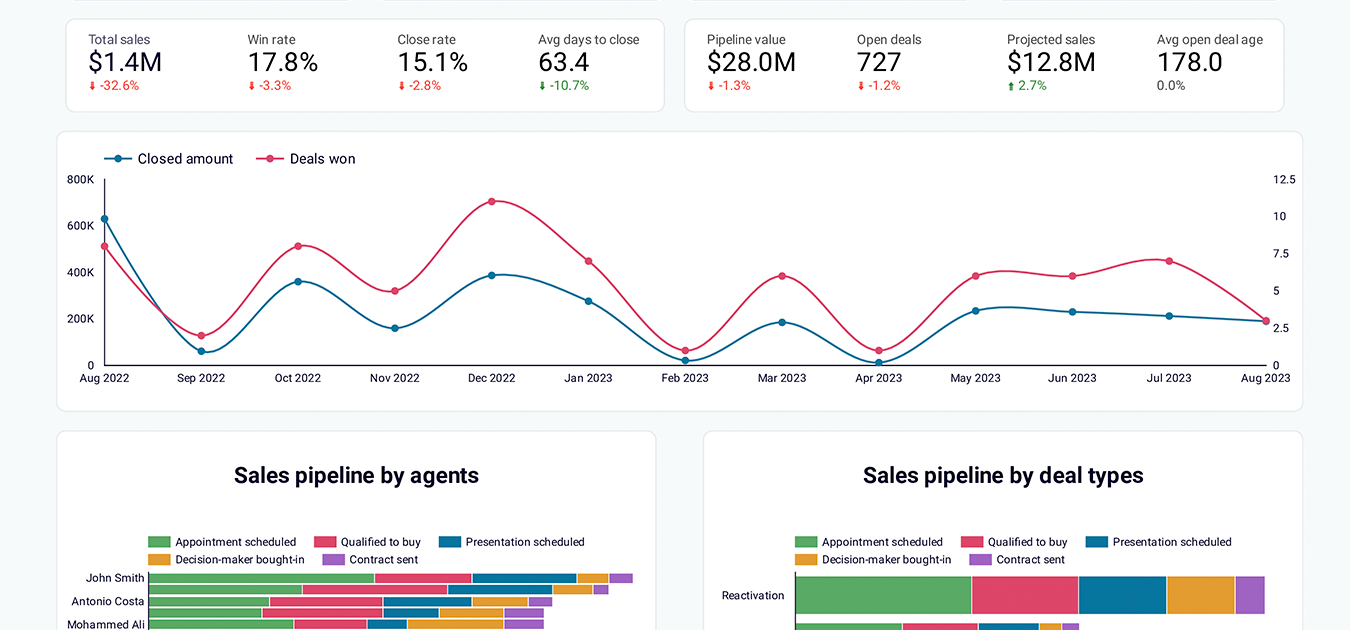
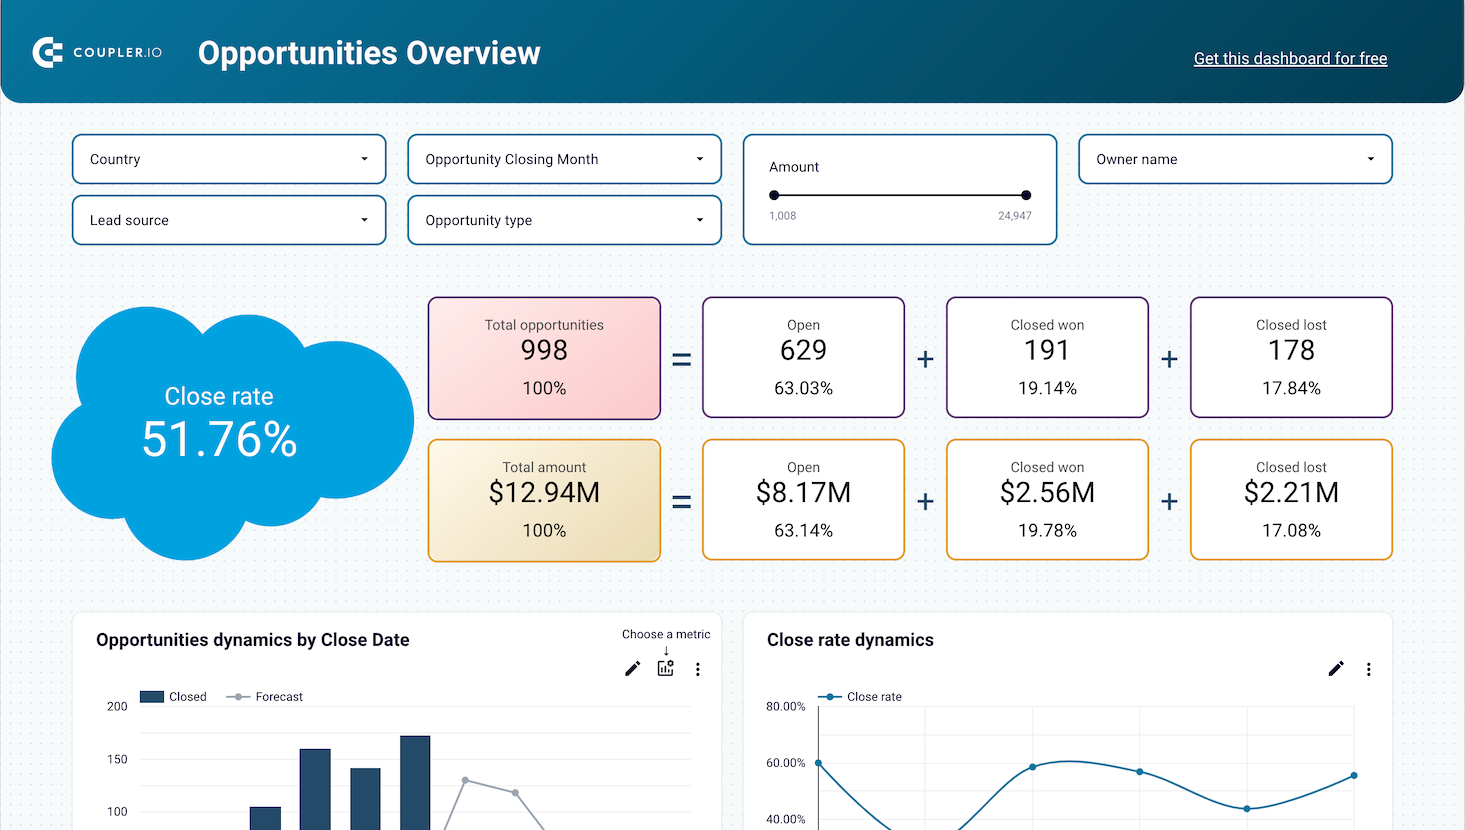
Visualize the complete customer journey from lead generation through deal closure with detailed funnel analysis that reveals conversion rates, stage progression, and bottleneck identification. Track how prospects move through each sales stage, identify drop-off points, and optimize your sales process to improve overall pipeline efficiency and revenue generation.
Sales Analytics & KPI dashboards
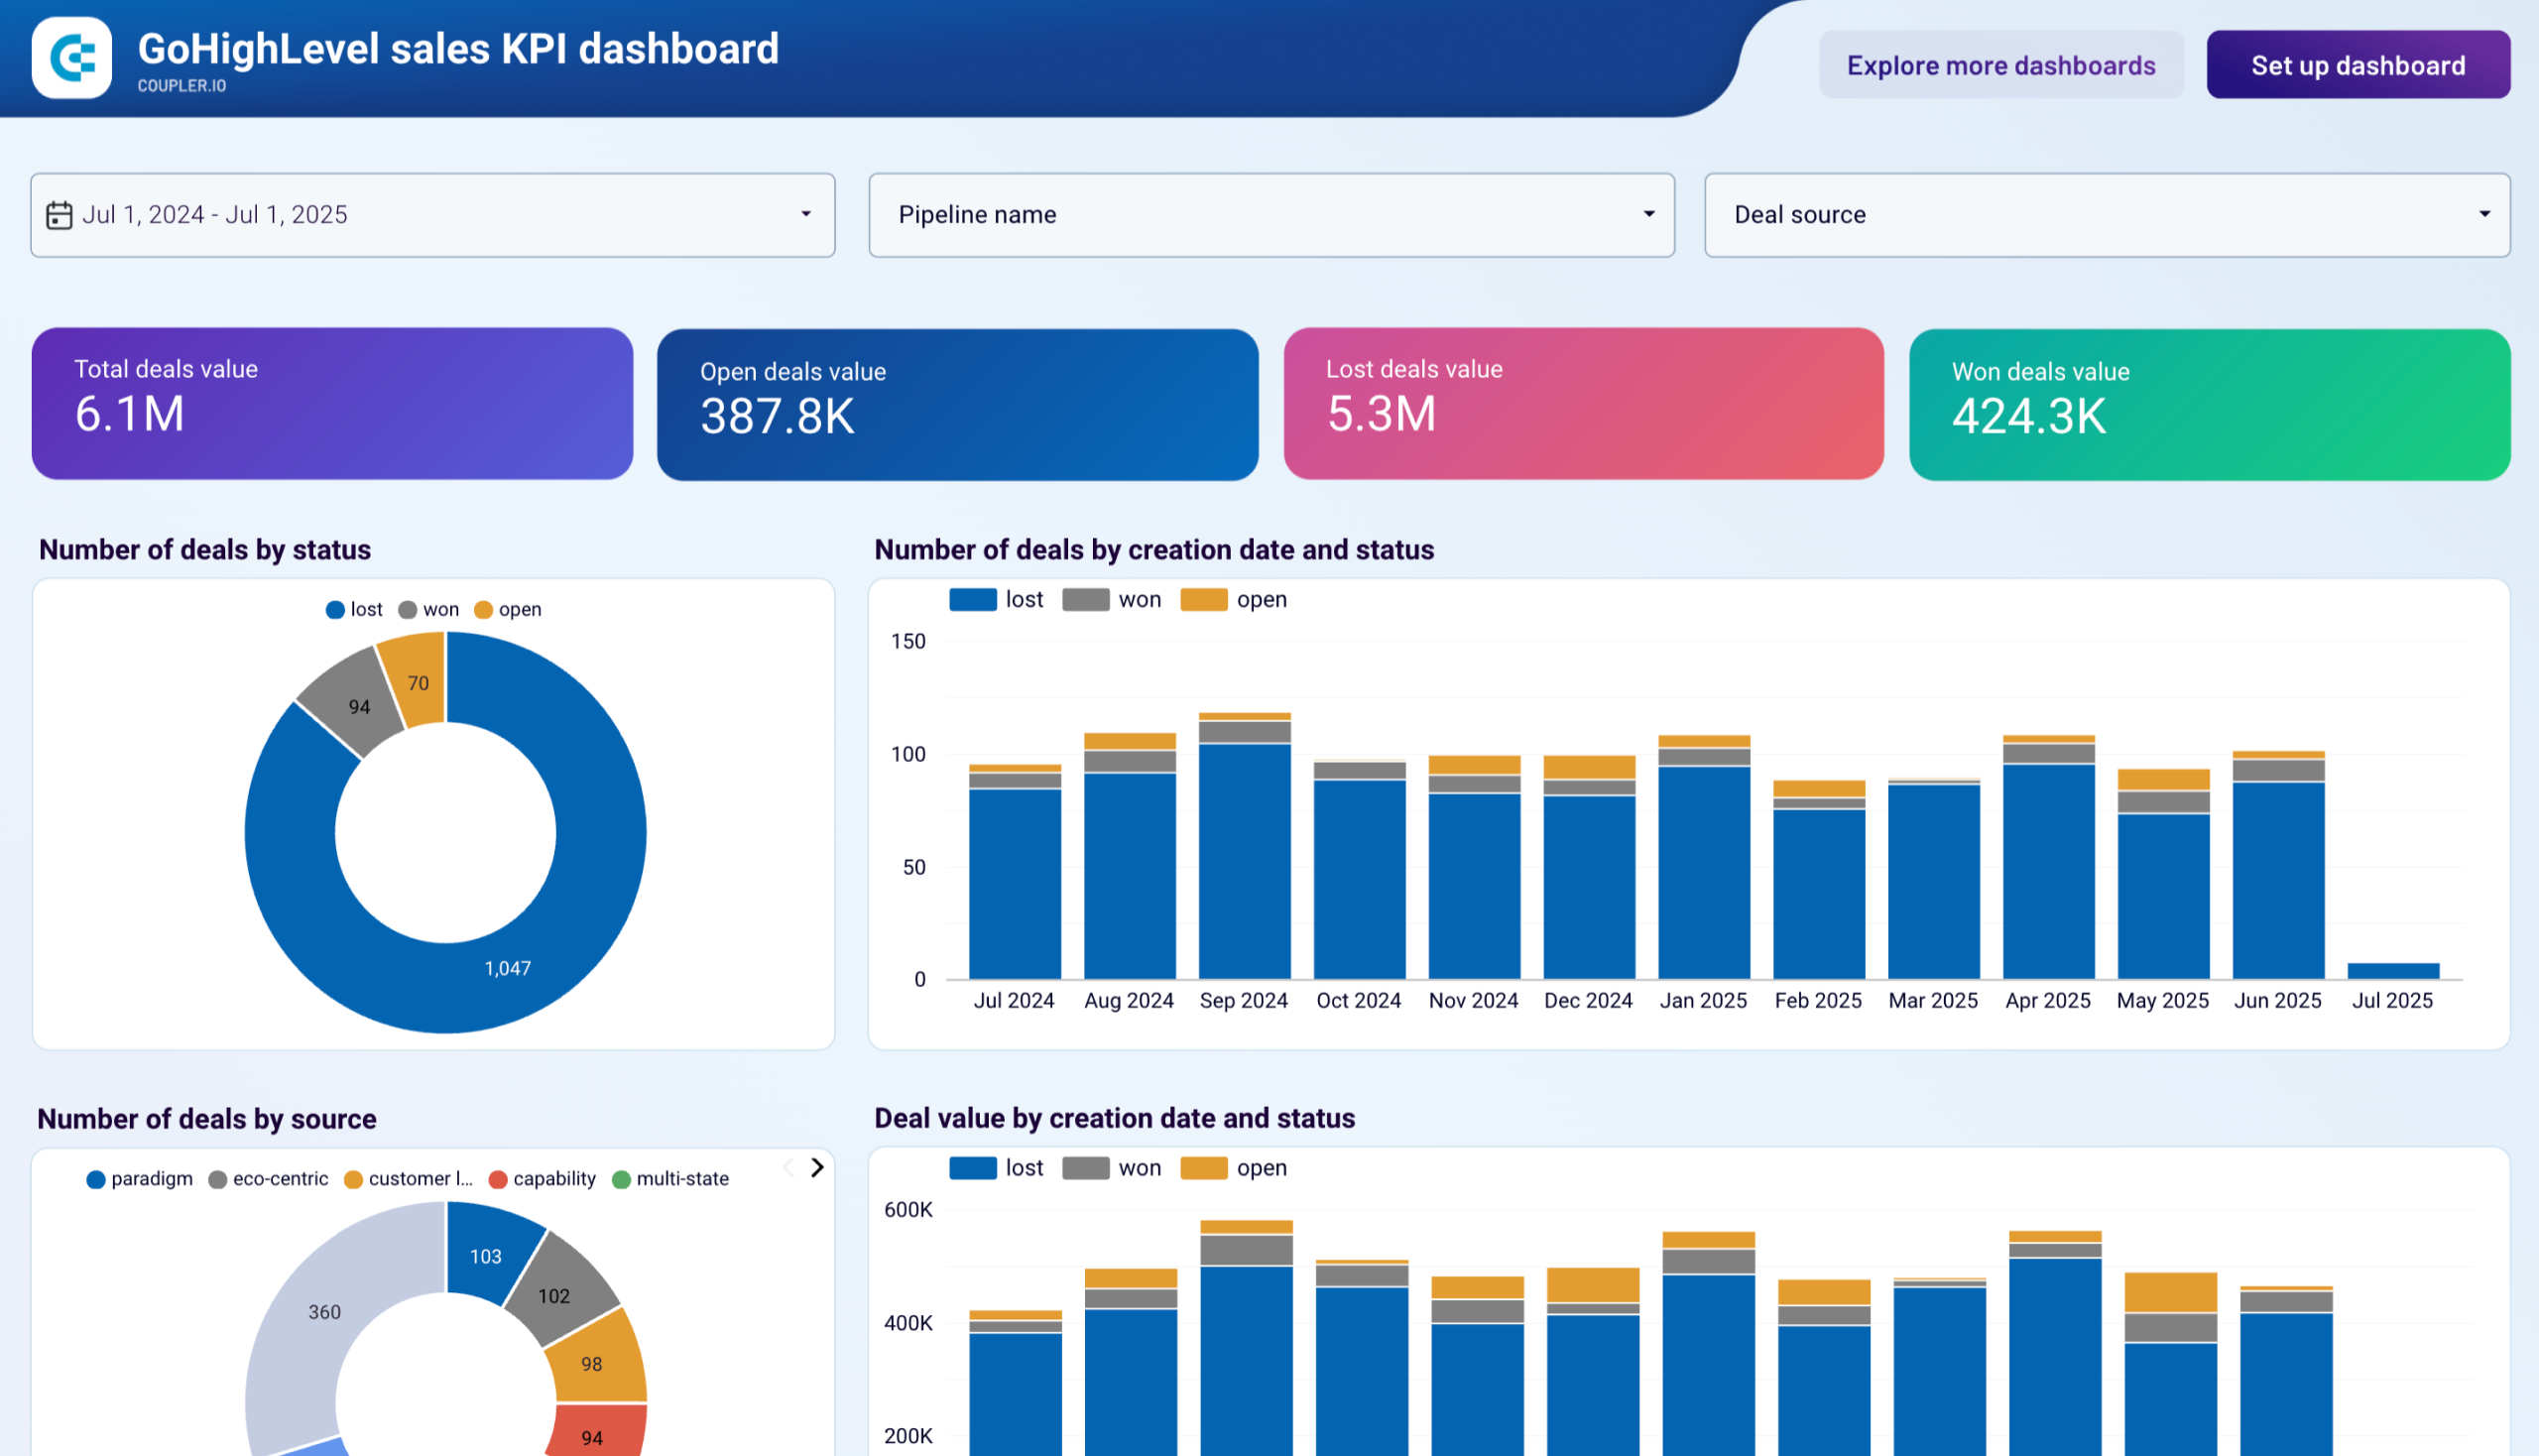
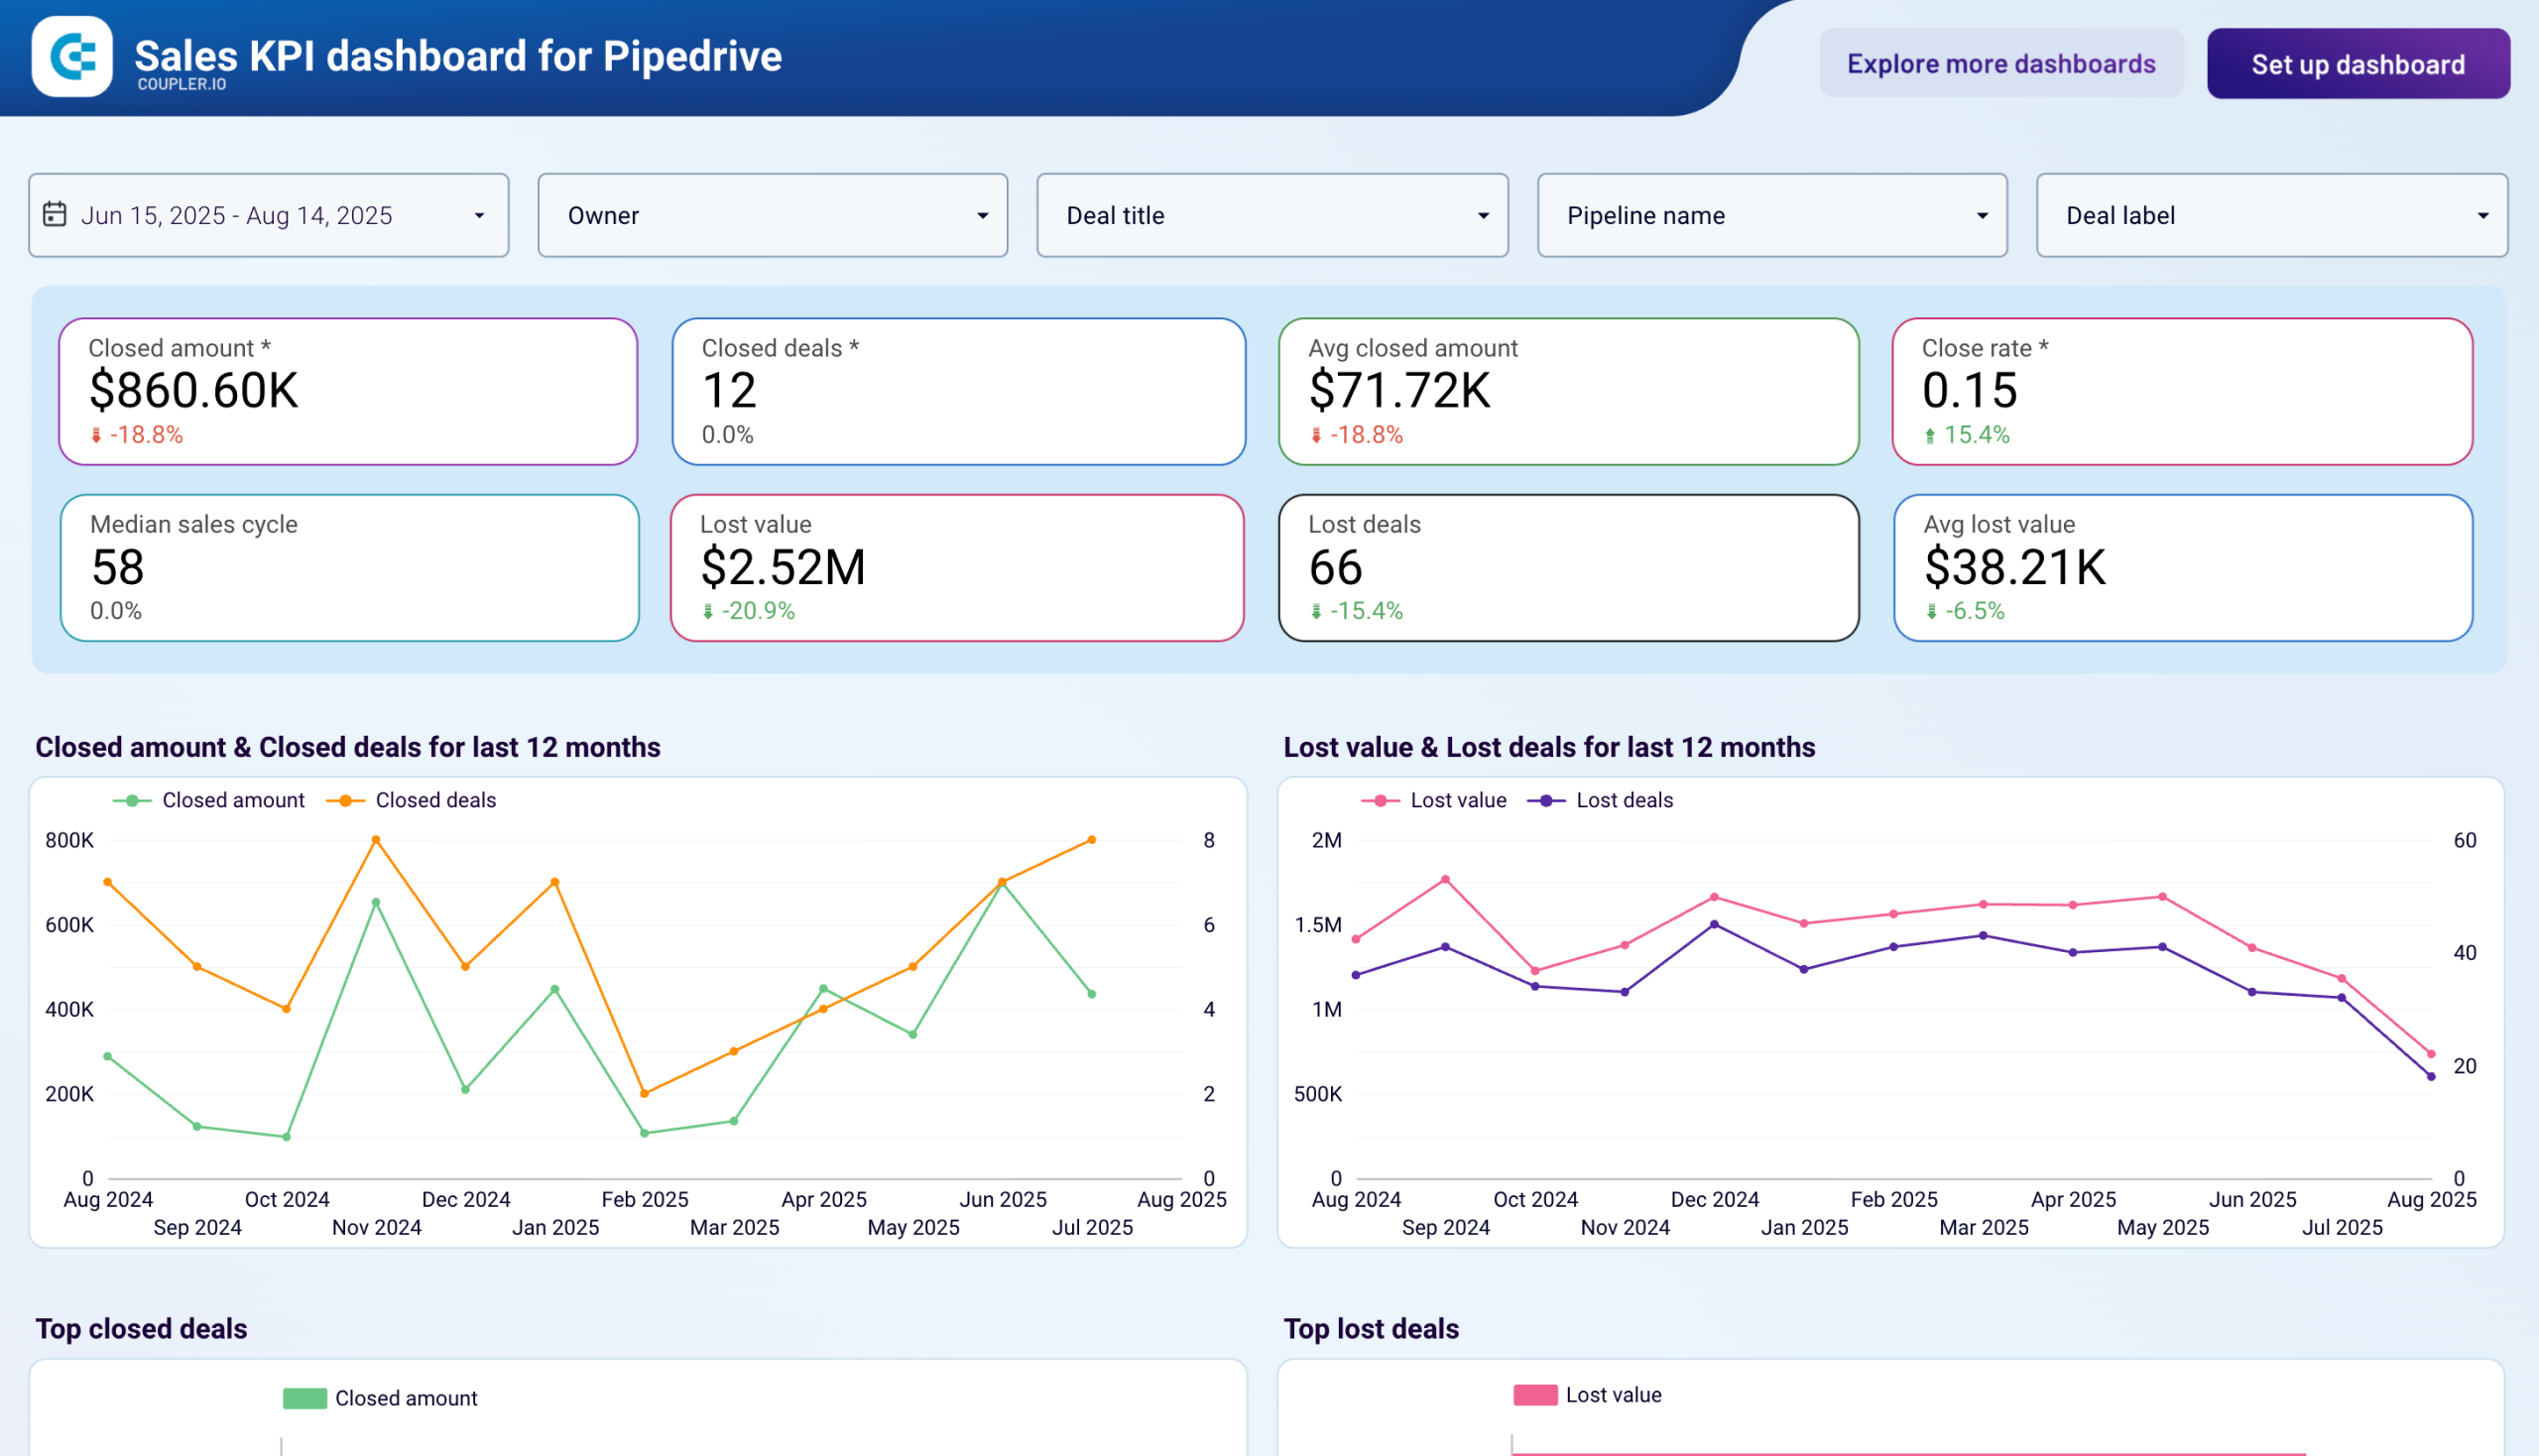
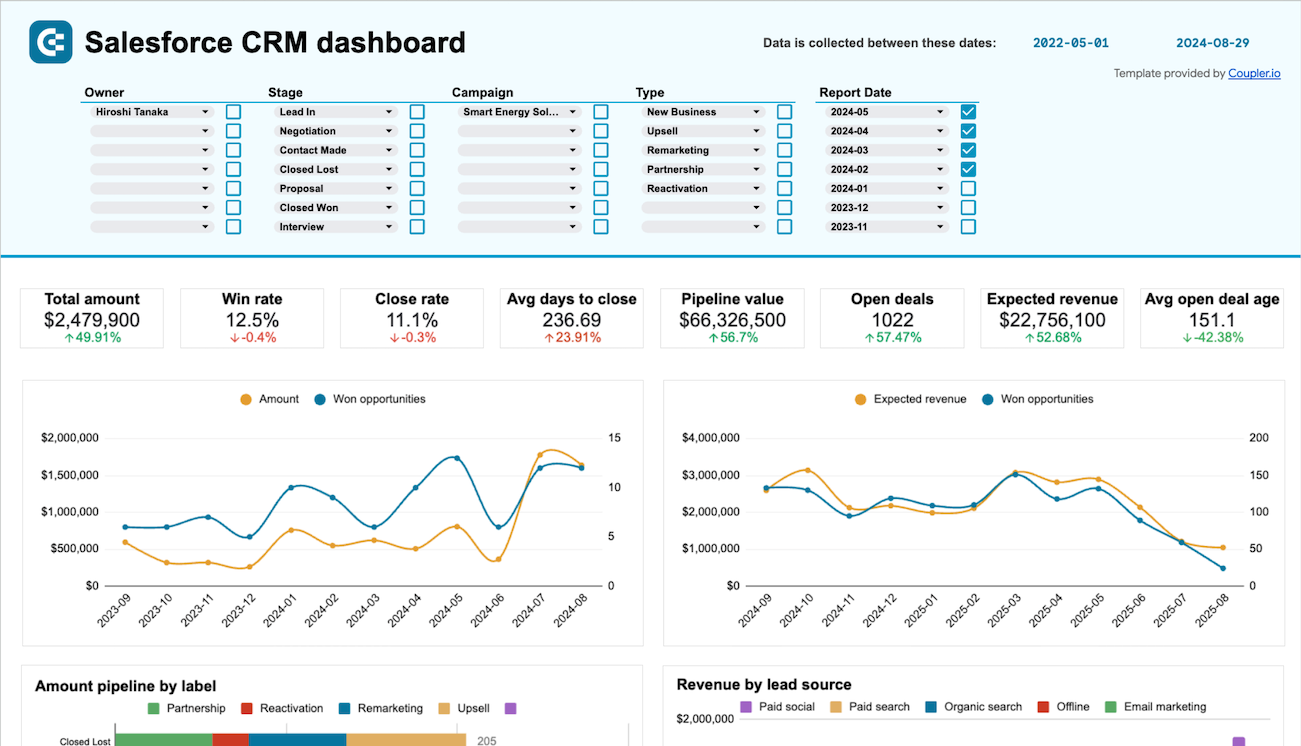
Combine essential performance indicators with advanced data analysis to track revenue targets, deal velocity, win rates, and sales cycle metrics while leveraging predictive insights for strategic optimization. These dashboards provide executive-level visibility into sales health through KPI monitoring and deep-dive analytics that reveal customer behavior patterns, competitive positioning, and revenue attribution for comprehensive data-driven decision-making.
Choose your Sales dashboard template to kick off
What is a sales dashboard?
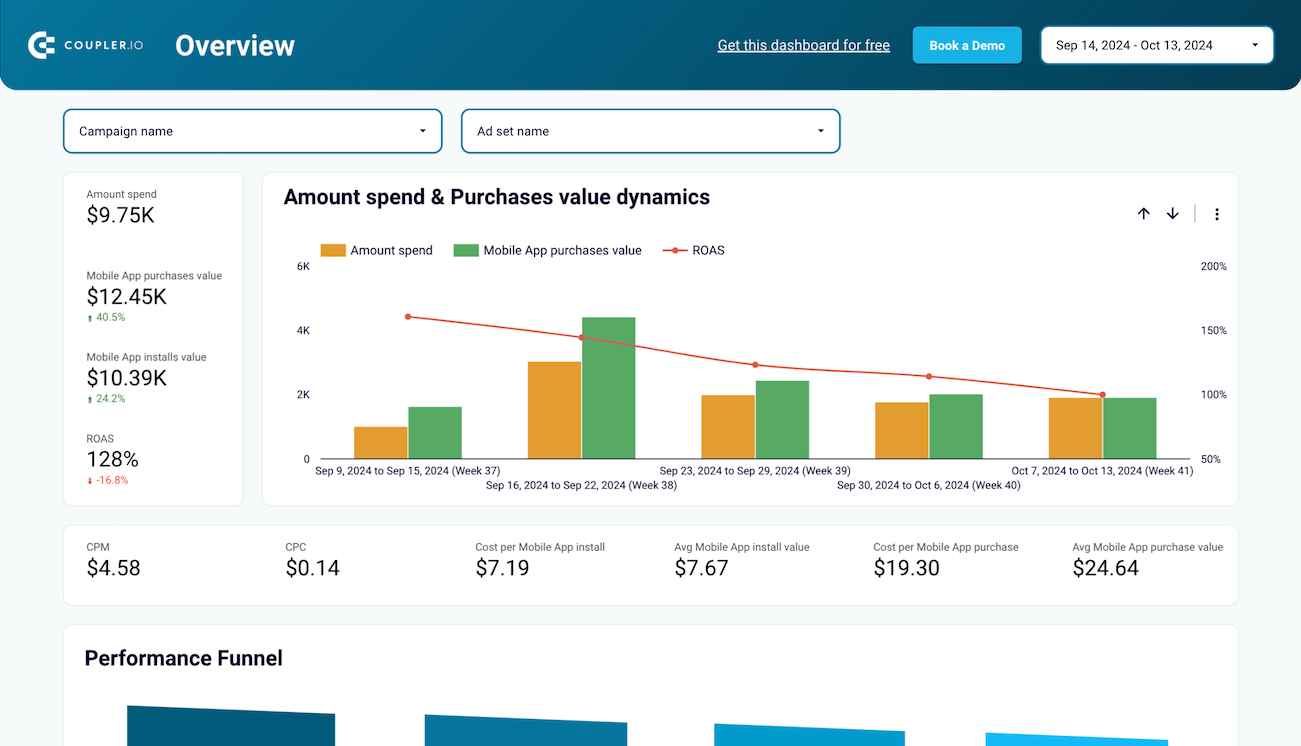
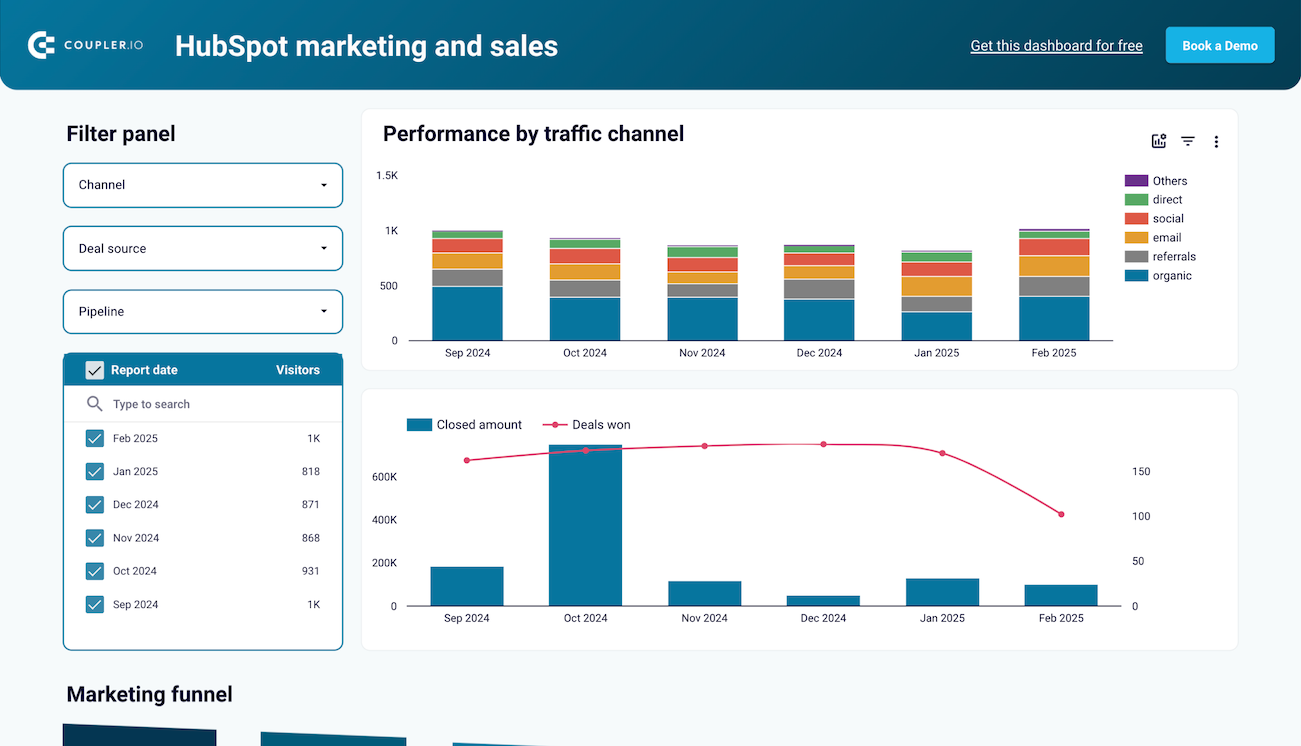
Sales dashboards streamline decision-making by presenting complex sales data through intuitive charts, tables, and scorecards that highlight opportunities, identify bottlenecks, and track team performance. Through automated data integration via Coupler.io, our sales reporting dashboards maintain current information without manual updates, enabling sales leaders to respond quickly to changing conditions and optimize their strategies based on real-time insights rather than outdated reports.

What should a sales reporting dashboard include?
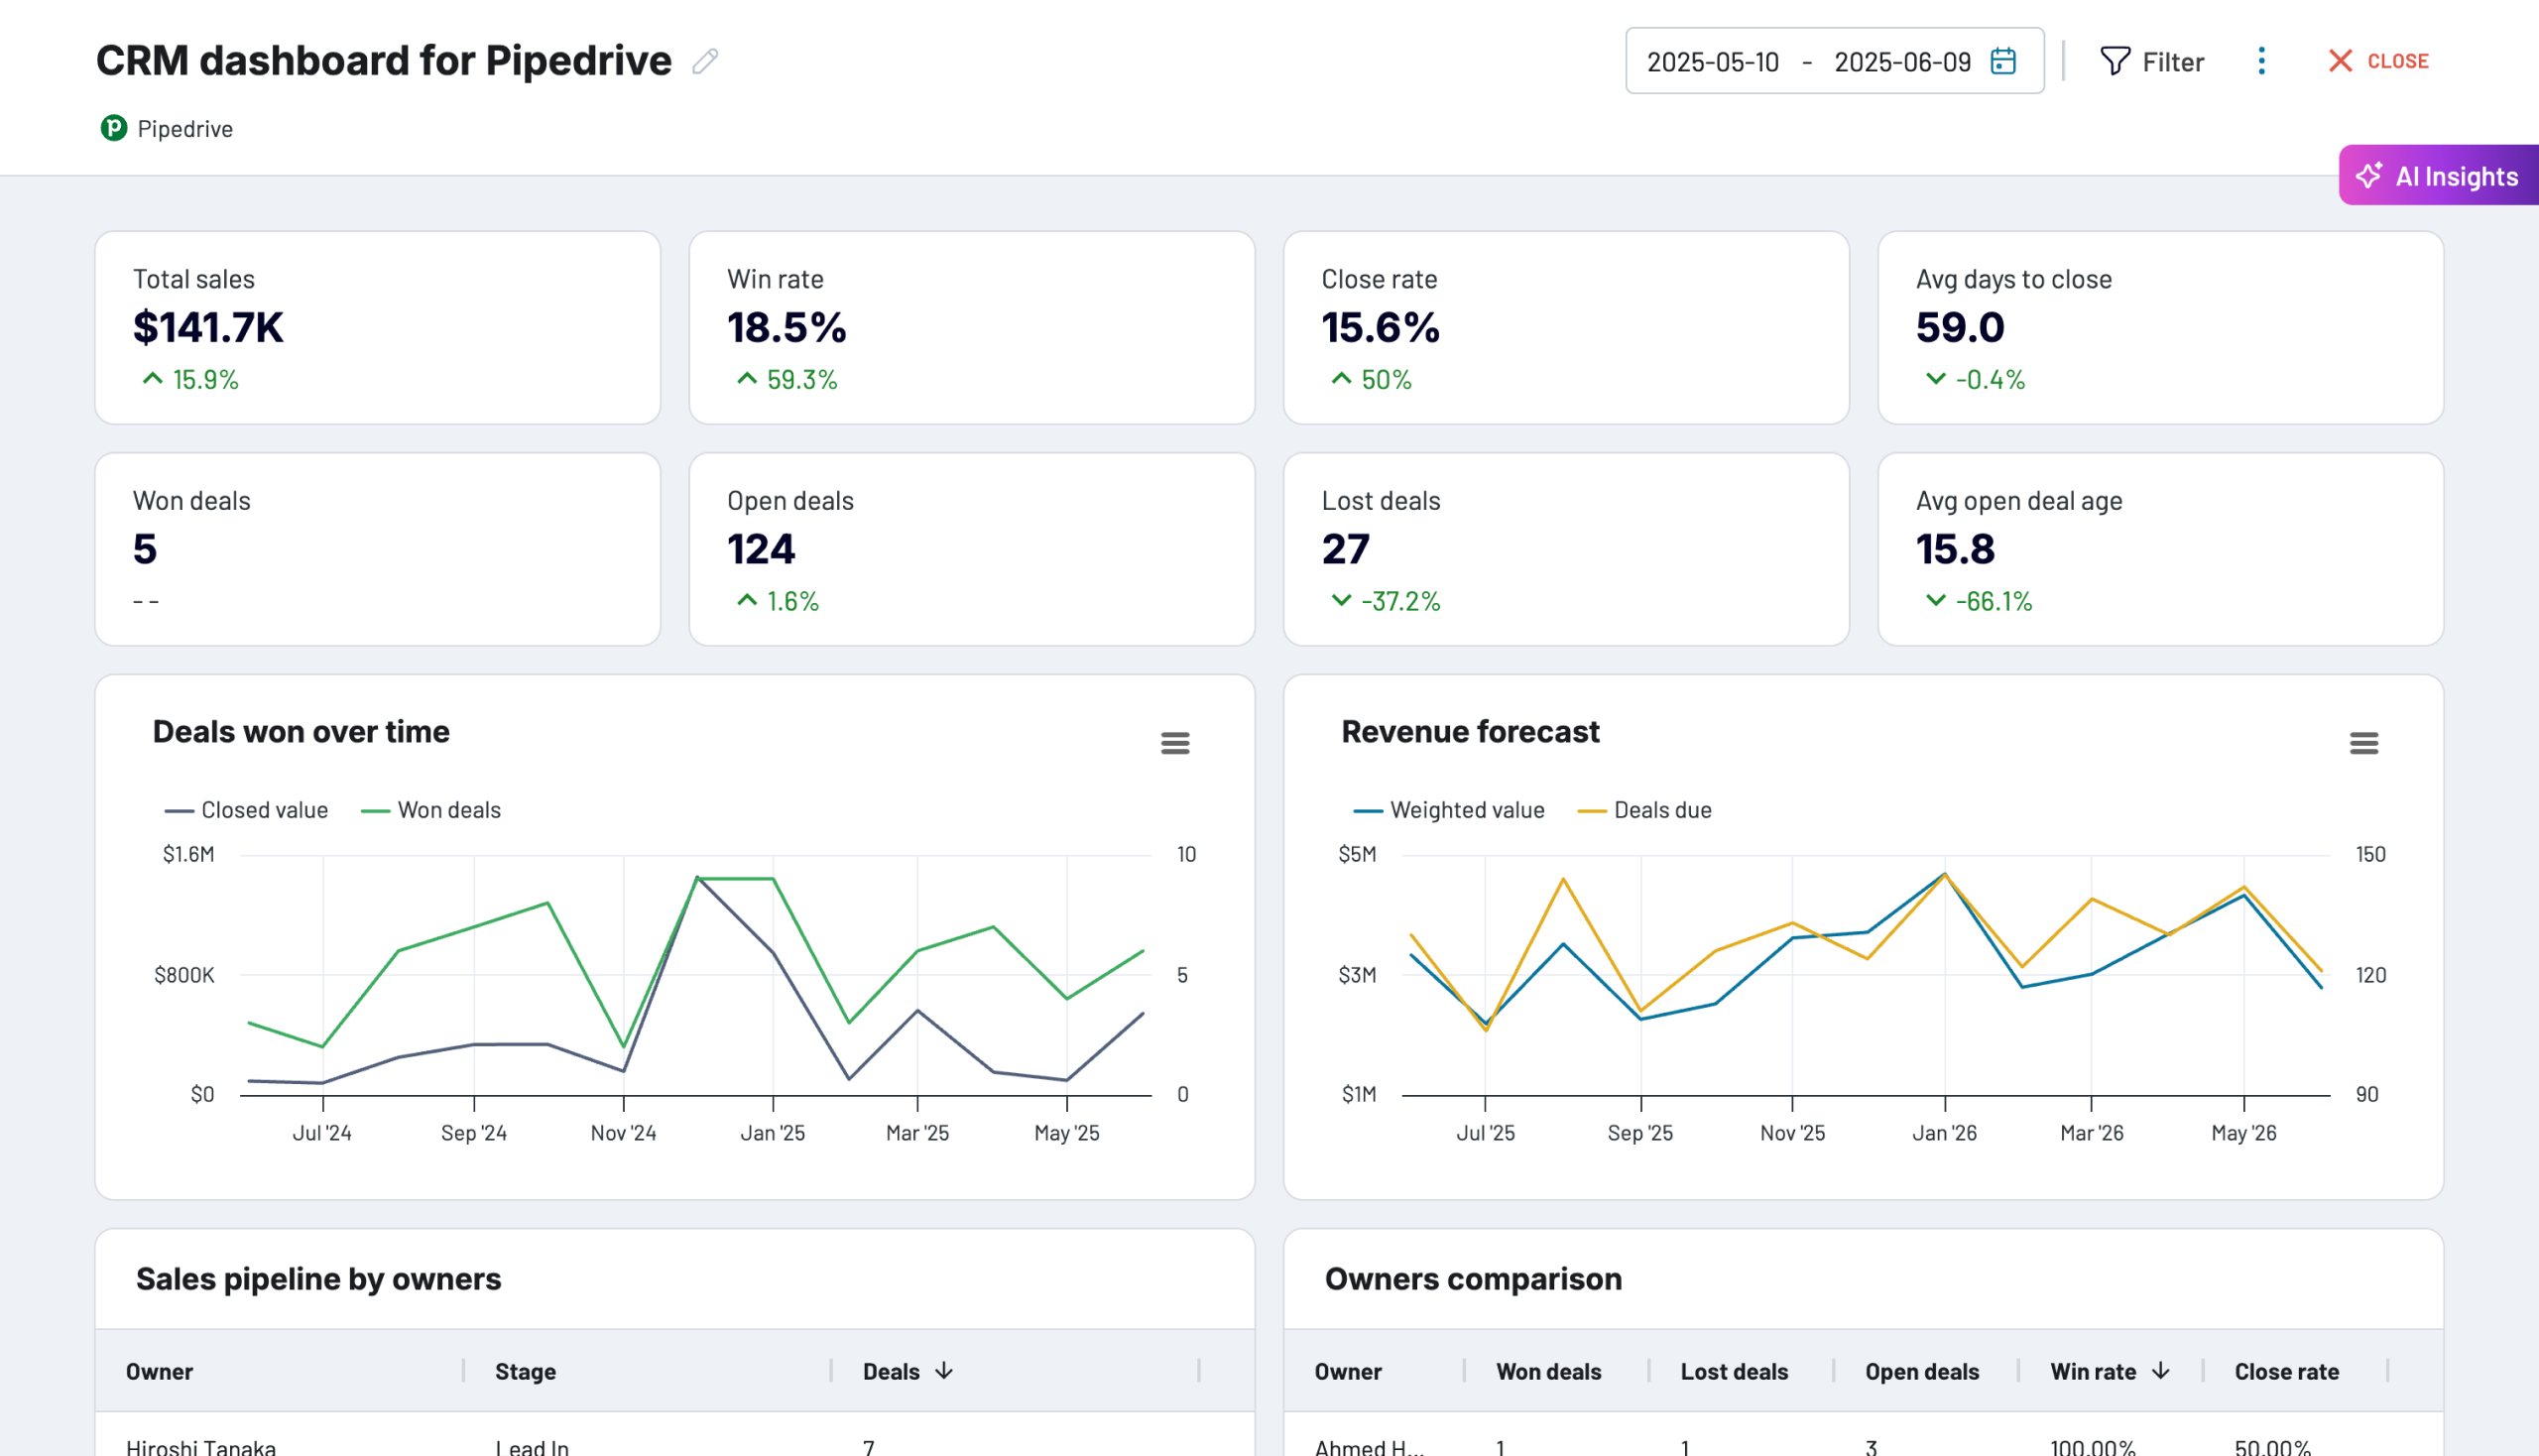
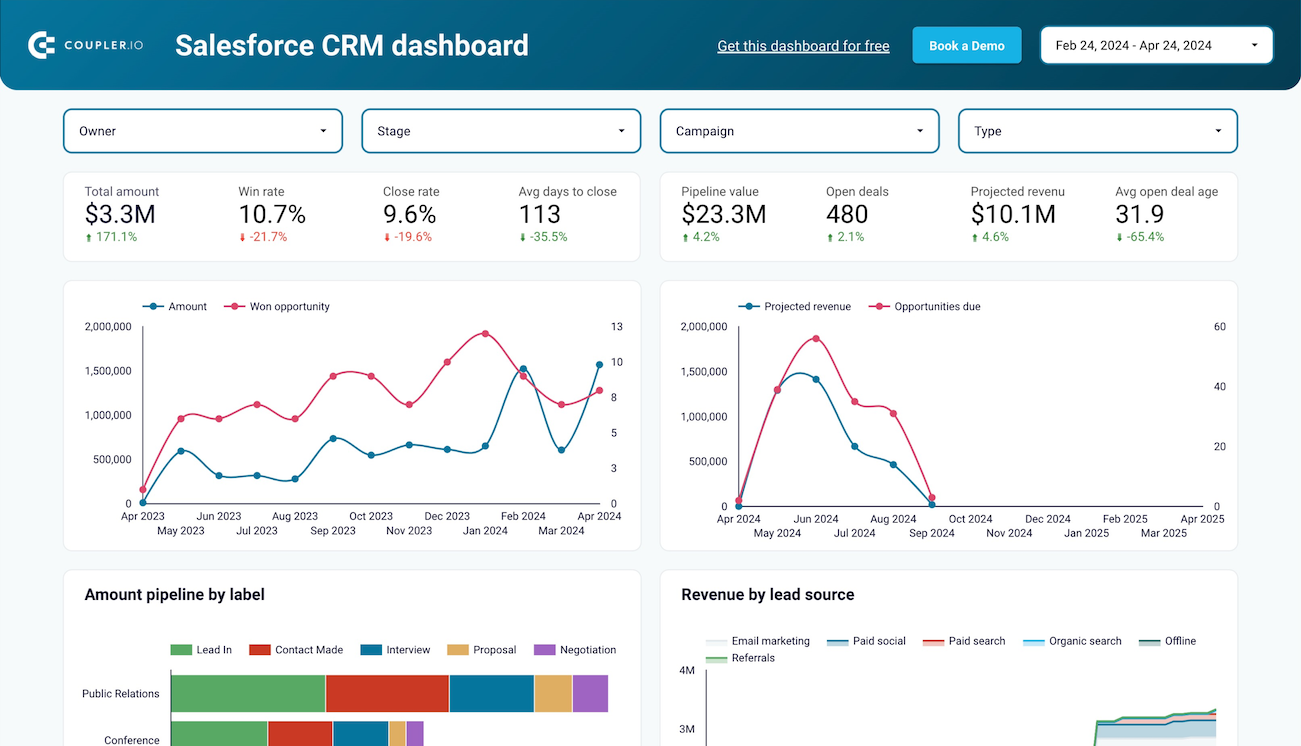
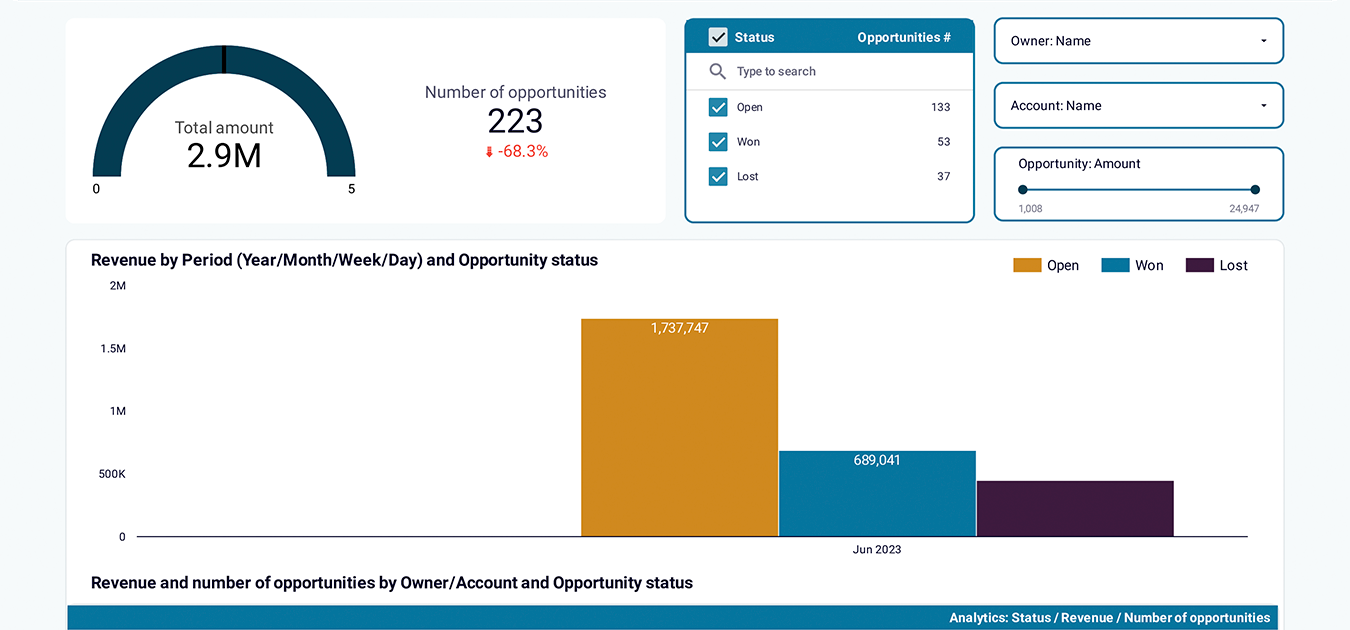
A contemporary sales reporting dashboard integrates comprehensive analytical components that address every aspect of sales performance management and strategic planning. Pipeline management capabilities provide detailed visibility into deal progression, stage-by-stage conversion rates, and sales velocity metrics. All this helps sales experts identify bottlenecks and optimize the sales process.
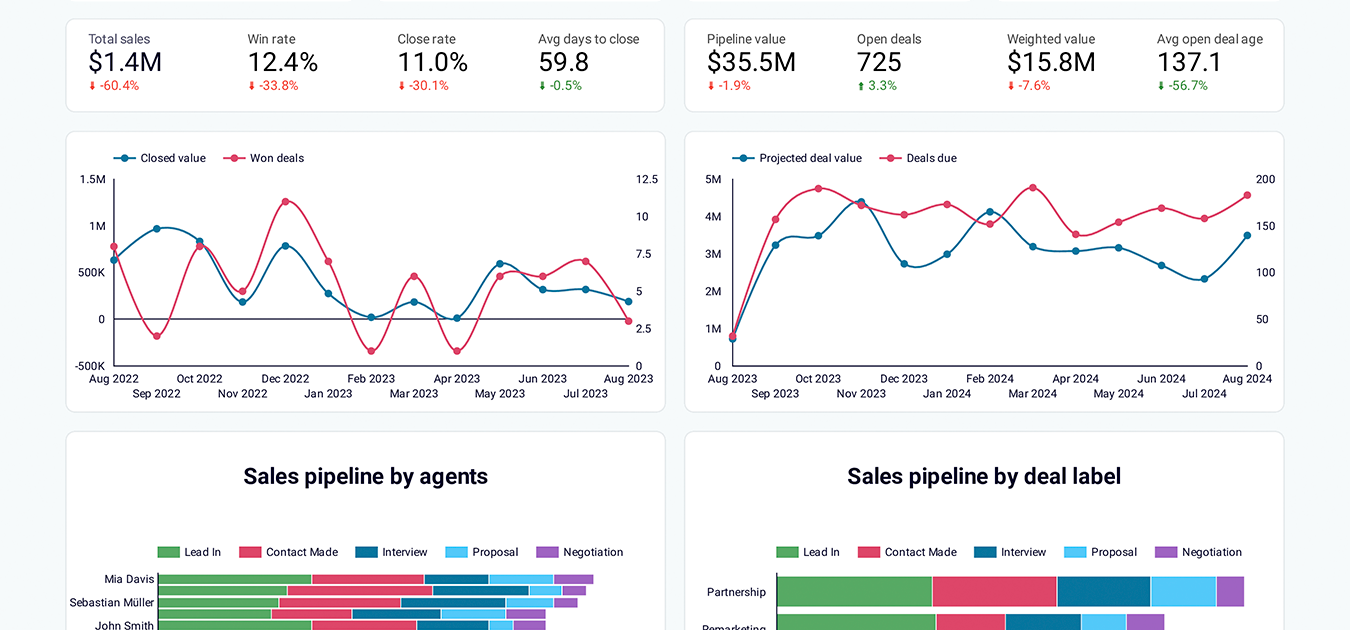
Sales dashboard examples typically include opportunity tracking by value, probability, and timeline to support accurate forecasting and resource allocation. Team performance analytics reveal individual and collective productivity through activity tracking, deal closure rates, and quota achievement metrics. With these insights, managers can provide targeted coaching and recognize top performers.
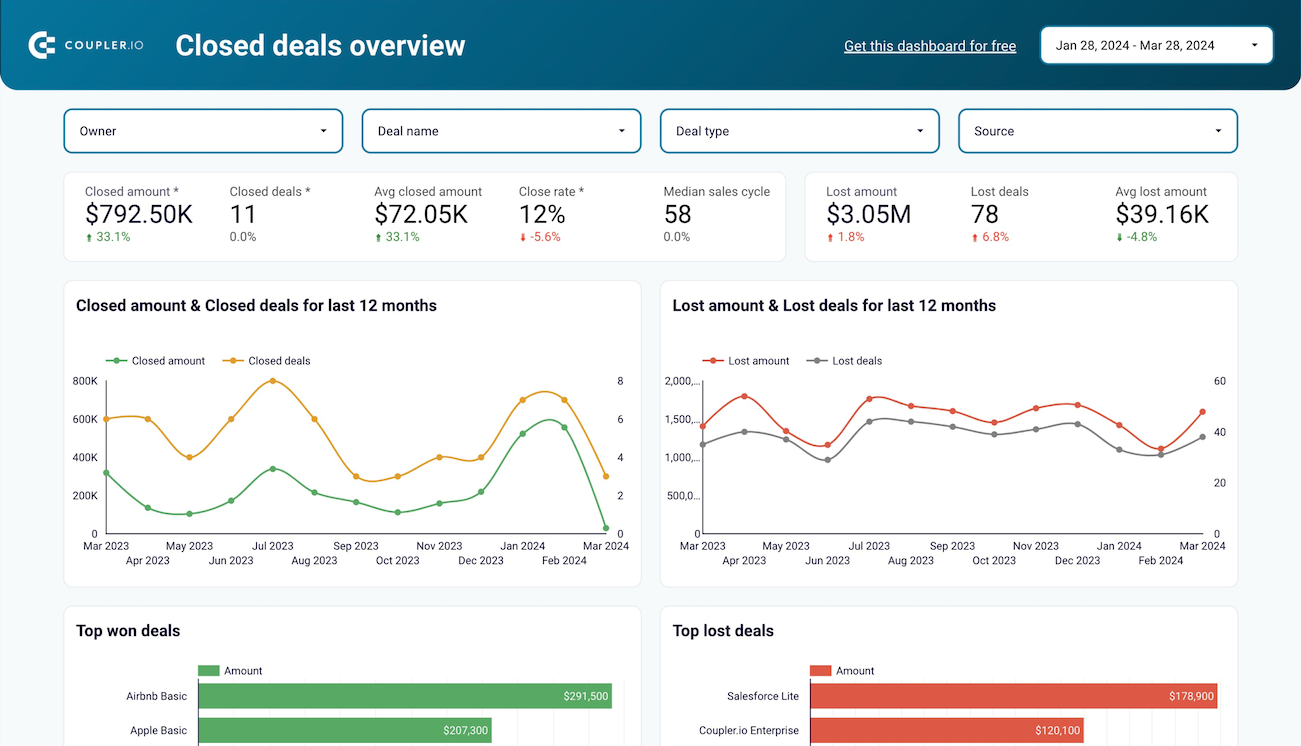
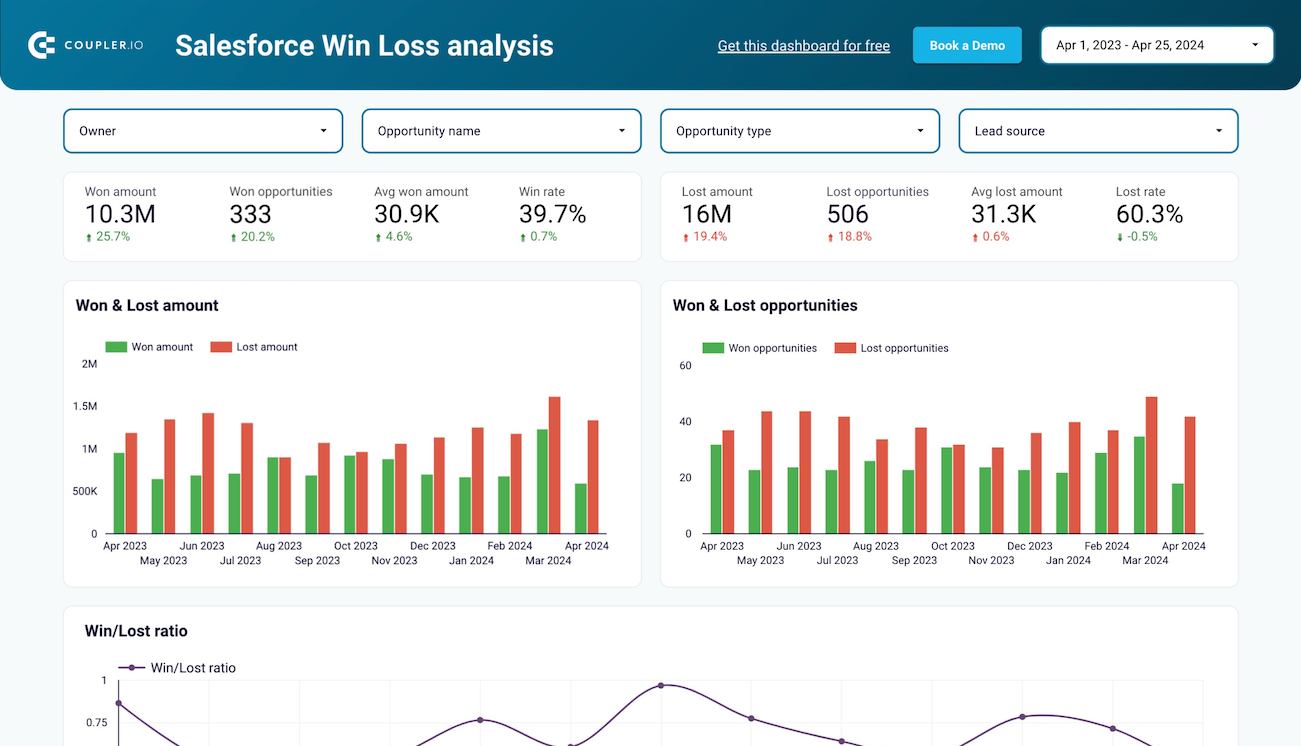
Win-loss analysis features help identify patterns in successful versus unsuccessful deals. They provide valuable intelligence about customer segments, competitive positioning, and deal characteristics that inform strategic adjustments.
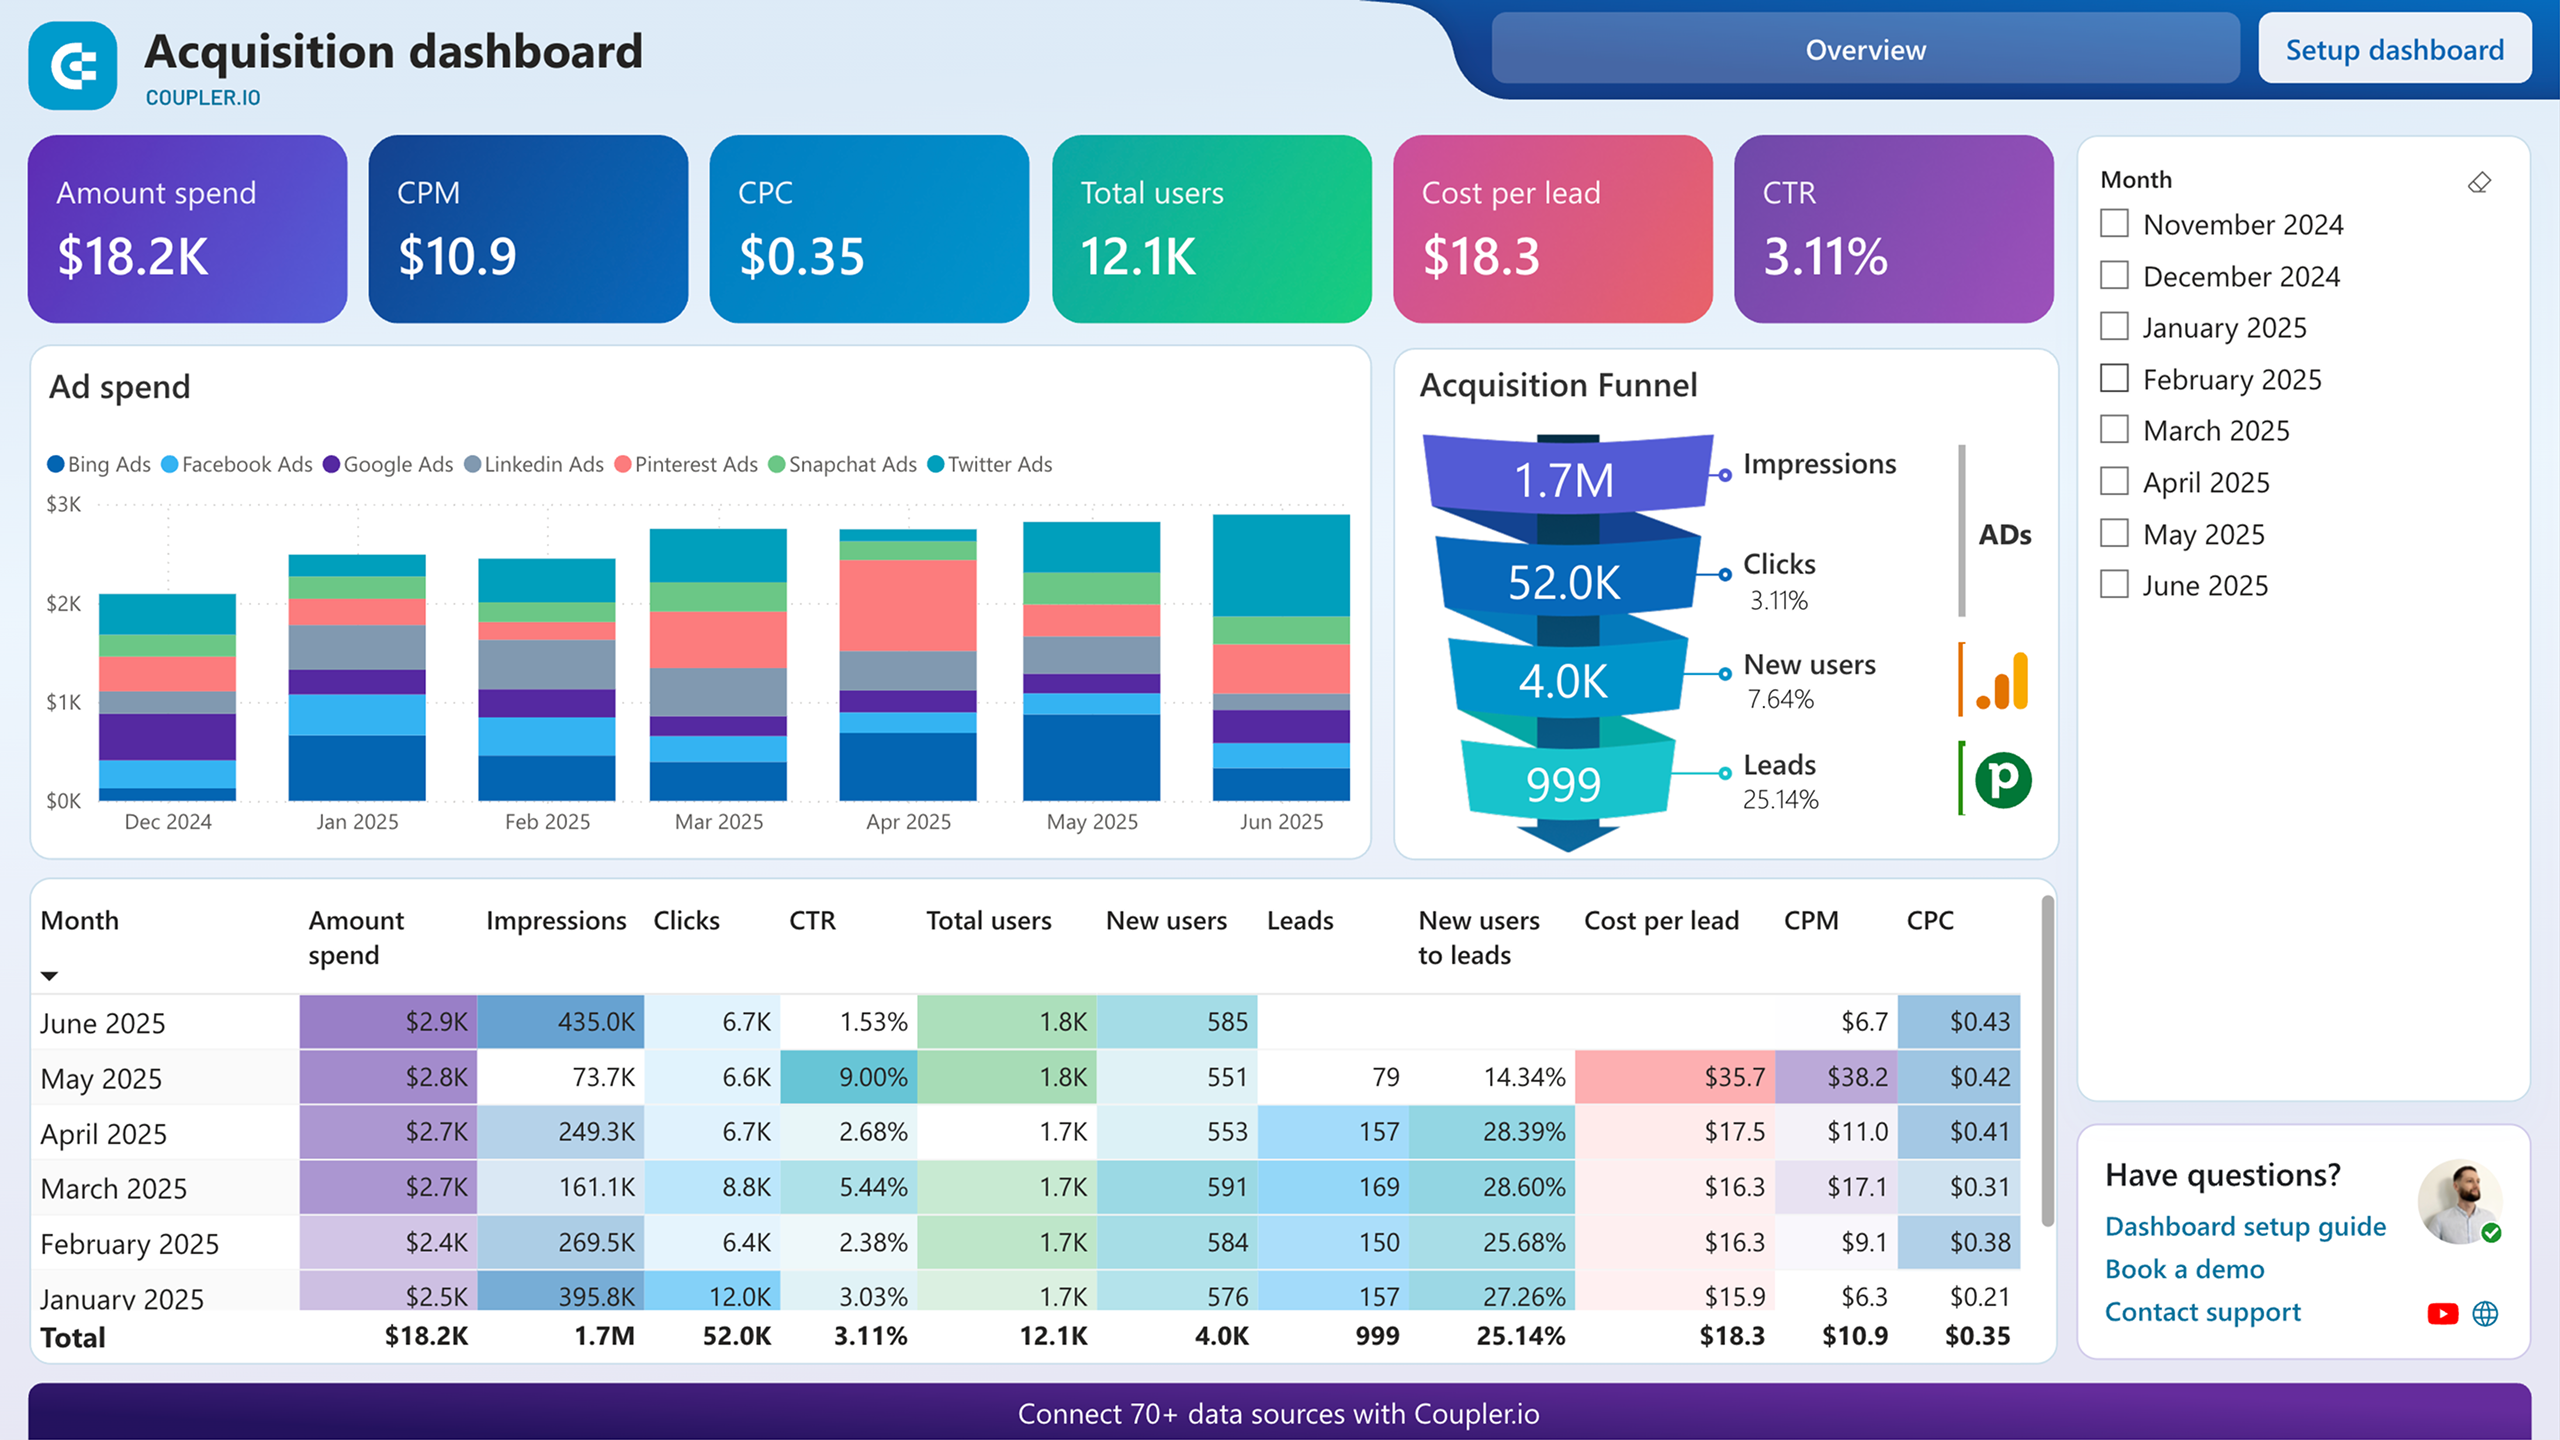
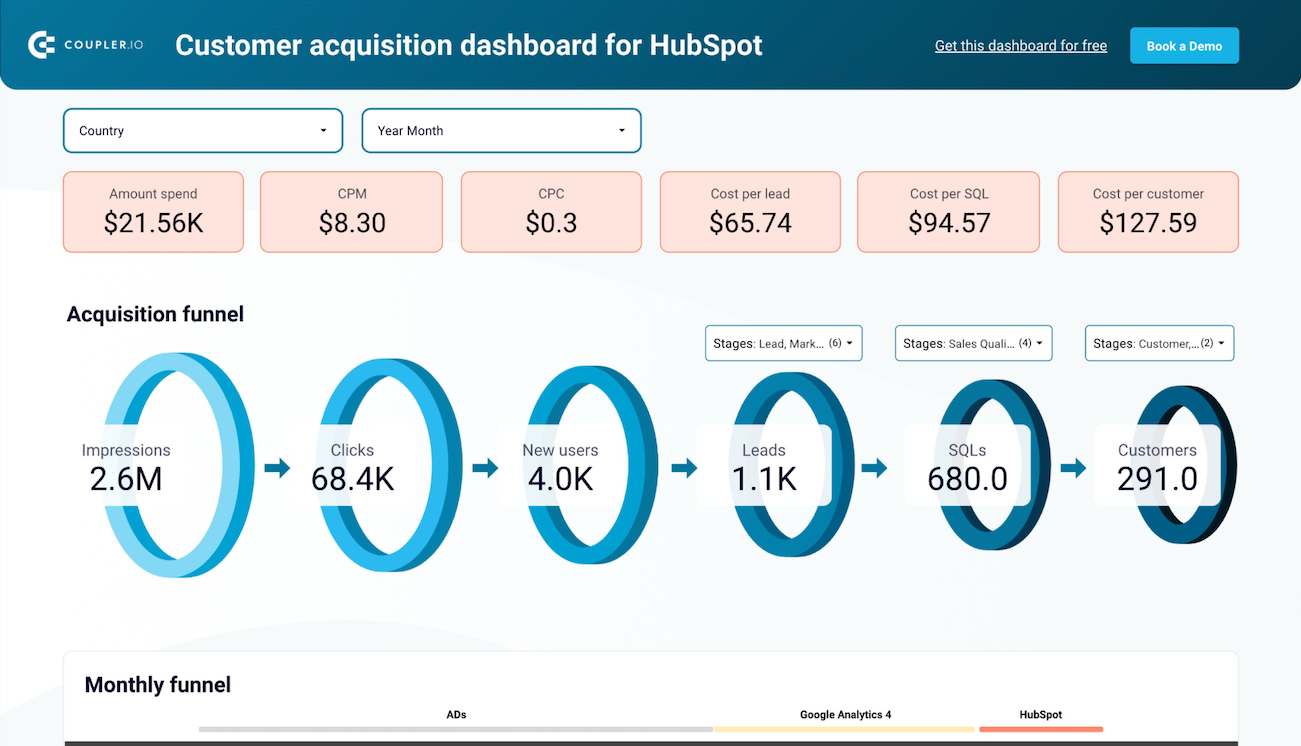
Revenue forecasting components combine historical performance data with current pipeline health to project future outcomes and identify potential shortfalls before they impact business objectives. Customer acquisition tracking monitors lead sources, conversion efficiency, and sales cycle duration. This information is useful to optimize marketing investments and improve lead quality throughout the entire revenue generation process.
How to create sales dashboards from templates?
