Looker Studio ecommerce dashboard examples and reporting templates
Track sales, advertising ROI, and email campaign performance in Looker Studio ecommerce reporting dashboards powered by Coupler.io. Automate data load from Shopify, WooCommerce, Stripe, Klaviyo, Mailchimp, and other platforms without manual exports or copy-pasting between tabs.
Looker Studio ecommerce dashboard examples for every need


 +5
+5

 +4
+4


about your case. It doesn't cost you a penny 😉
Choose your Looker Studio ecommerce dashboard template to kick off
What is a Looker Studio ecommerce dashboard?
With Looker Studio ecommerce dashboards, you move from raw numbers to actionable reporting. Track how visitor sessions turn into purchases, measure whether ad spend translates into orders, monitor email campaign impact on revenue, and compare top-line sales against actual profit. Each report draws from verified platform data and presents it in charts and tables built for quick decision-making.
Coupler.io powers the data pipeline behind Looker Studio ecommerce dashboard templates. It extracts, transforms, and loads your ecommerce data into LS on a set schedule, without manual exports.

What reports should be included in Looker Studio ecommerce dashboards?
Online store operations span traffic acquisition, advertising, email marketing, order management, and financial accounting. A useful Looker Studio ecommerce reporting dashboard should cover each of these areas so you can follow the full path from visitor to revenue. Here are four report types worth including.
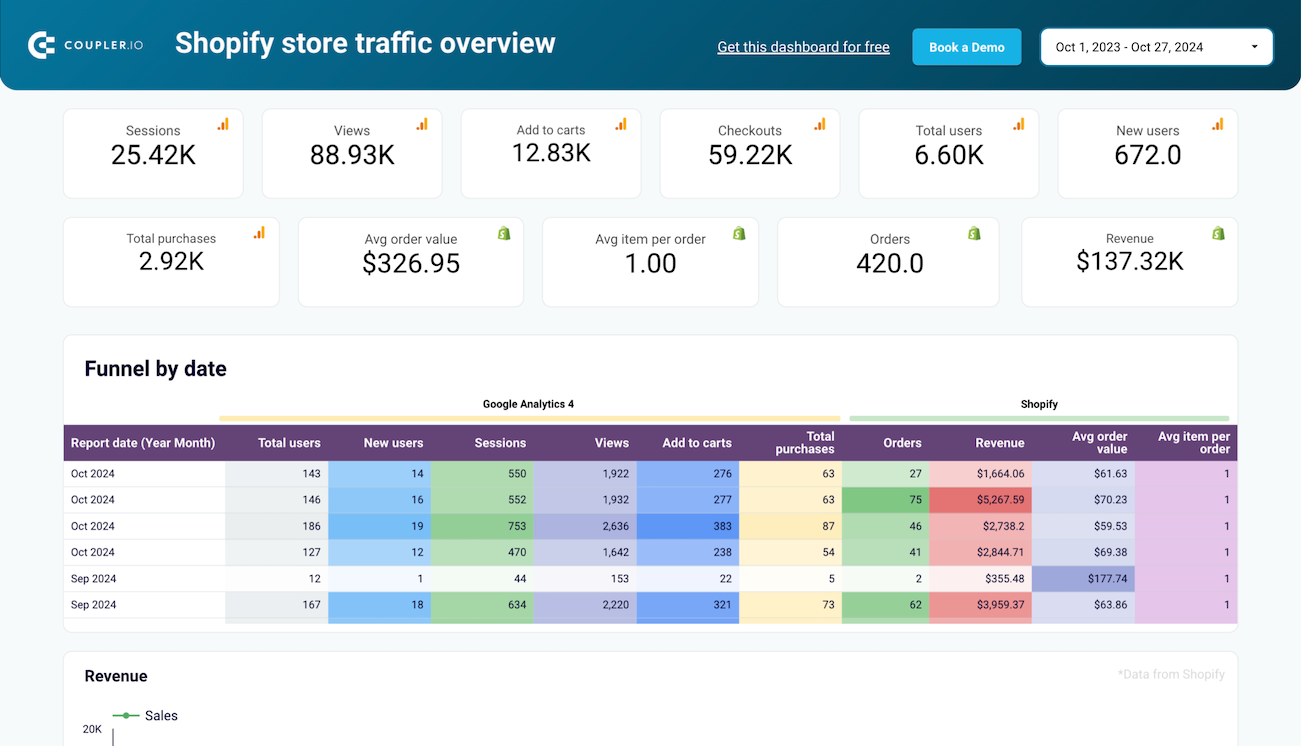
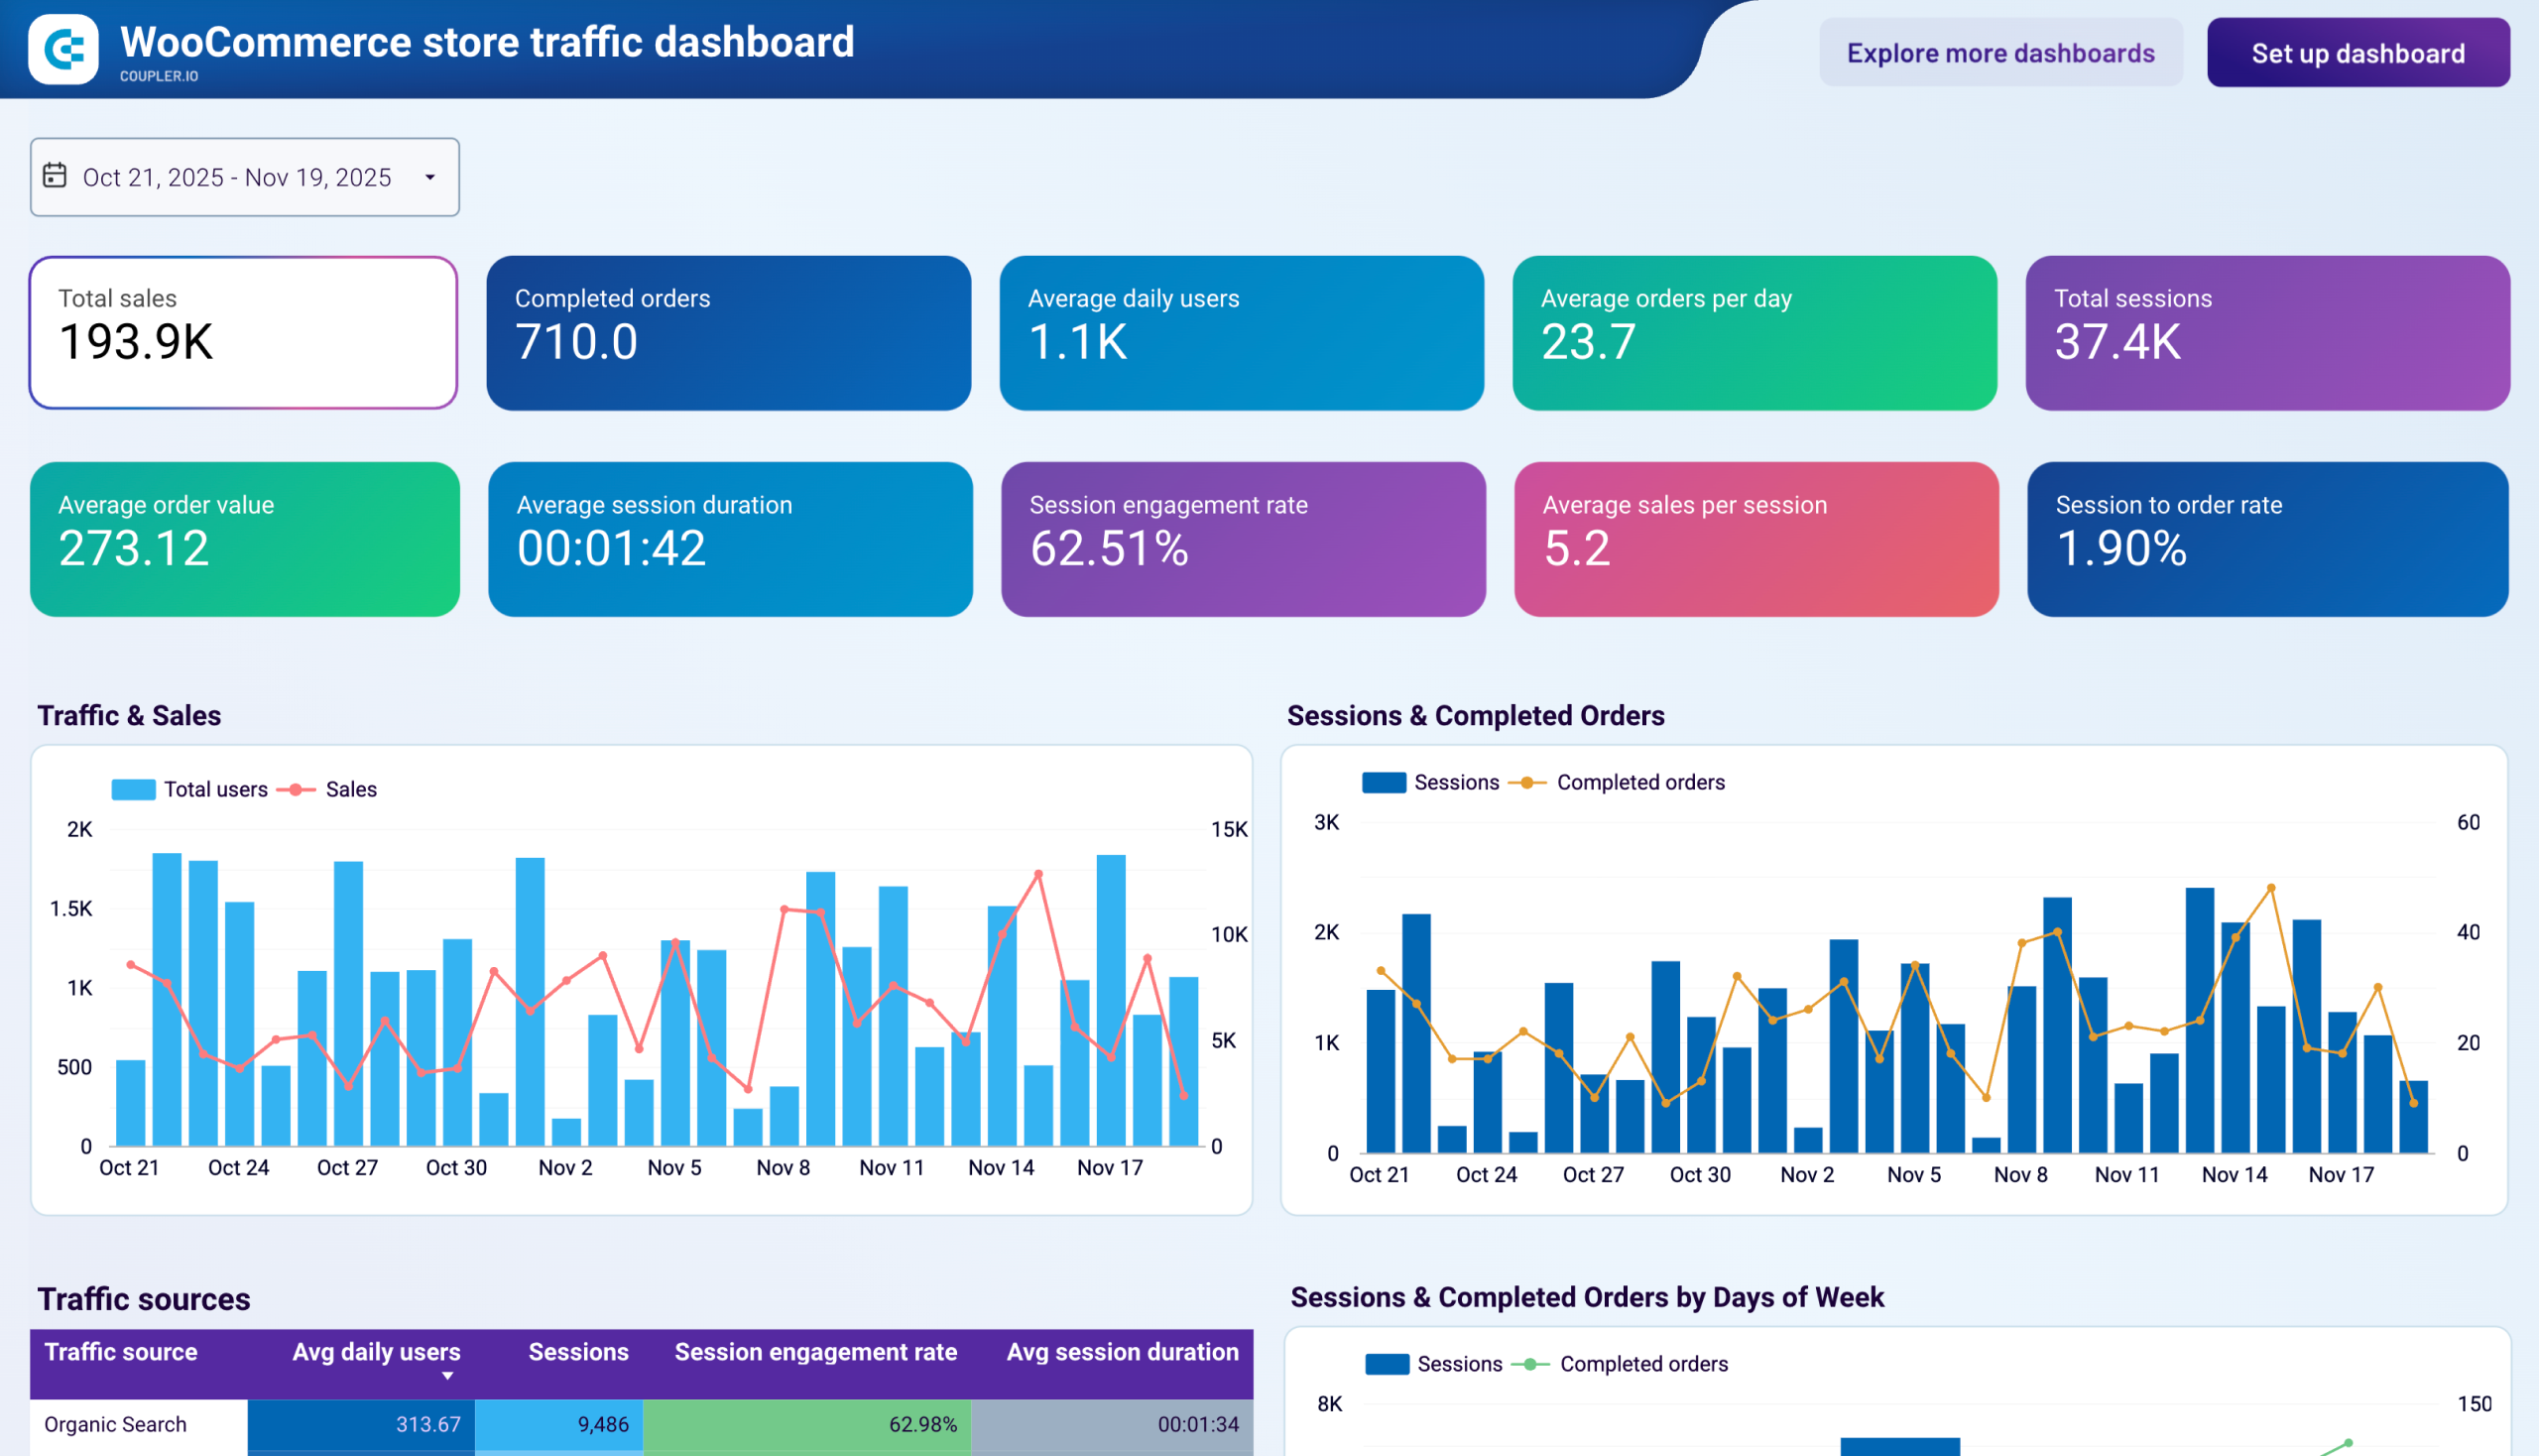
The store traffic and conversion report connects website analytics with store sales data. It covers visitor sessions, purchase funnel progression, traffic source performance, and top-selling products. With it, you can identify which acquisition channels drive actual purchases, spot the funnel stages where shoppers drop off, and focus marketing spend on what converts. These reports are available for both Shopify and WooCommerce stores, with data pulled from Google Analytics 4 alongside your store platform.
The marketing and advertising performance report ties ad platform data to store revenue. It covers the acquisition funnel from impressions through clicks to completed orders, spend distribution across advertising platforms, and ROI by channel. You can use it to measure how effectively your ad budget turns into new customers, compare performance across platforms like Facebook Ads and Google Ads, and catch periods where rising spend doesn't produce proportional revenue growth.
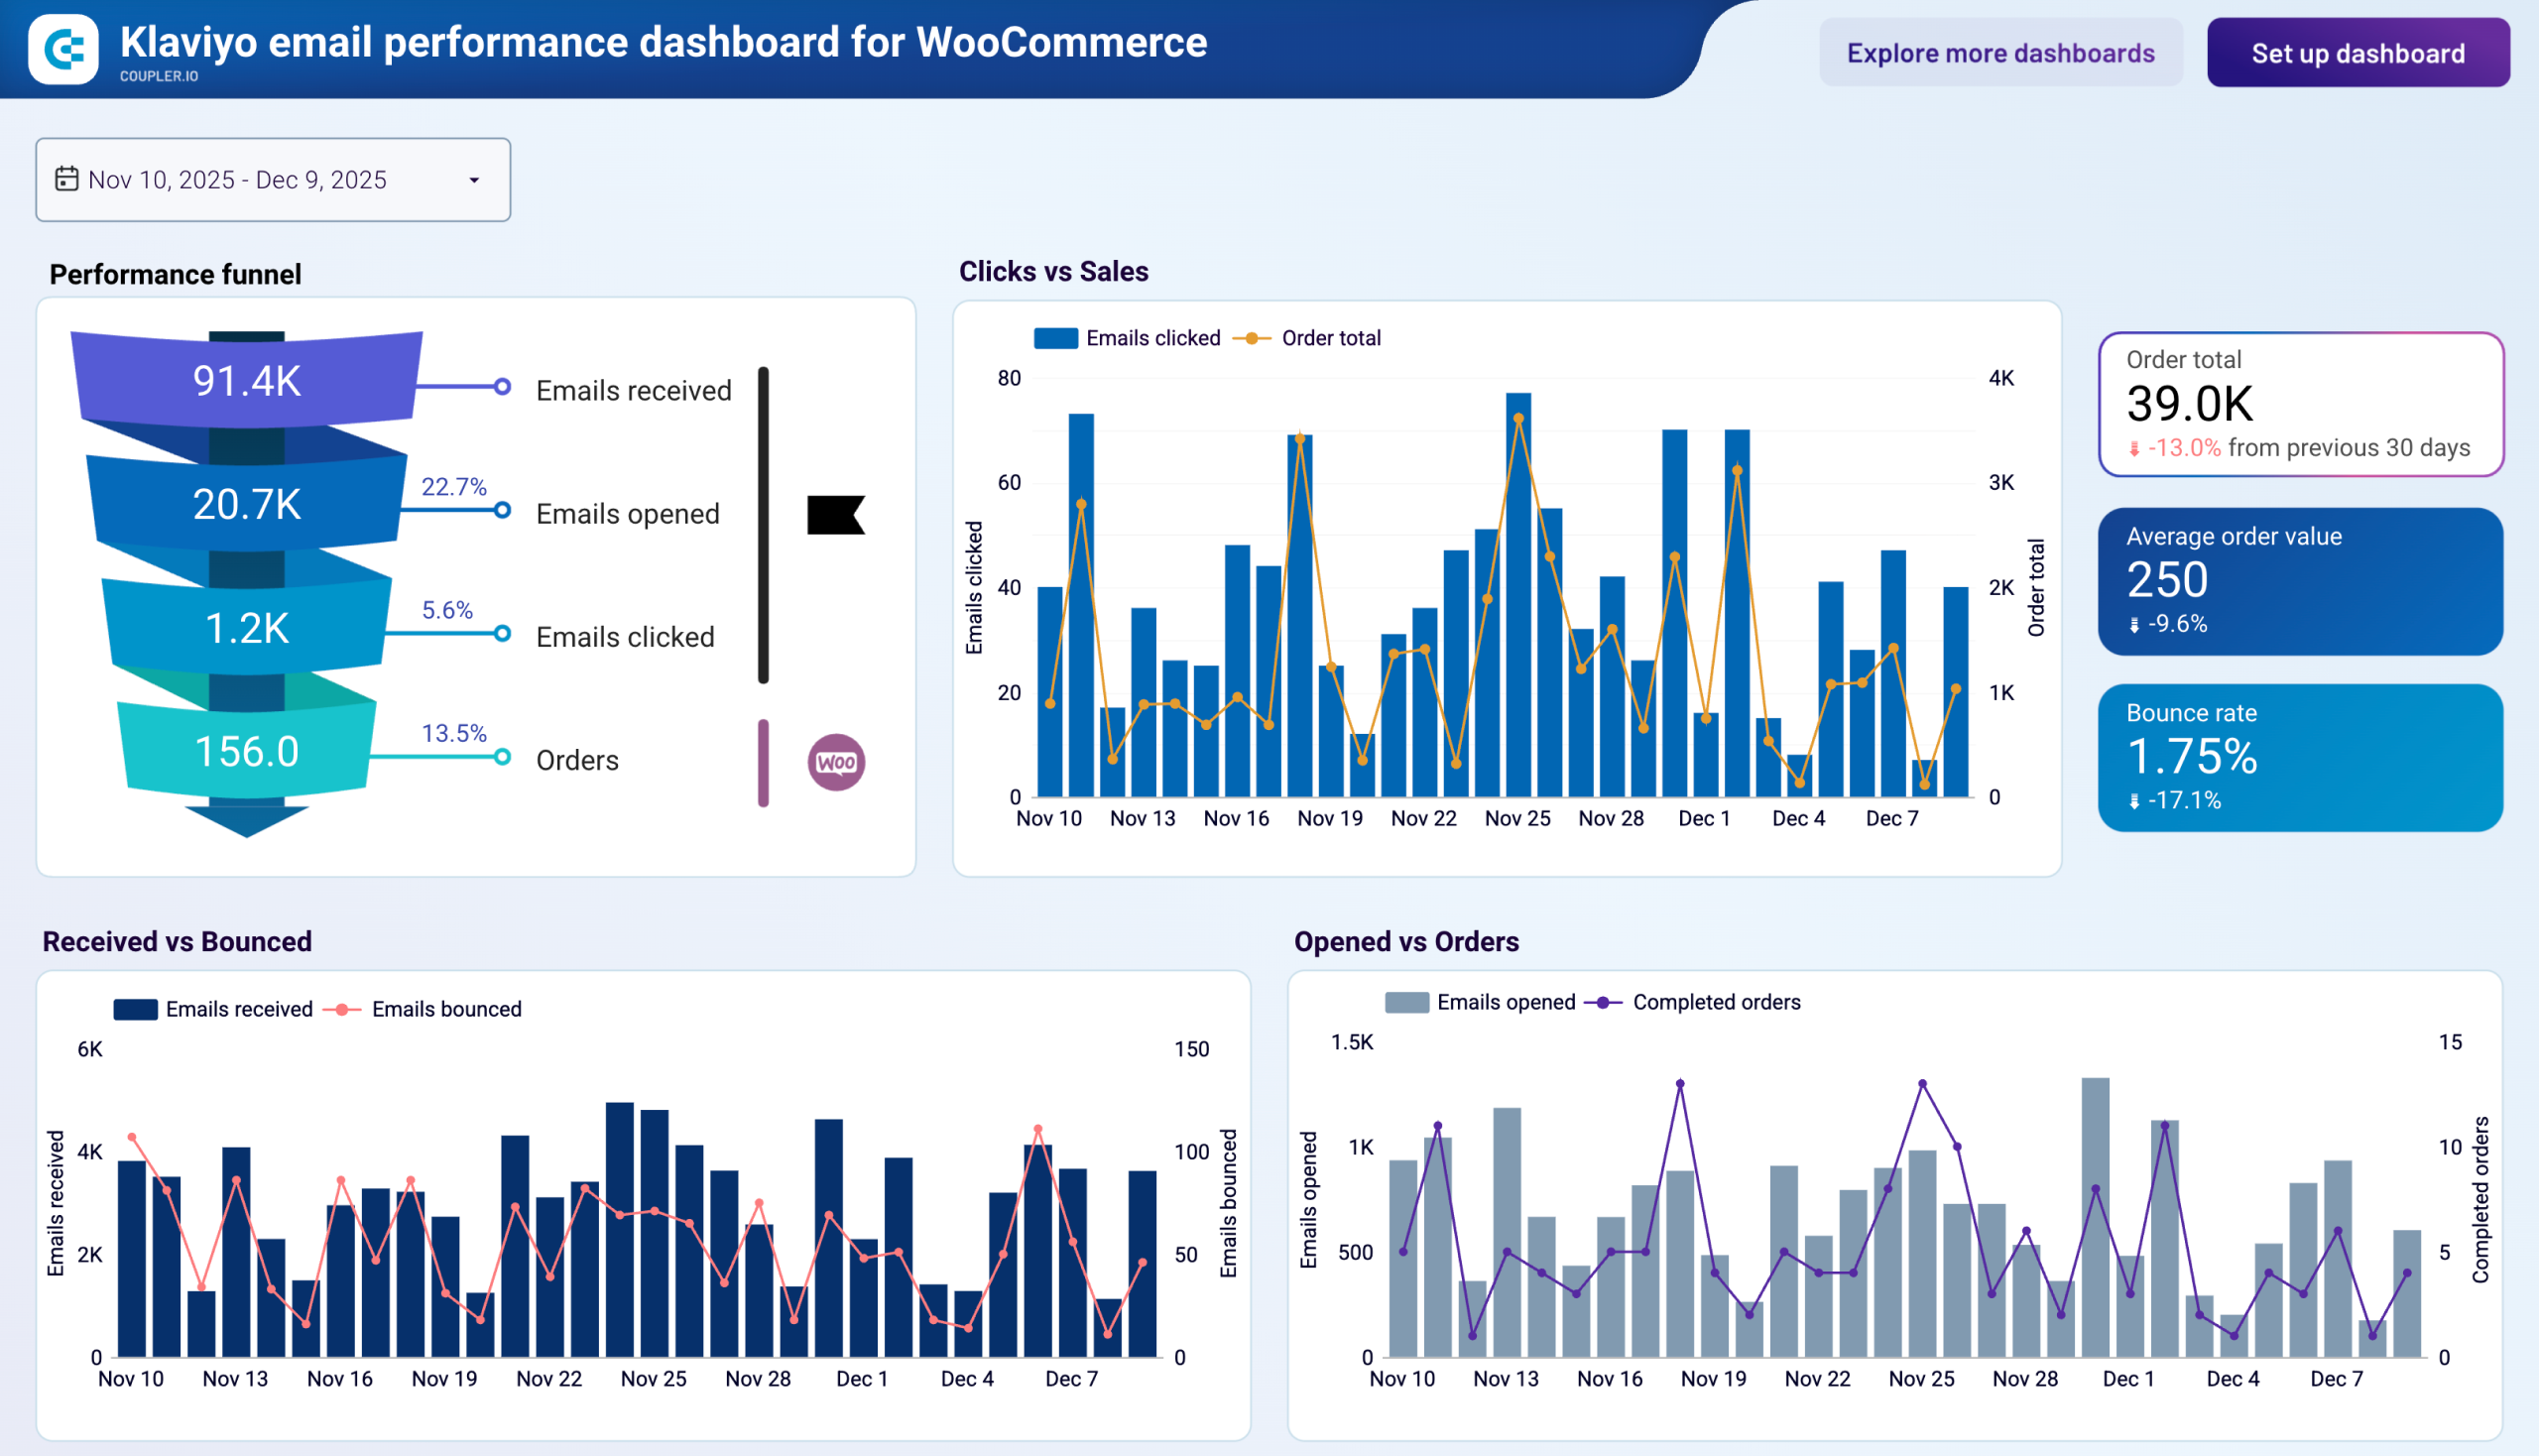
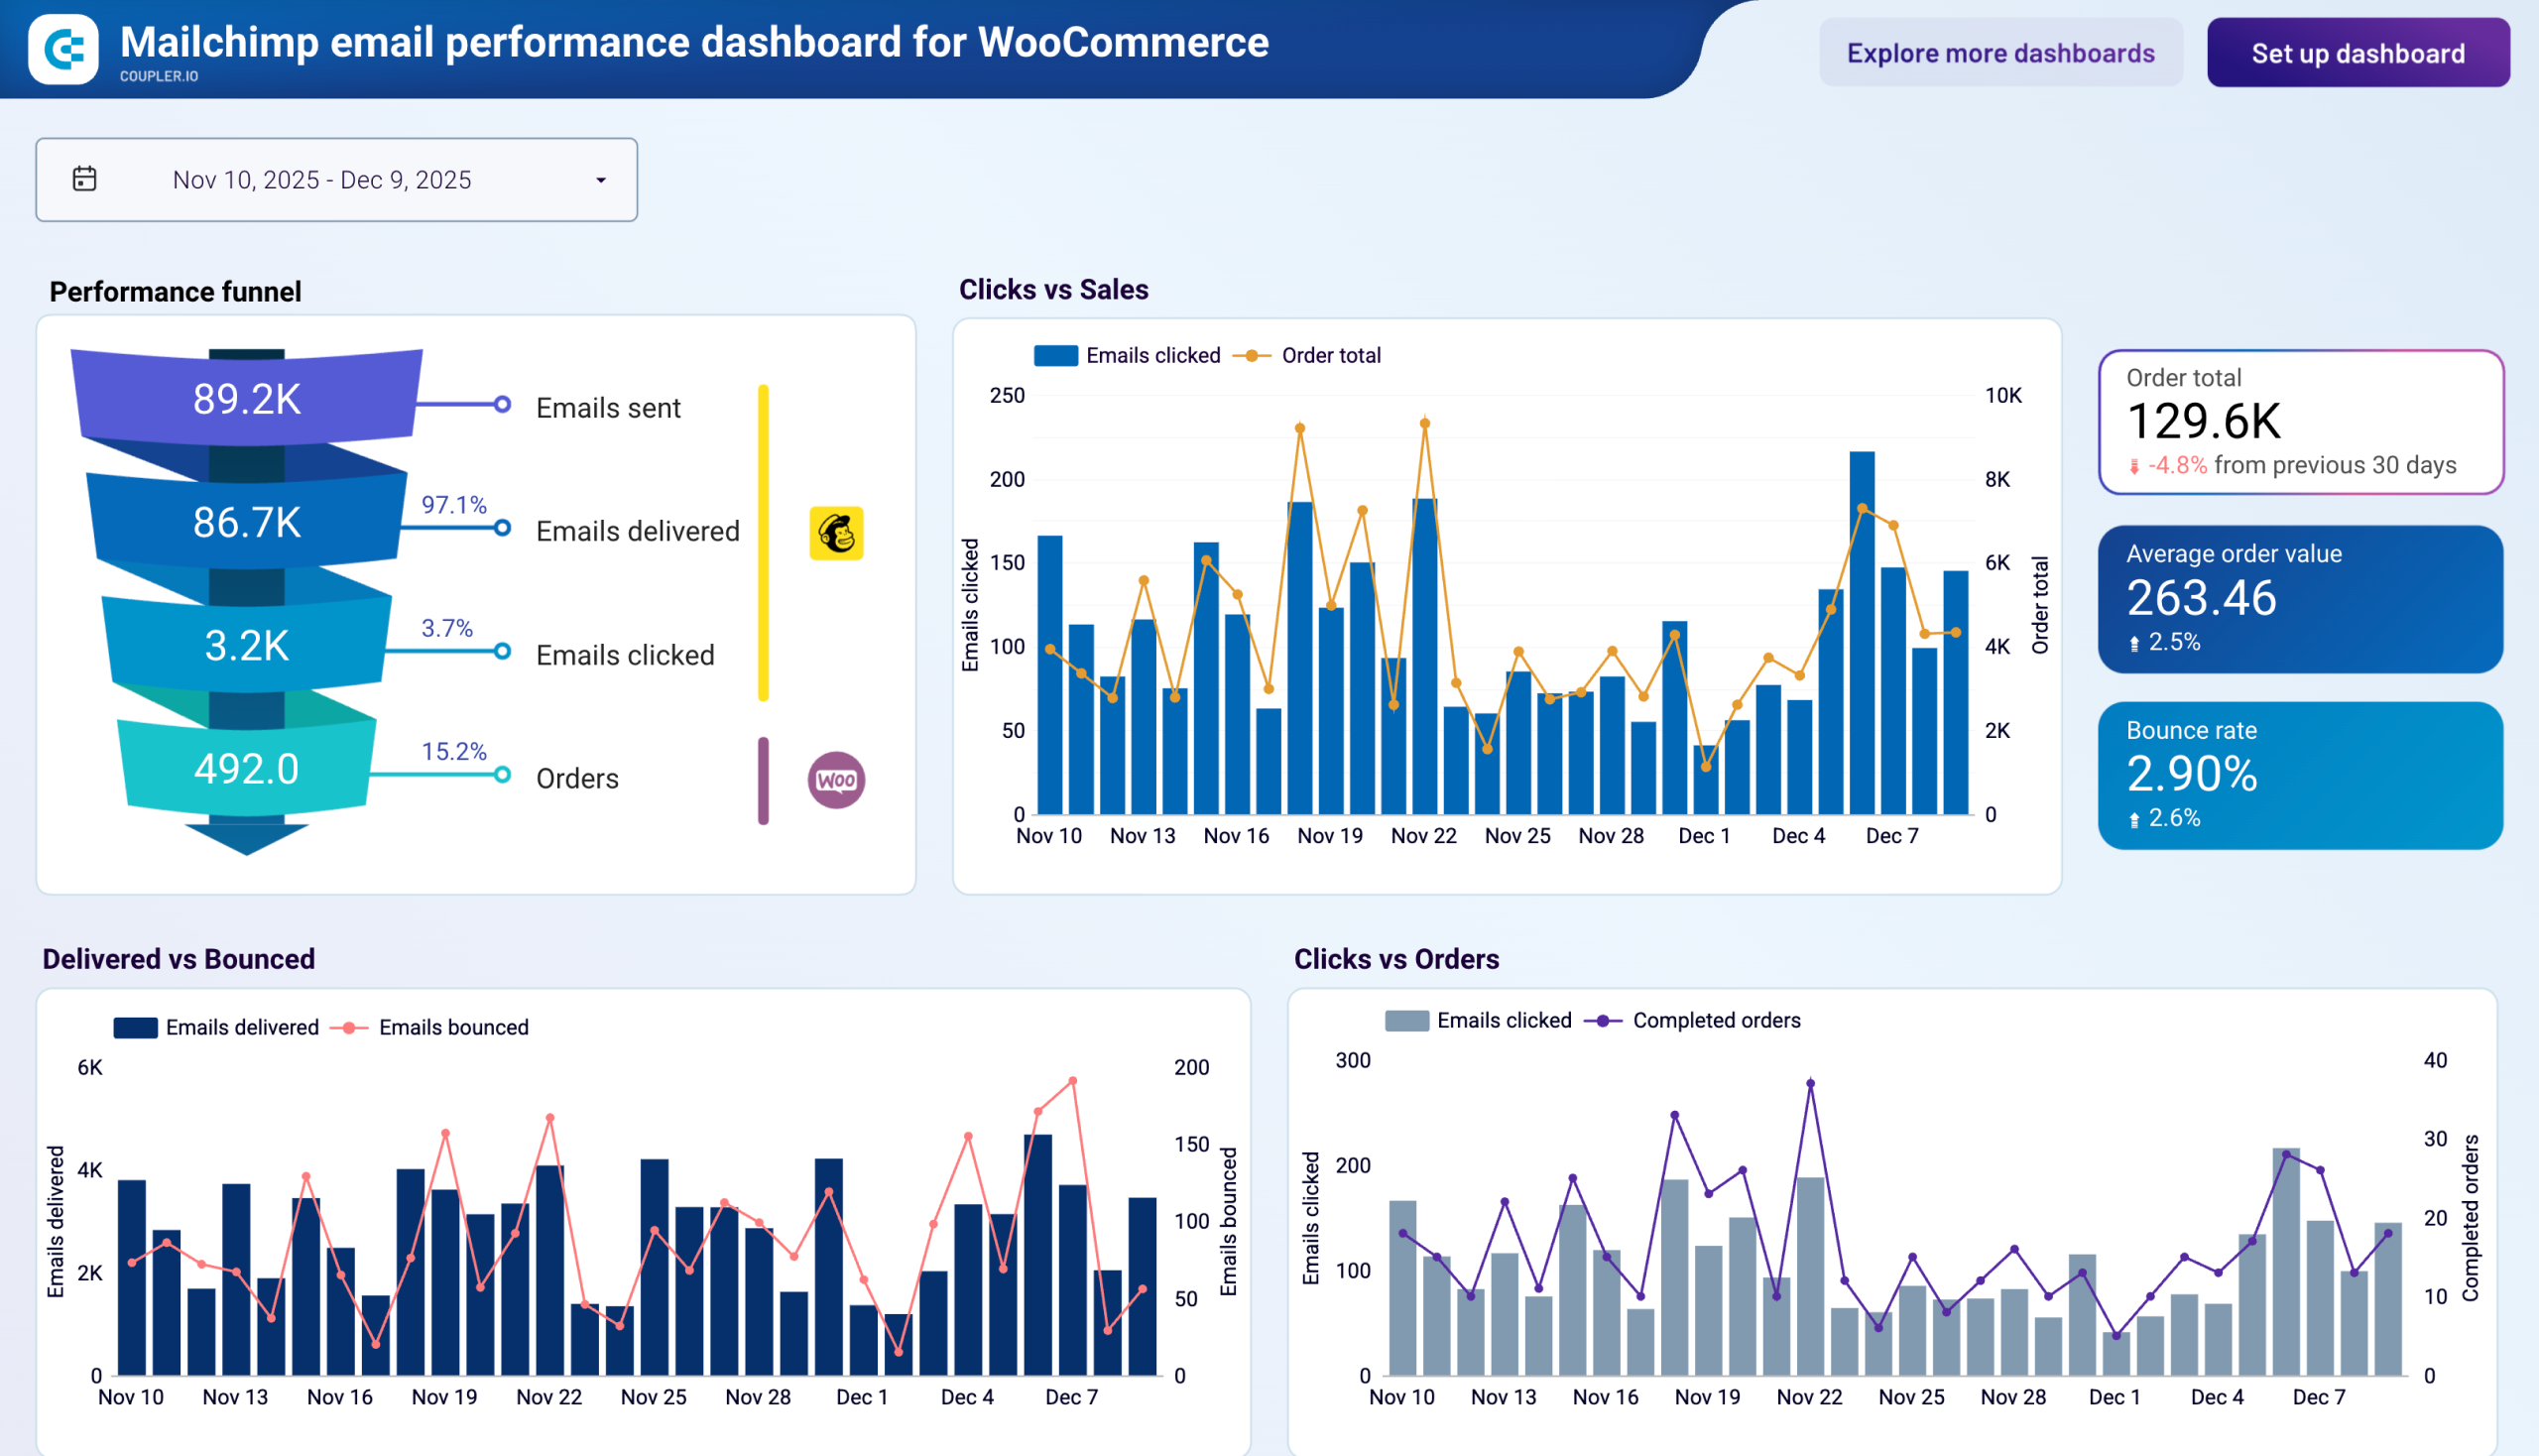
The email marketing performance report connects your email platform data with store order outcomes. It covers the email-to-revenue funnel, campaign engagement metrics, product sales driven by email, and deliverability health. You can use it to find where subscribers drop off between opens and purchases, identify which campaigns generate the most revenue, and spot deliverability issues before they affect inbox placement. Reports are available for both Klaviyo and Mailchimp, connected to Shopify or WooCommerce.
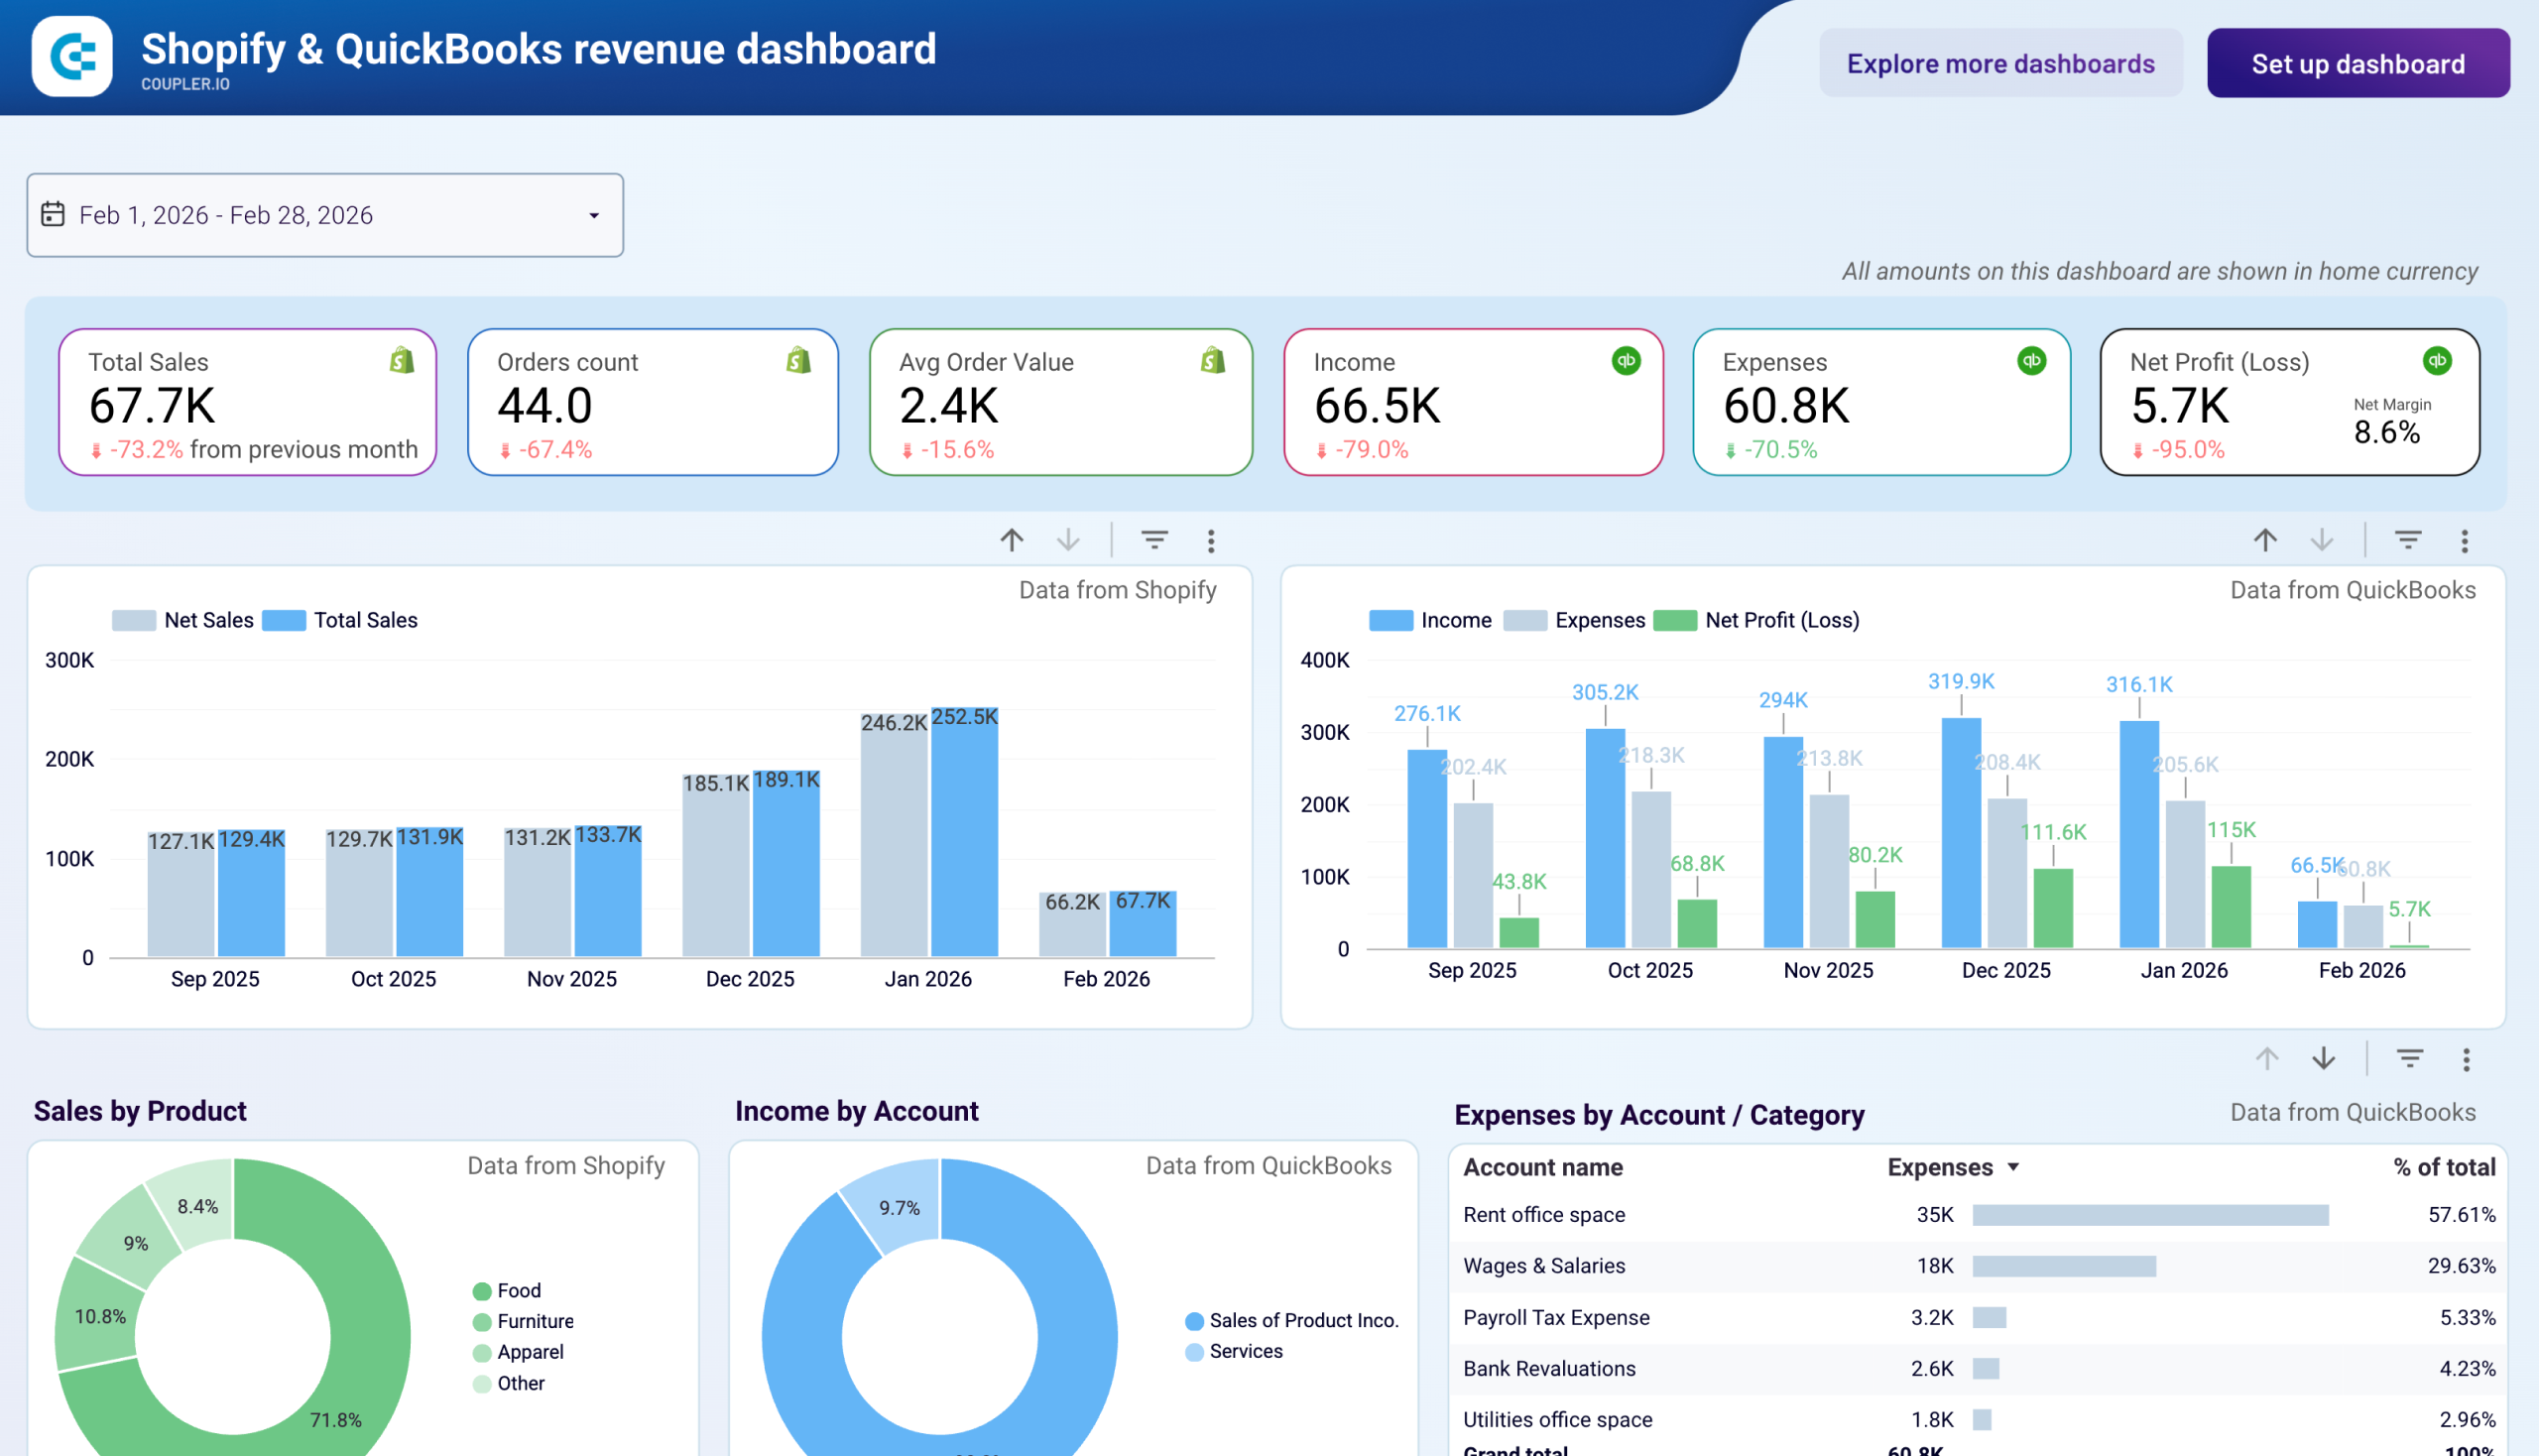
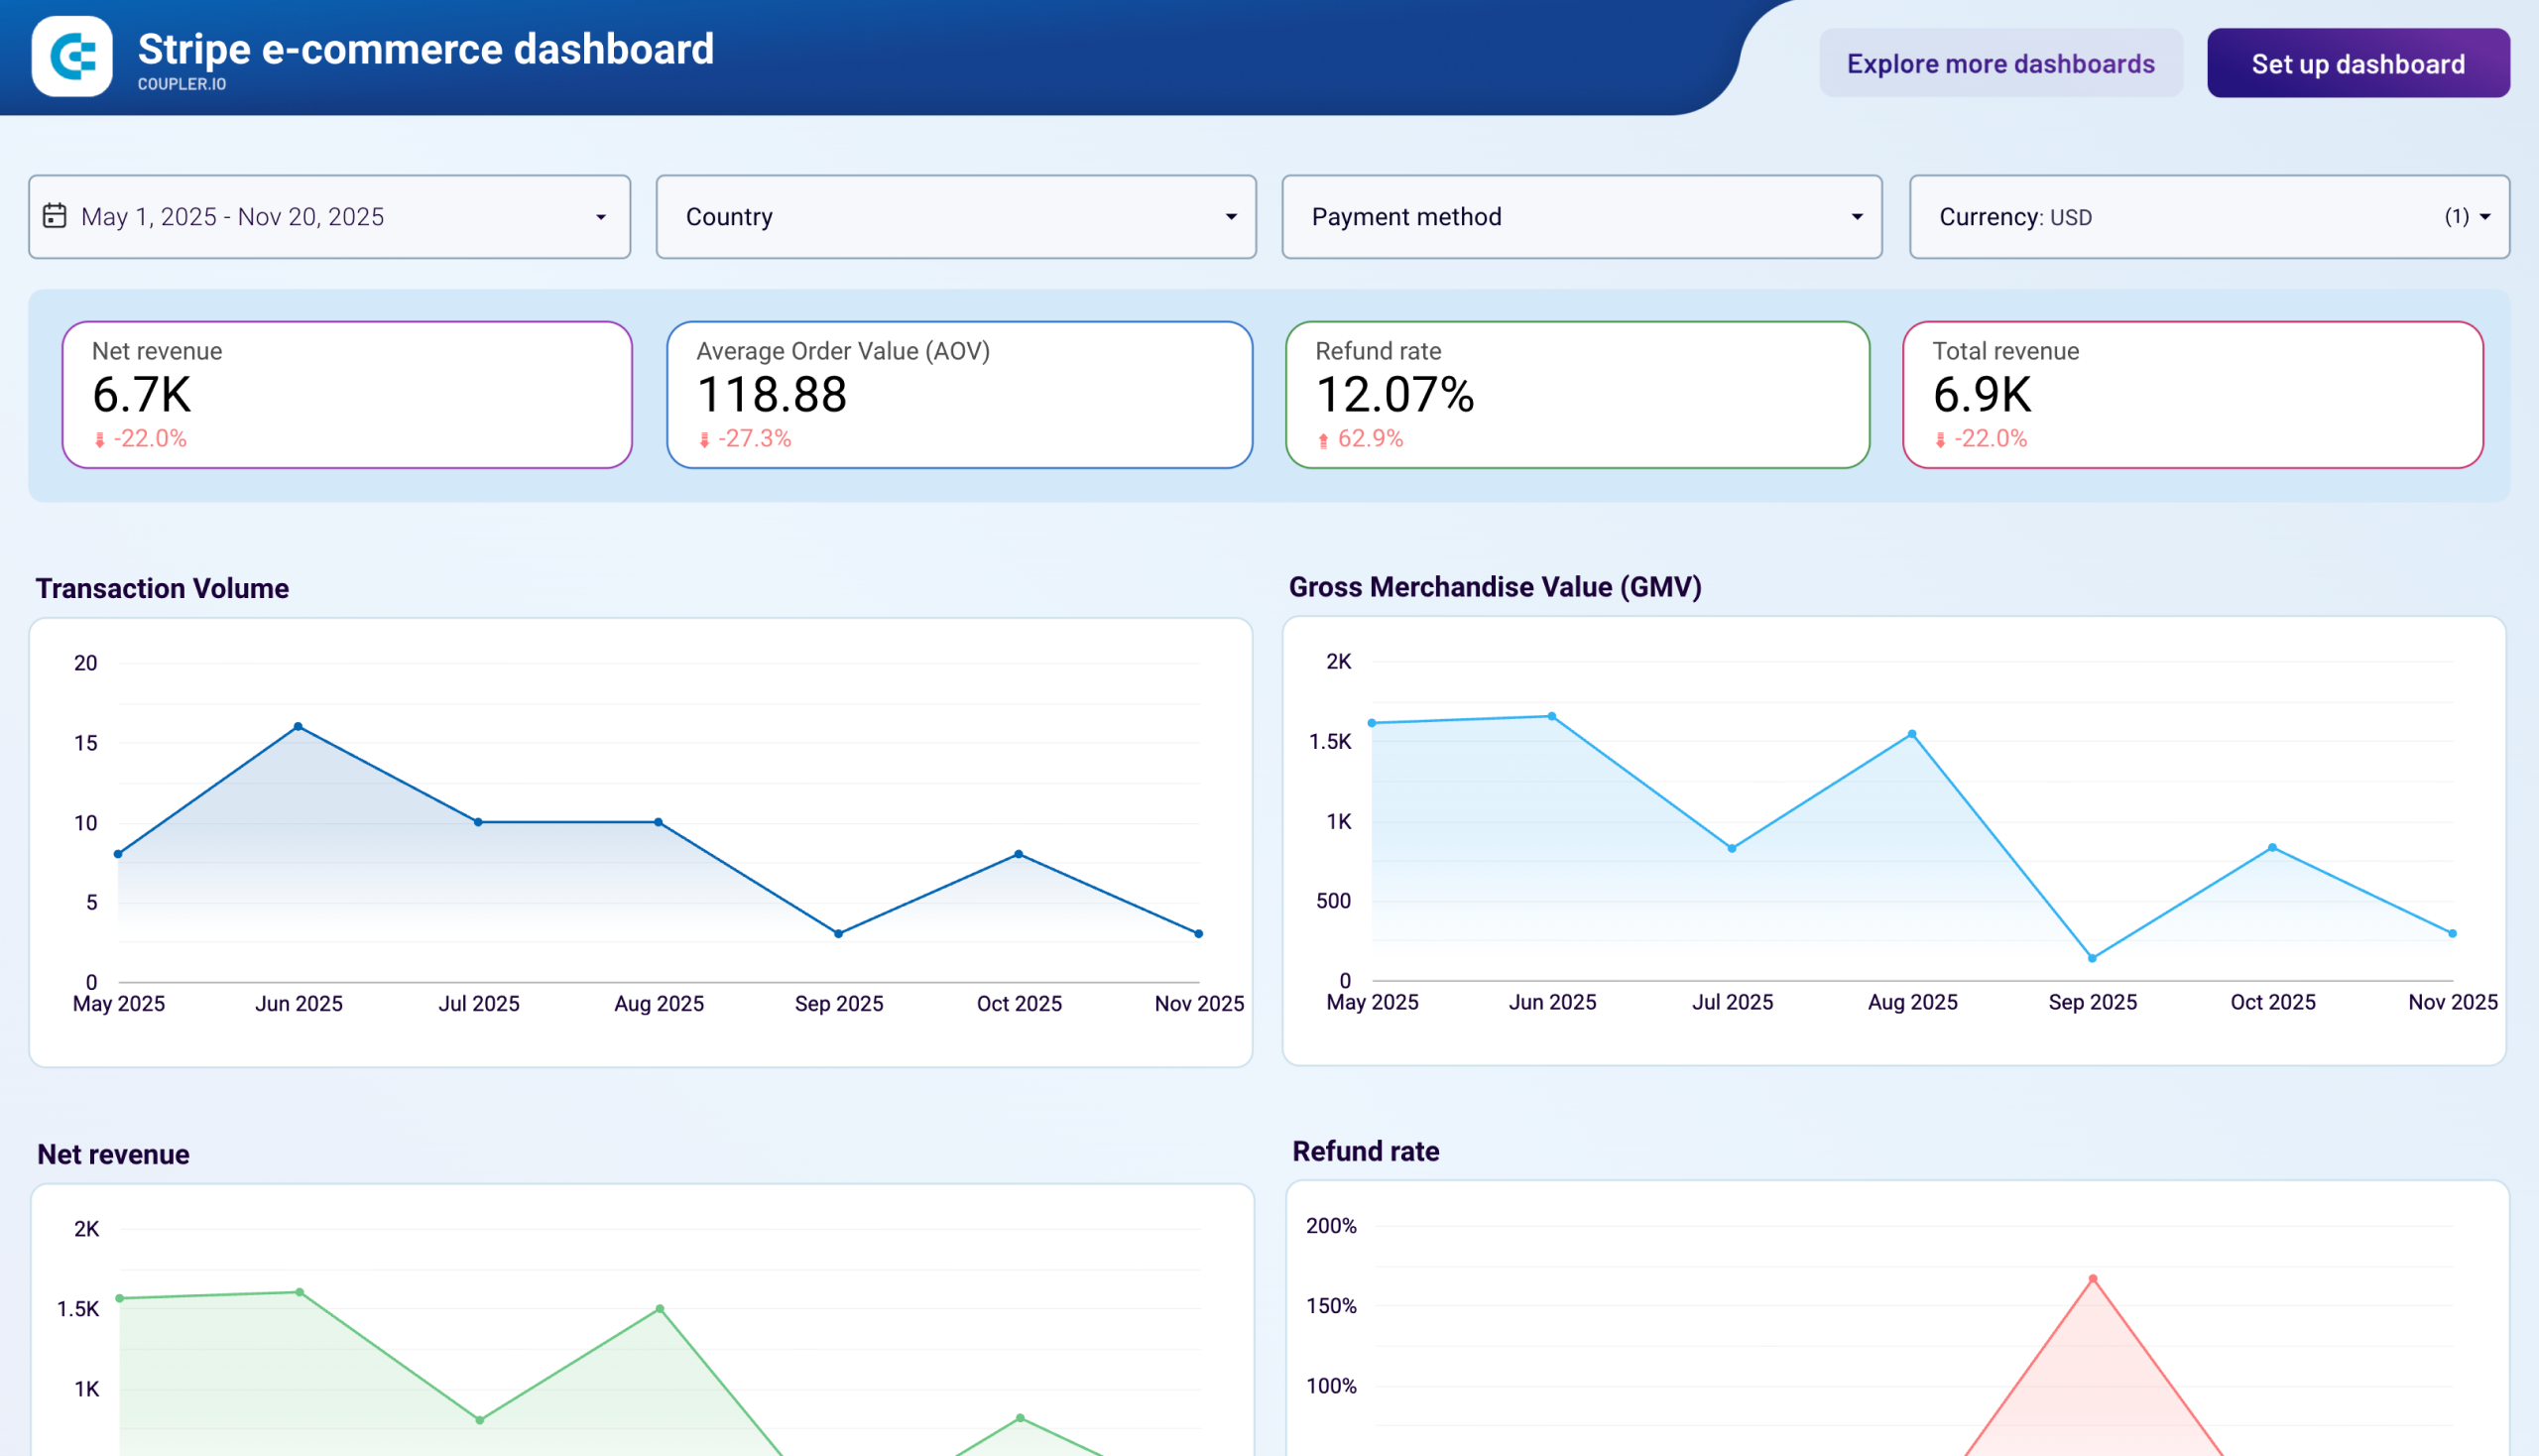
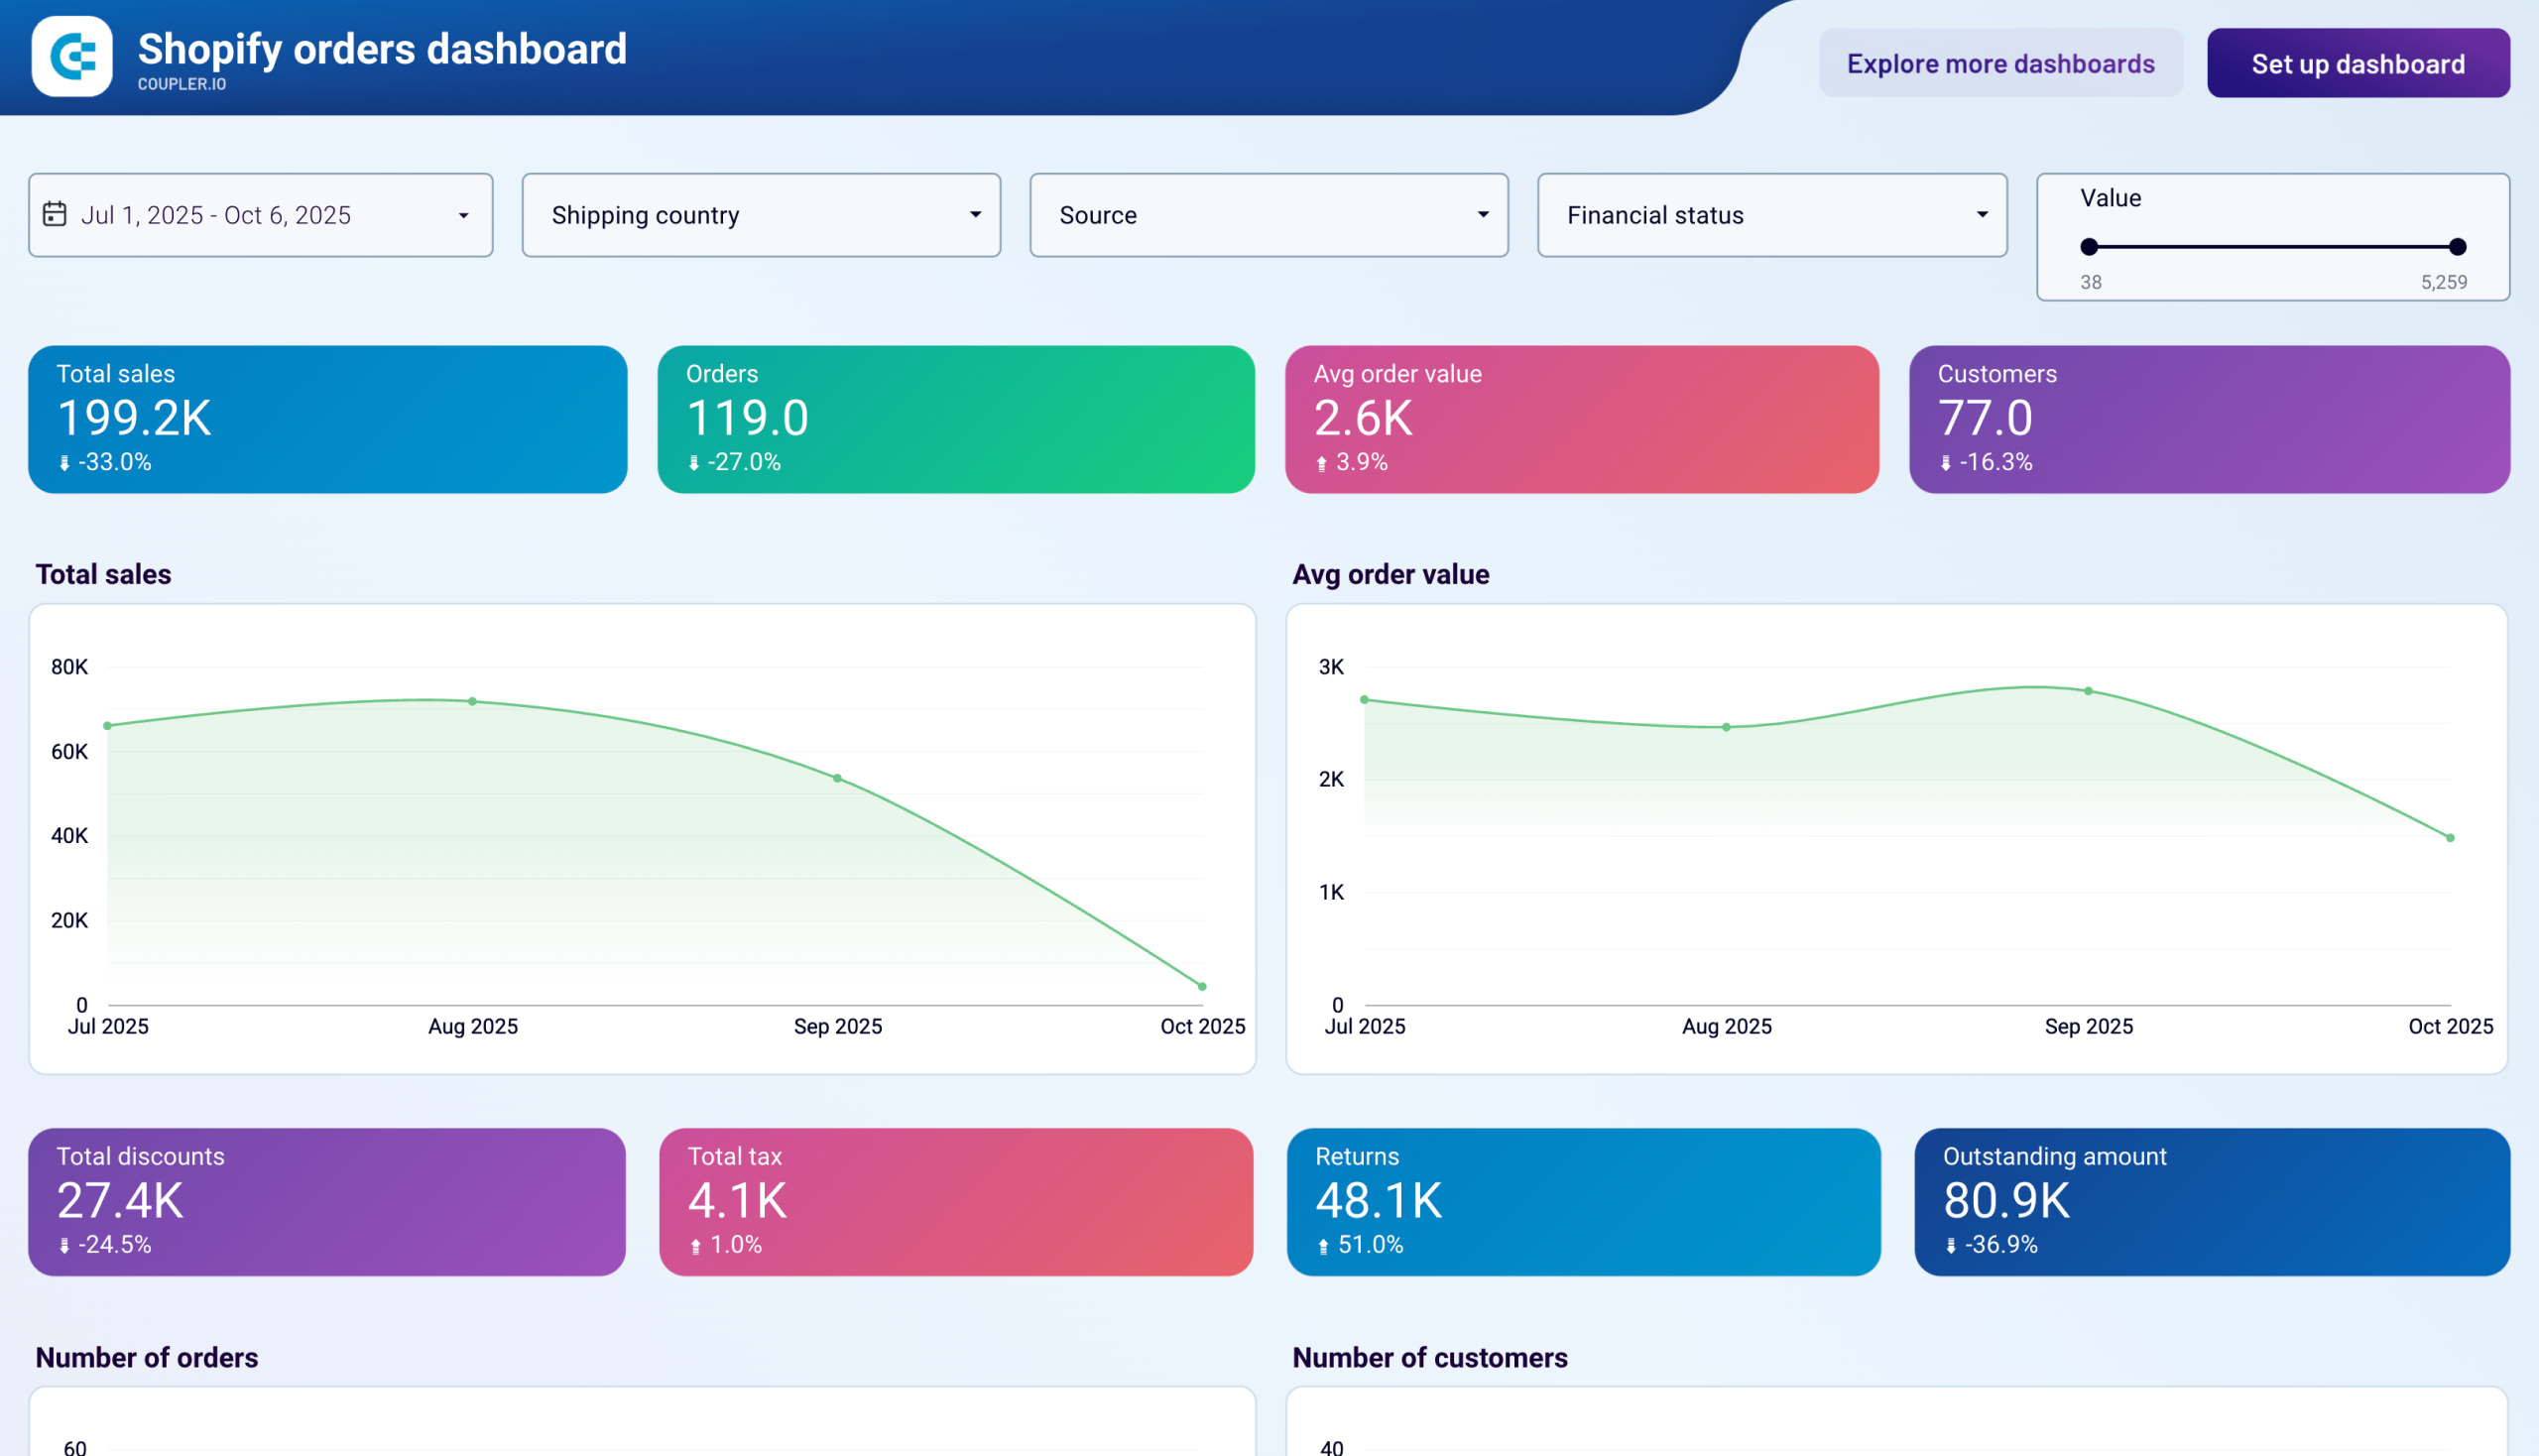
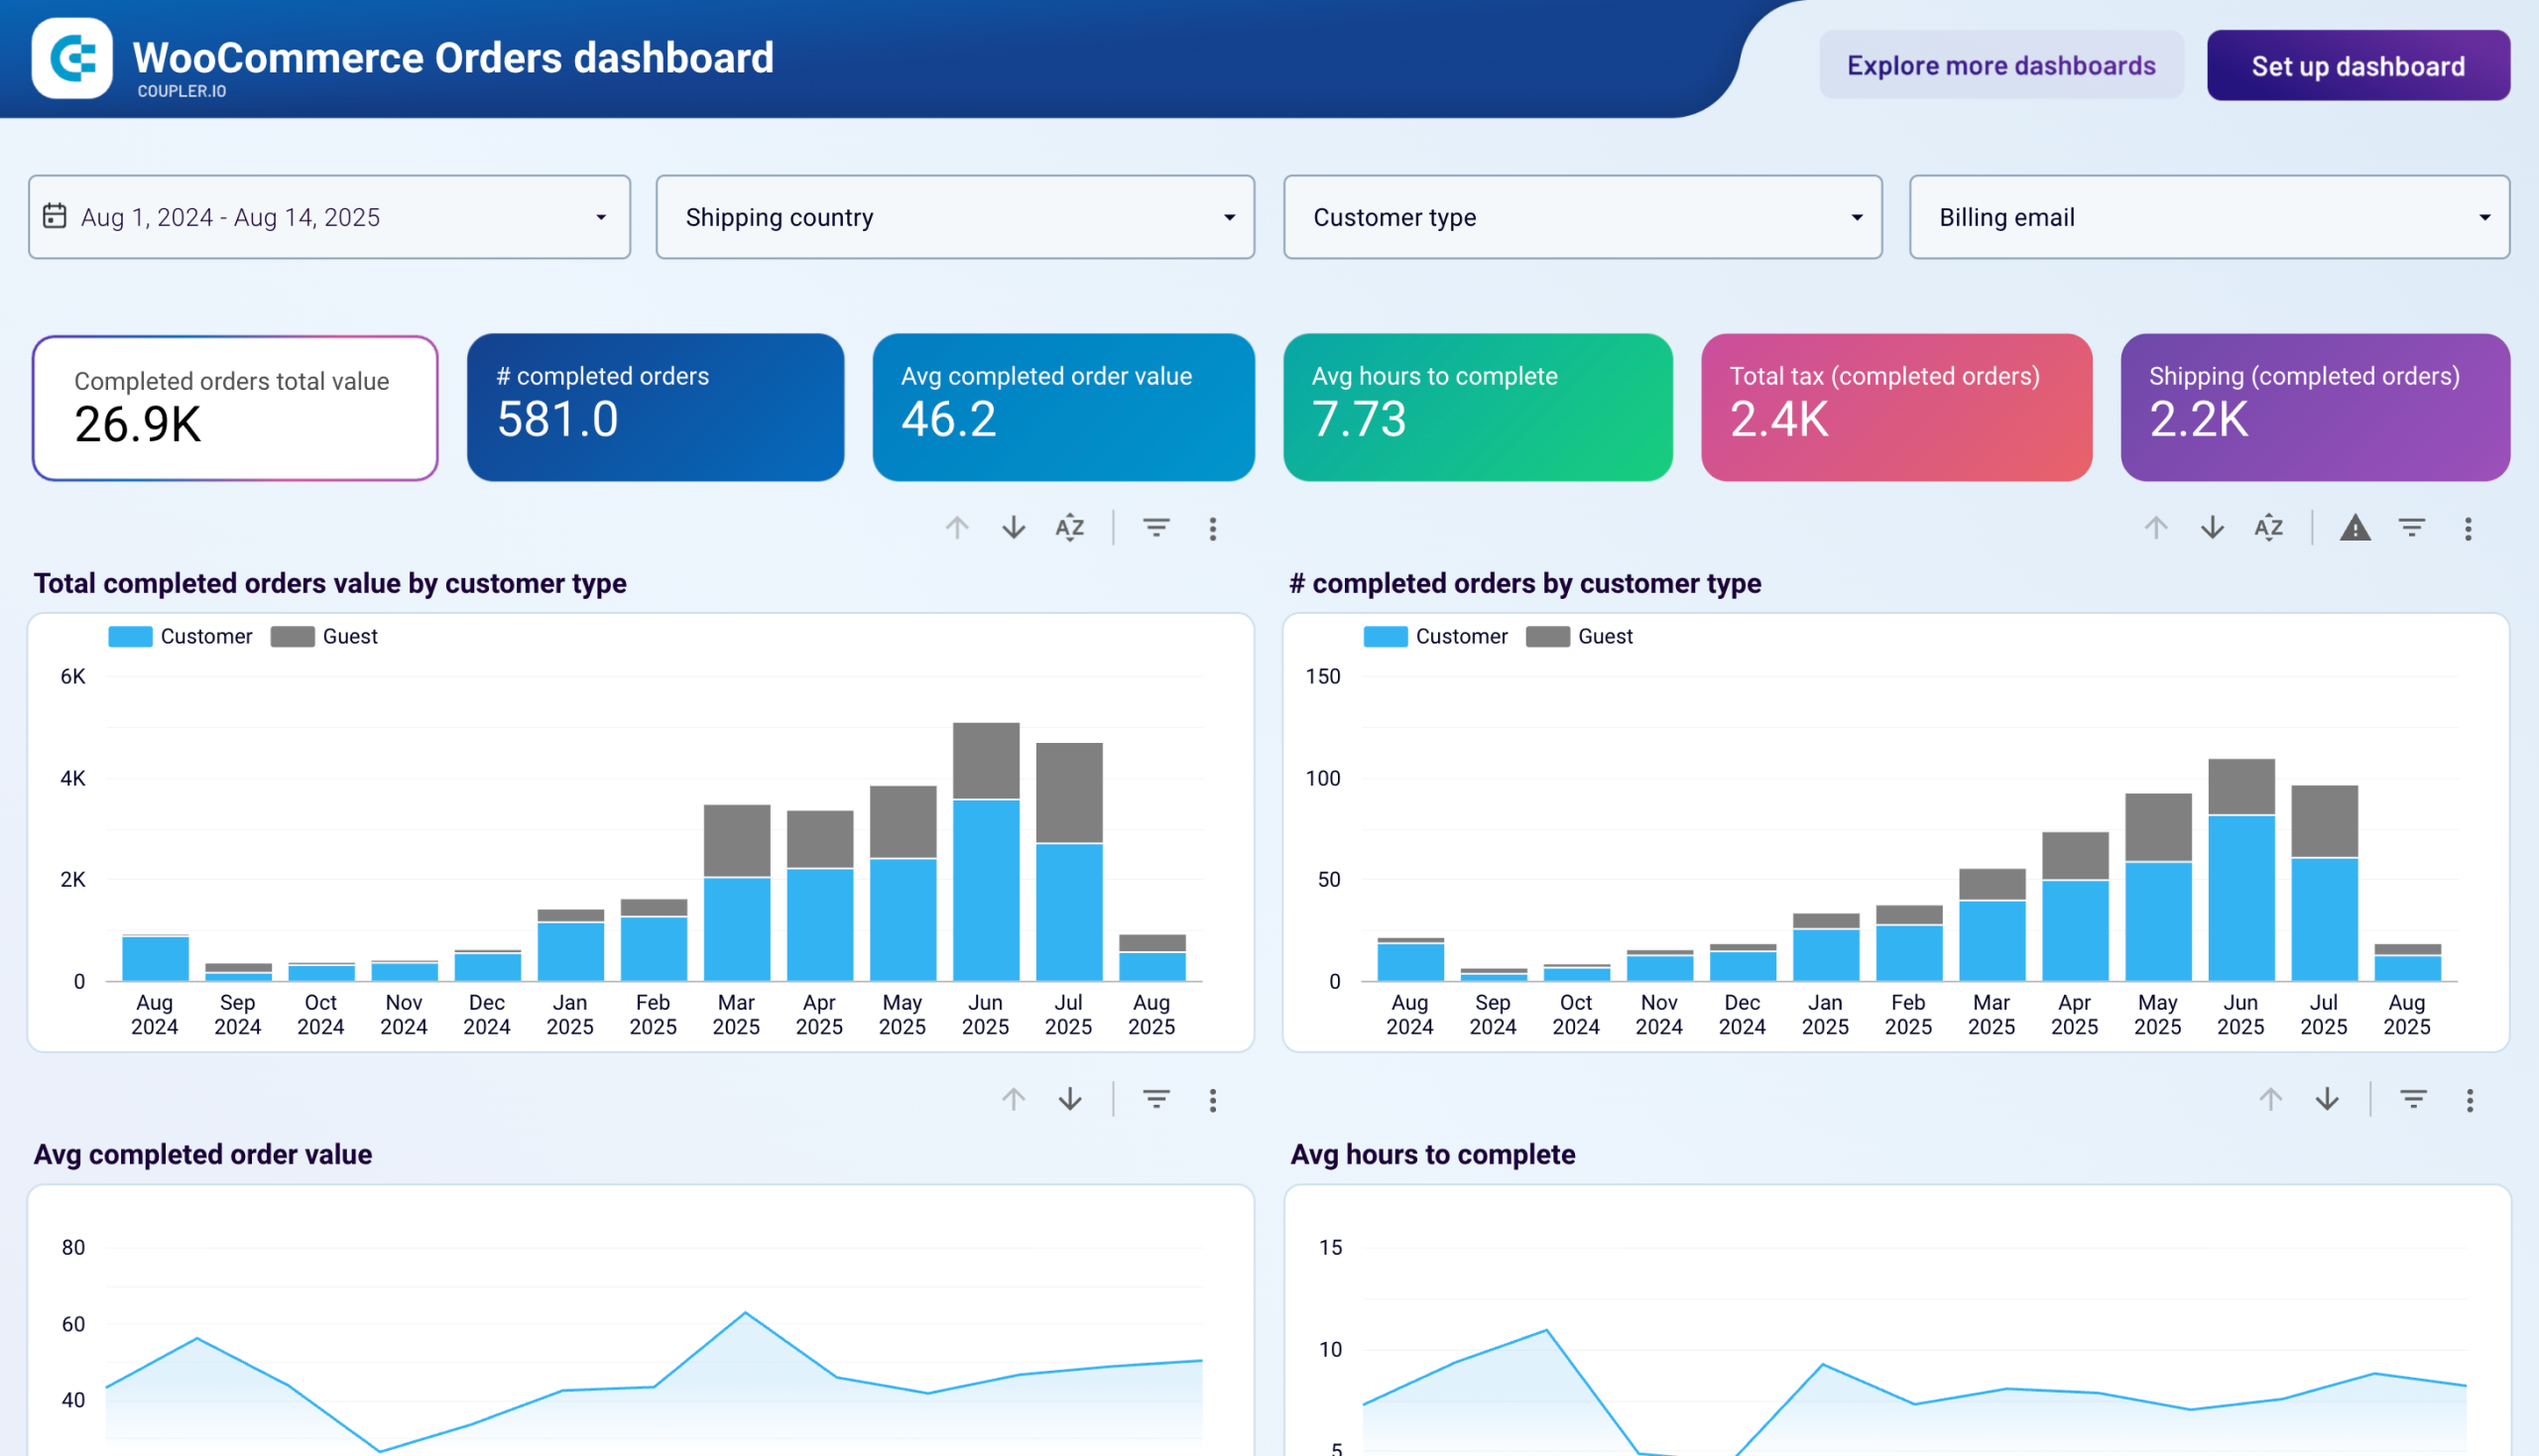
The orders, payments, and financial report brings together transaction data, payment processing outcomes, and accounting results. It covers order volumes, fulfillment speed, charge success rates, refund trends, product revenue, expense categories, and net profitability. You can use it to detect payment method issues, track how top-line sales translate into bottom-line profit, and reconcile store revenue with accounting figures. Data sources include Shopify, WooCommerce, Stripe, and QuickBooks.
What insights you can get with a Looker Studio ecommerce dashboard
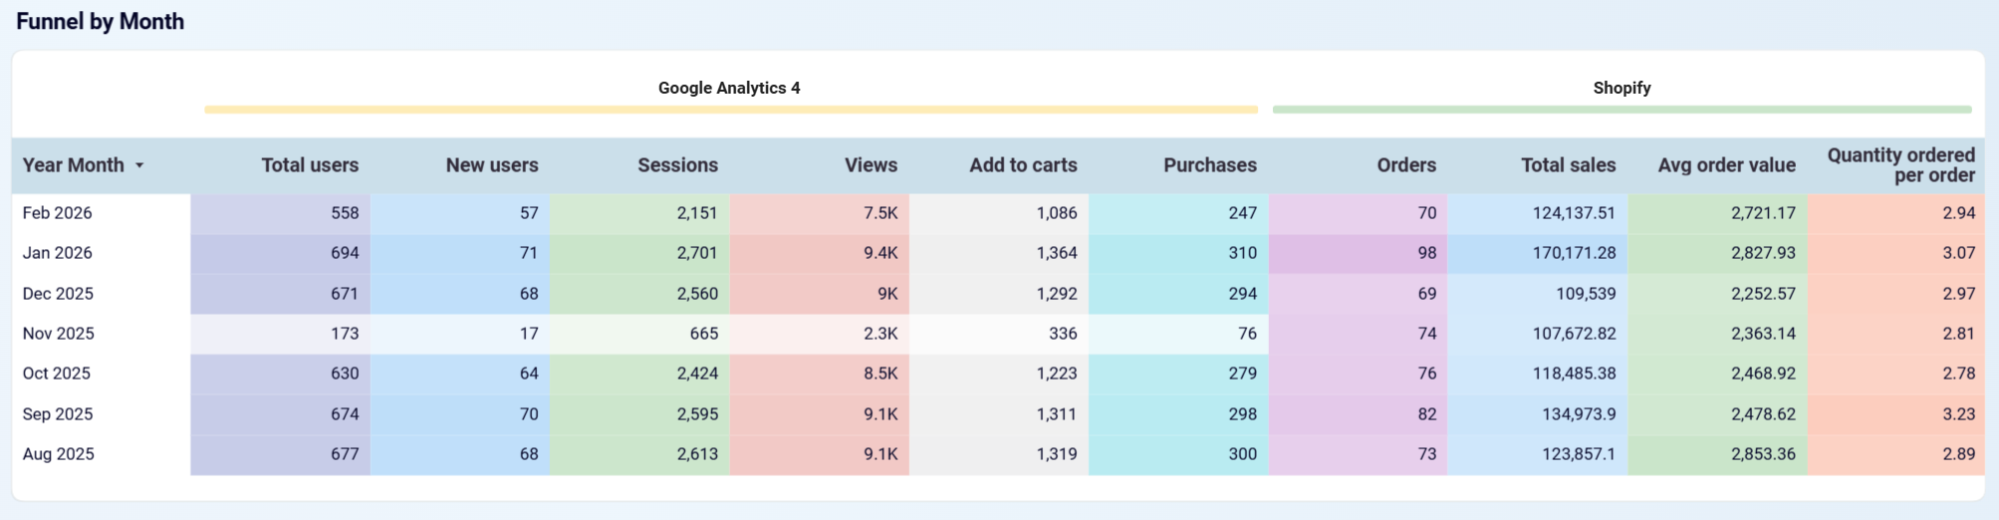
Examine how visitors progress from sessions to add-to-carts, checkouts, and completed purchases over time. Identify the exact stage causing the biggest conversion loss and prioritize fixing that step first.
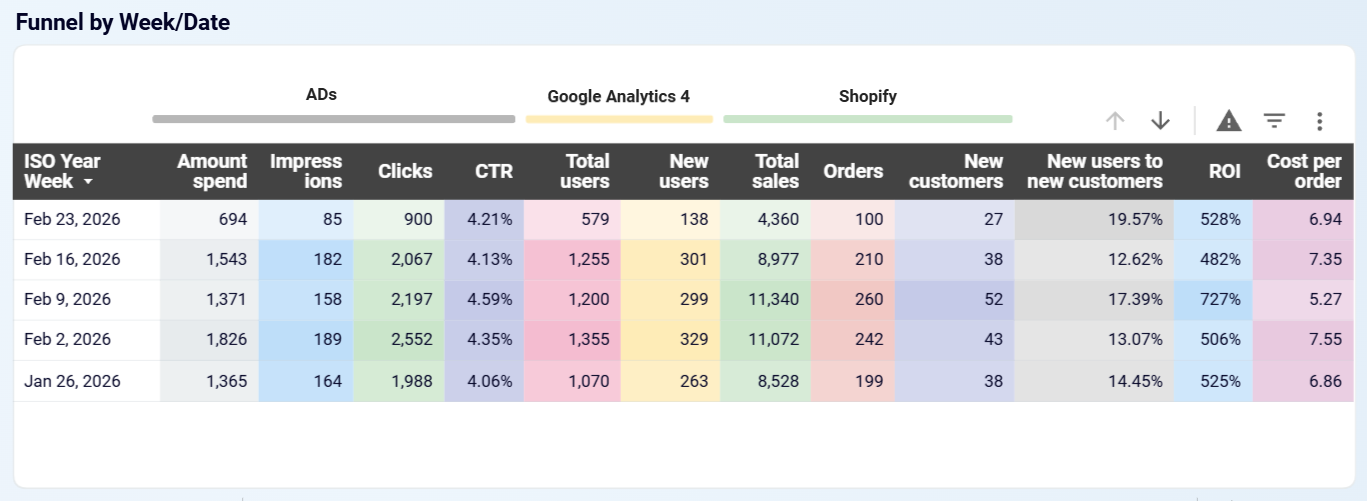
Track the daily and weekly relationship between advertising investment and total sales. Spot periods where increased spend doesn't produce proportional order growth, and identify which platforms deliver the best return per dollar.
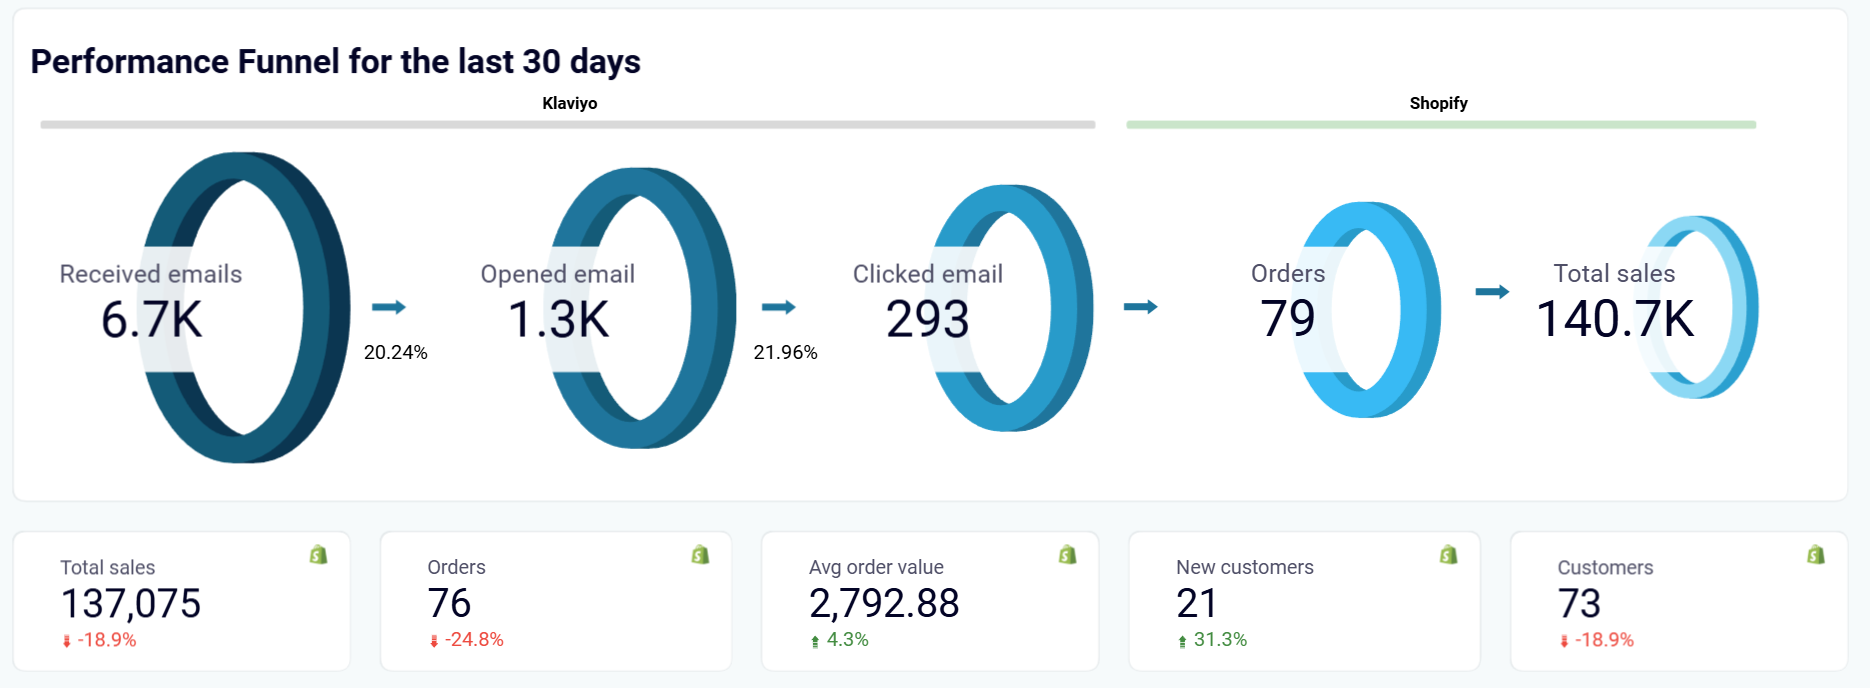
Review the email-to-revenue funnel to see exactly how many recipients open, click, and purchase. Determine whether the primary issue is engagement (low opens or clicks) or post-click conversion (clicks that don't lead to orders).
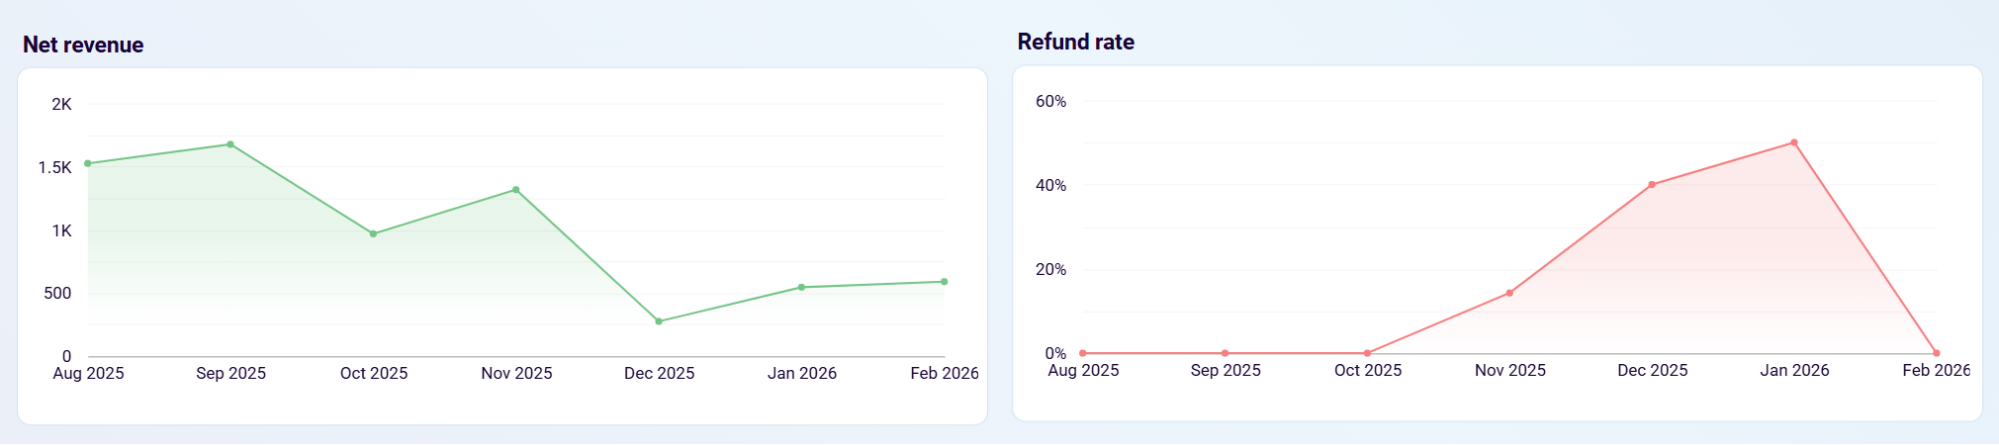
Track your refund rate trend alongside product revenue contribution to catch sudden increases. Correlate the timing with recent product additions or pricing changes, then investigate the root cause before losses grow.
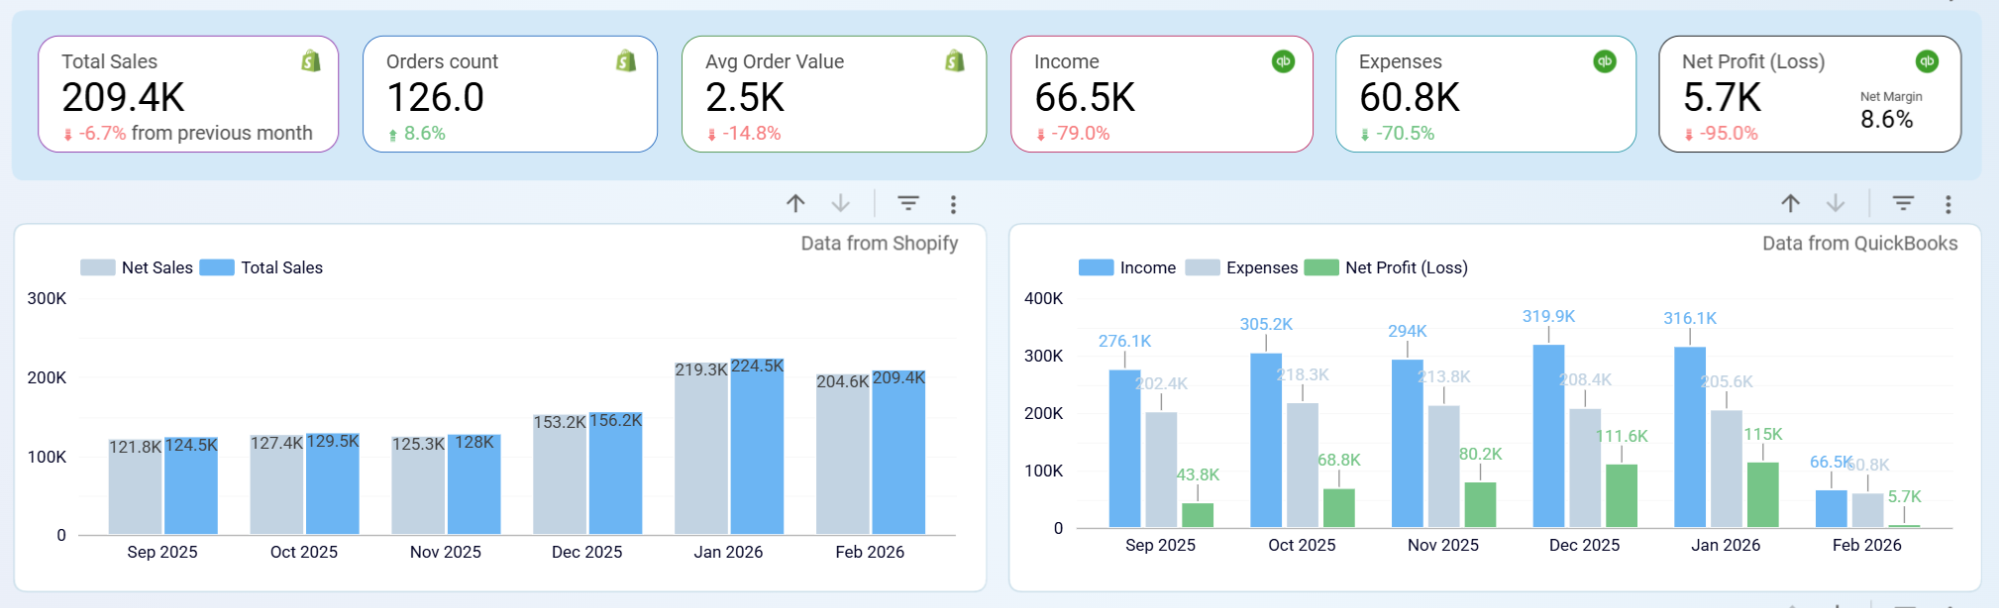
Compare sales trends with expense and profit data on a single timeline. Isolate whether margin erosion comes from rising operating costs, increased returns, or a shift in product mix.
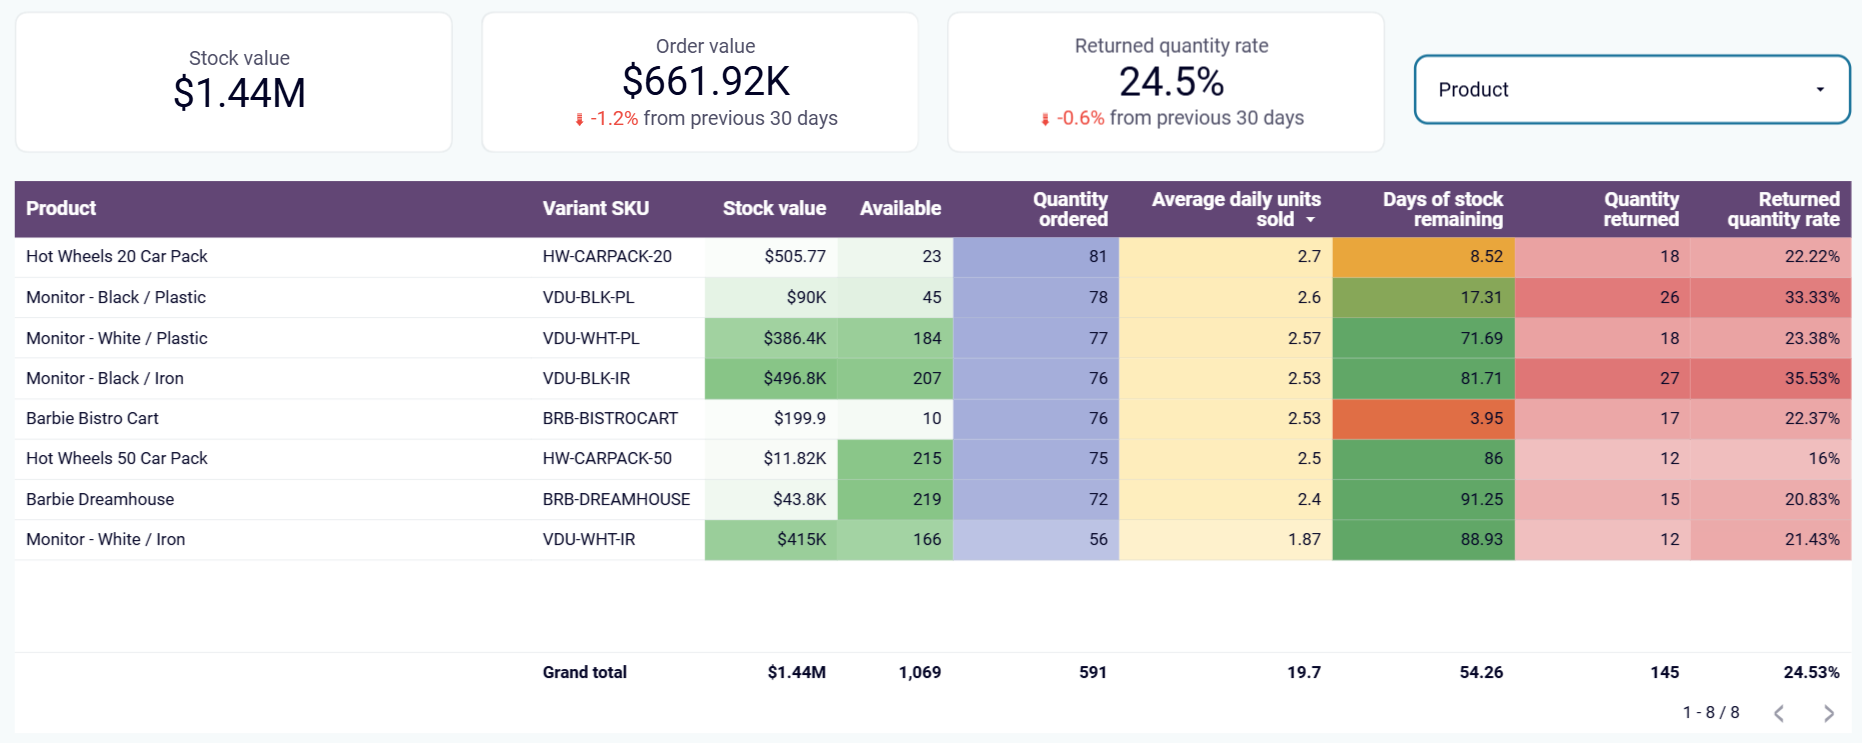
Review inventory levels alongside daily sales velocity and days of stock remaining per product. Flag items approaching stockout so you can adjust procurement timelines and avoid missed sales.
How to create a Looker Studio ecommerce dashboard?

Metrics you can track with a Looker Studio ecommerce dashboard template
Gross revenue from all Shopify orders in the selected period, before discounts, returns, or adjustments. This is the top-line measure of store activity and the starting point for all revenue analysis.
Total sales divided by order count. This metric shows the typical size of a customer transaction and serves as a lever for revenue growth alongside conversion rate improvements.
Actual revenue collected through Stripe after accounting for refunds and failed charges. This represents true earnings from payment processing and gives you the most accurate picture of business income.
The percentage of Stripe transactions that are refunded. Calculated by dividing refunded charges by total successful charges, it flags product quality issues or customer satisfaction problems early.
Income minus expenses as recorded in QuickBooks. This is the bottom-line result for the period and shows what your business actually retains after all costs are covered.
Net profit divided by income, expressed as a percentage. It measures what proportion of revenue survives after all costs — the most direct indicator of financial efficiency for your store.
The total count of visit sessions from Google Analytics 4, where each session represents a continuous period of engagement. This metric shows overall traffic volume flowing into your store.
Revenue generated divided by advertising spend. It measures how effectively your ad budget converts into sales, helping you evaluate campaign profitability across platforms.
The percentage of email clicks that result in a completed order. It shows how well your email campaigns drive actual purchases beyond just generating traffic to your store.
The total count of payment transactions processed through Stripe during the selected period. It indicates the overall business activity level and checkout traffic independently of revenue amounts.