Looker Studio social media dashboard examples and reporting templates
Understand how your social channels perform with Looker Studio social media reporting dashboards that pull data from Instagram, TikTok, Facebook, LinkedIn, and YouTube via Coupler.io. Analyze engagement patterns, track follower growth, and identify your top-performing content to shape a stronger social media strategy.
Looker Studio social media dashboard examples for every need


 +6
+6


about your case. It doesn't cost you a penny 😉
Choose your Looker Studio social media dashboard template to kick off
What is a Looker Studio social media dashboard?
Coupler.io handles the data flow behind these dashboards. It connects to your social accounts, pulls the latest numbers, and loads them into Looker Studio automatically. You set the refresh schedule, and your reports stay up-to-date without manual work. Our Looker Studio social media dashboard templates are designed as ready-to-use starting points for marketers, agencies, and social media teams who need reliable reporting without building dashboards from scratch.

What reports should be included in Looker Studio social media dashboards?
The value of a Looker Studio social media reporting dashboard depends on the reports it covers. A single-platform view tells only part of the story. The reports below address distinct aspects of social media performance and give you enough depth to act on what you find.
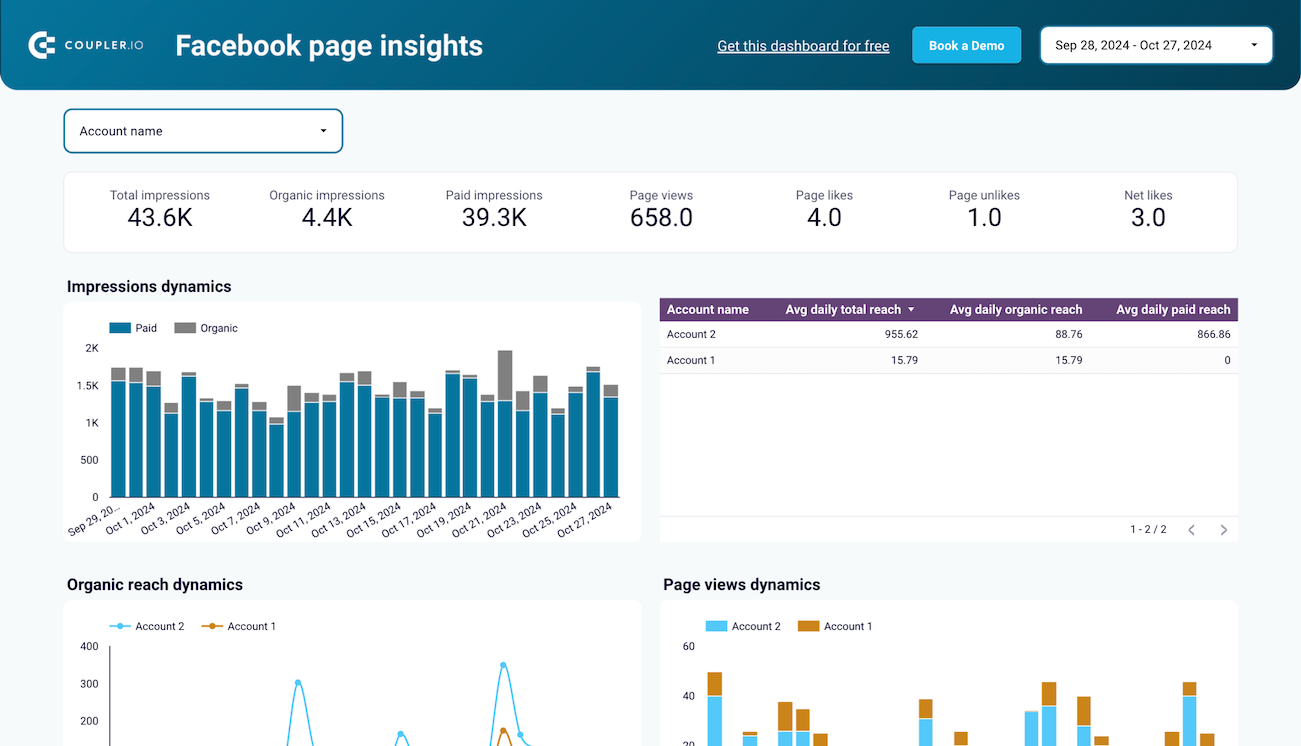
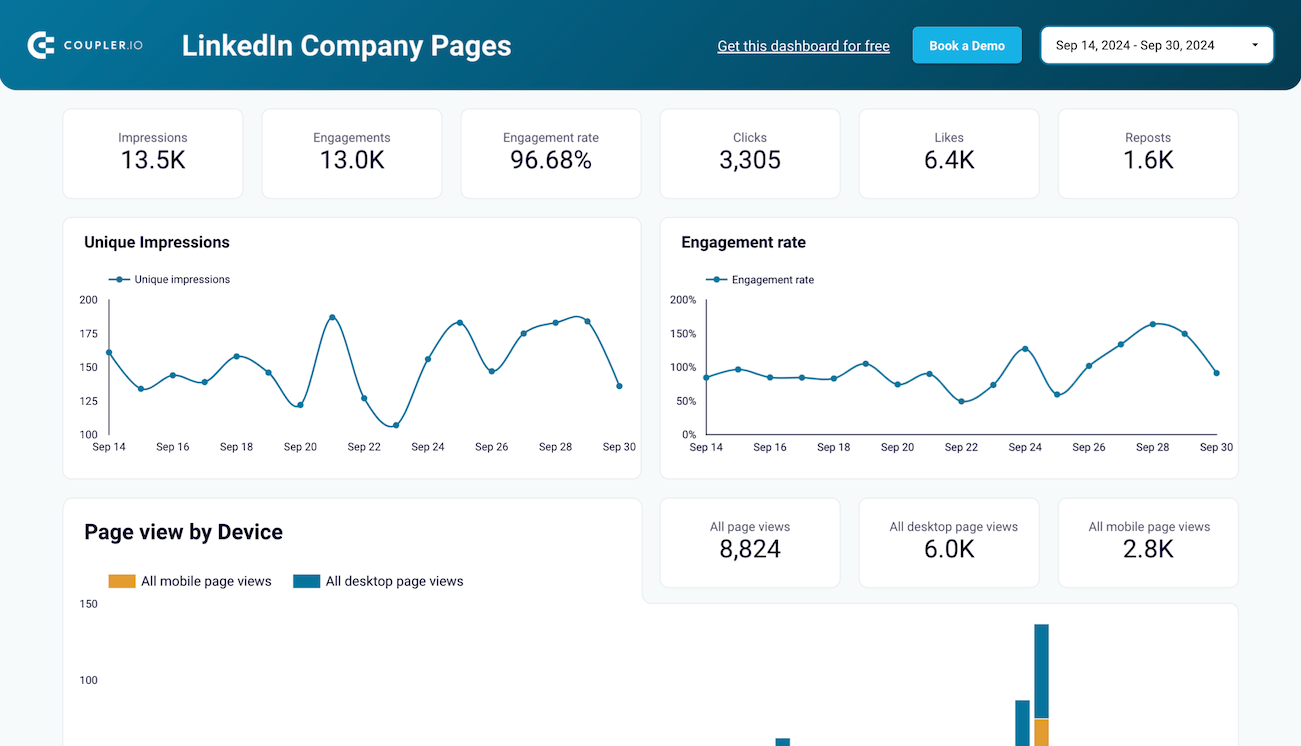
These reports focus on individual channels and their native metrics. An Instagram report tracks reach, engagements, website clicks, and post-level performance. A TikTok report shows your engagement funnel from views to likes to shares. A Facebook report monitors organic and paid impressions alongside page views. YouTube reports cover watch time, subscriber changes, and traffic sources. LinkedIn reports display impressions, engagement rate, and follower growth. Each platform has its own dynamics, and a dedicated report captures them without flattening the detail.
When you run social media across multiple channels, you need a way to compare results side by side. Cross-platform reports consolidate data from Facebook, Instagram, LinkedIn, and YouTube into one view. They integrate GA4 data to show how social channels drive website traffic and conversions. This lets you spot which platforms deliver the strongest results and shift resources accordingly. Without this layer, it's difficult to evaluate where your effort pays off most.
Understanding who interacts with your content matters as much as knowing how many people see it. Audience reports break down your followers by demographics such as age, gender, and geography. On LinkedIn, you can also see follower distribution by company size, seniority, and industry. Engagement reports highlight how users interact with your posts through likes, comments, shares, and saves. Together, they help you tailor your content strategy to the people actually paying attention.
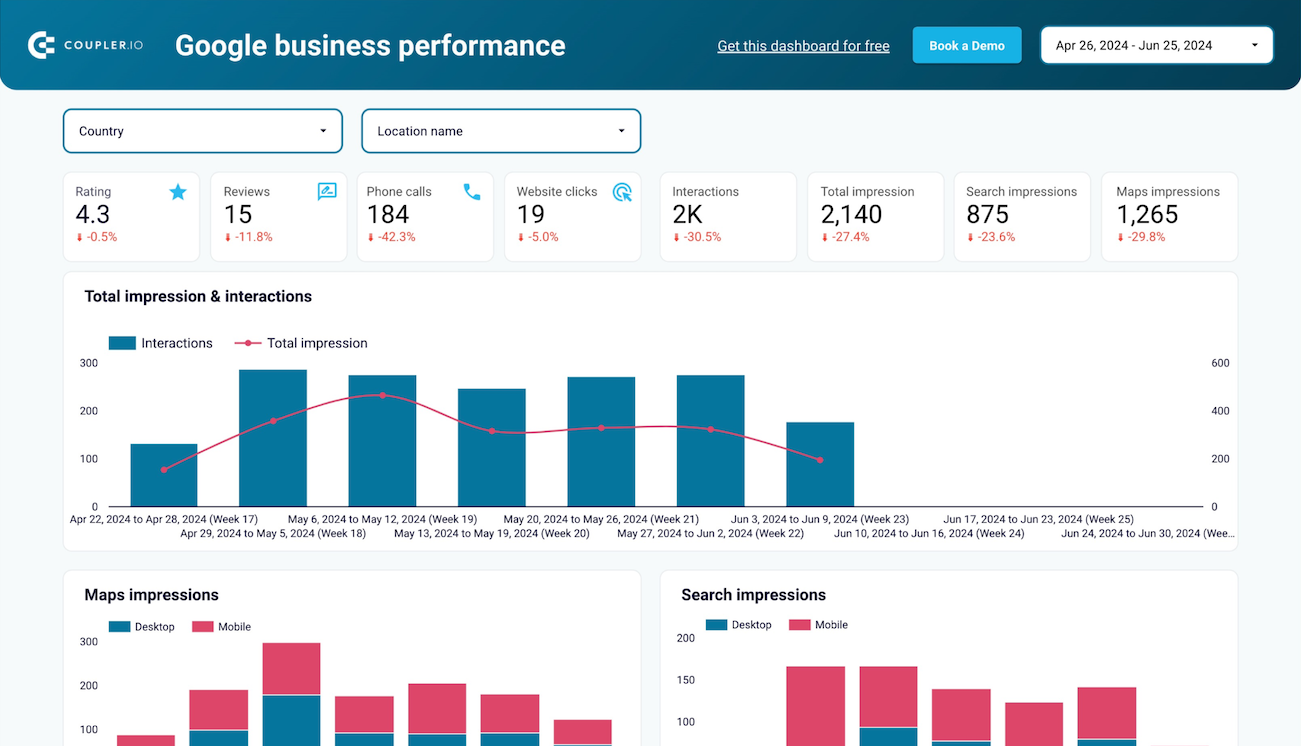
These reports connect your social media activity to broader business outcomes. A brand awareness report compares ad impressions across platforms with branded search volume in Google Search Console. This reveals whether your campaigns actually translate into brand recognition. A website traffic report from YouTube shows how video links drive visitors to your site and whether those visits lead to purchases. A Google Business Profile report tracks how your local presence performs through search impressions, phone calls, and website clicks.
What insights you can get with a Looker Studio social media dashboard
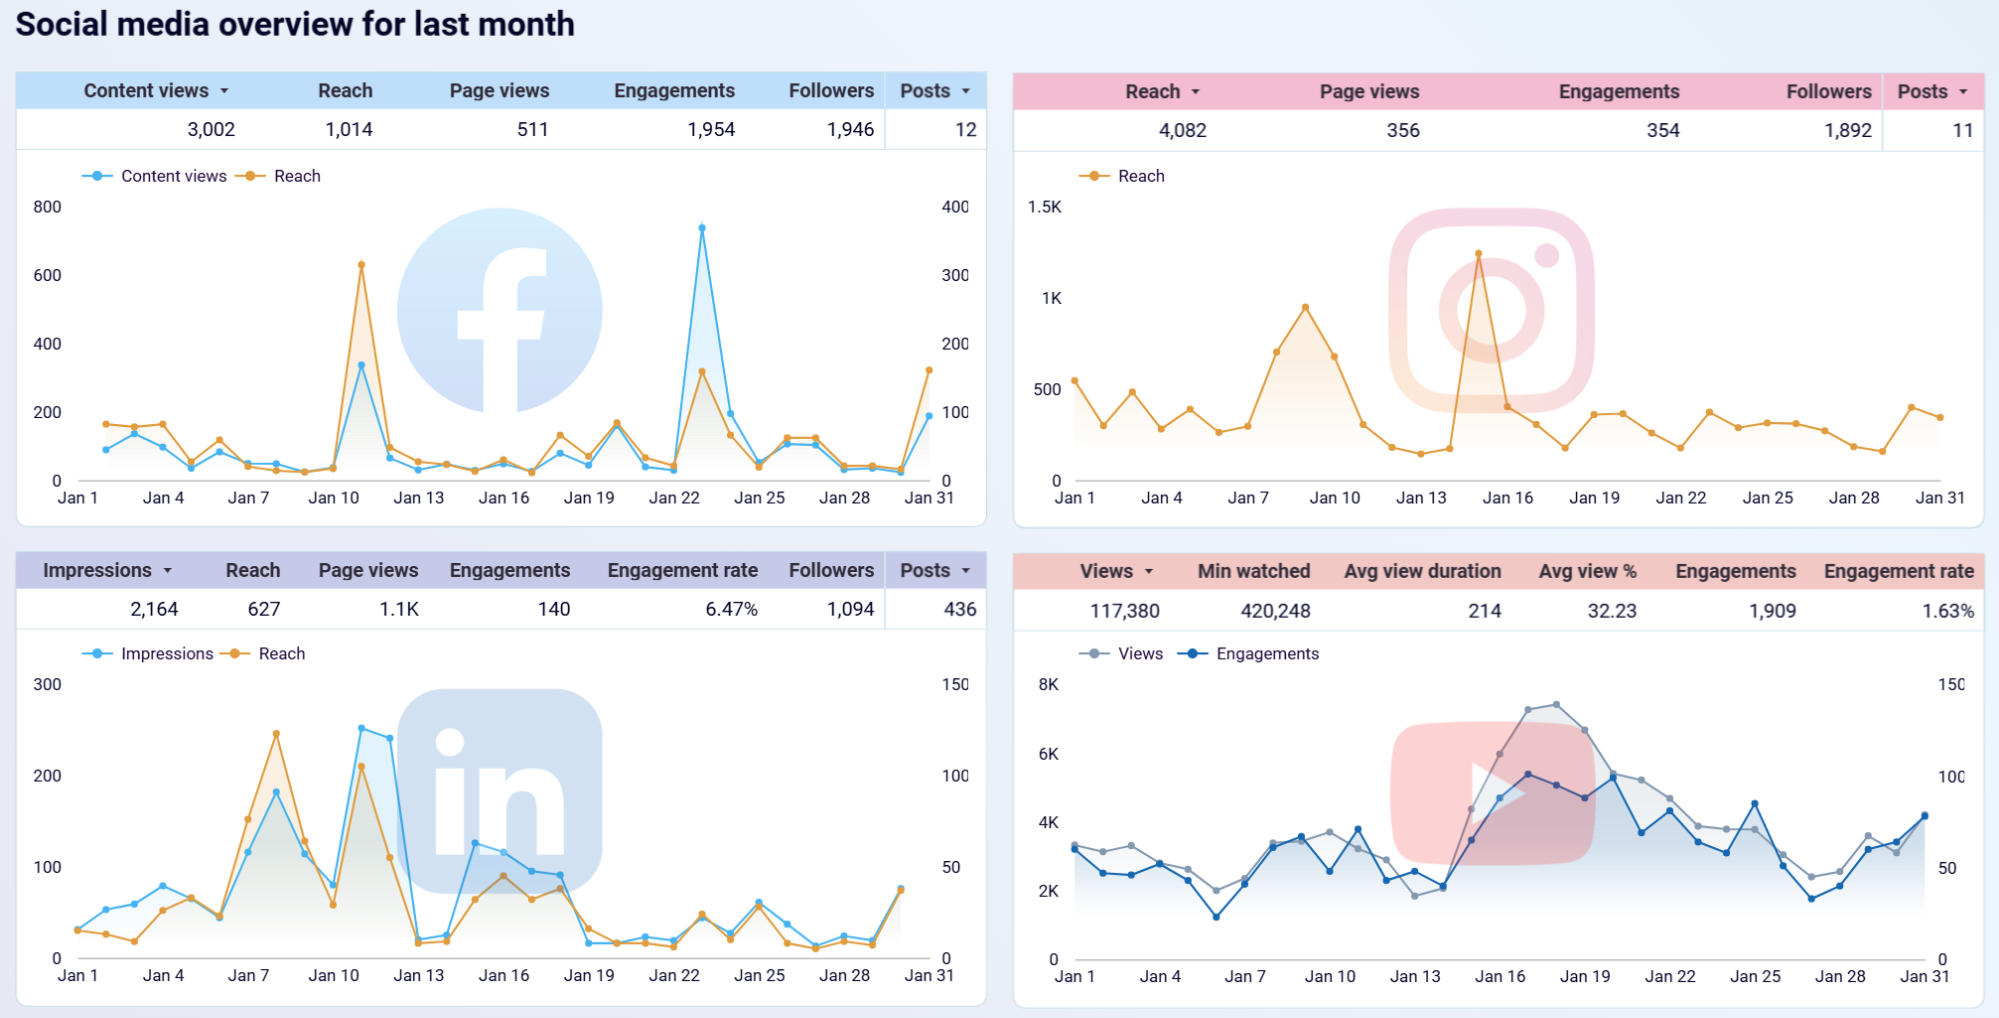
Review each platform's performance breakdown and last month's dynamics on one screen. The dashboard combines data from Facebook, Instagram, LinkedIn, and YouTube alongside GA4 traffic metrics. Identify which channels contribute most to your website traffic and prioritize your efforts there.
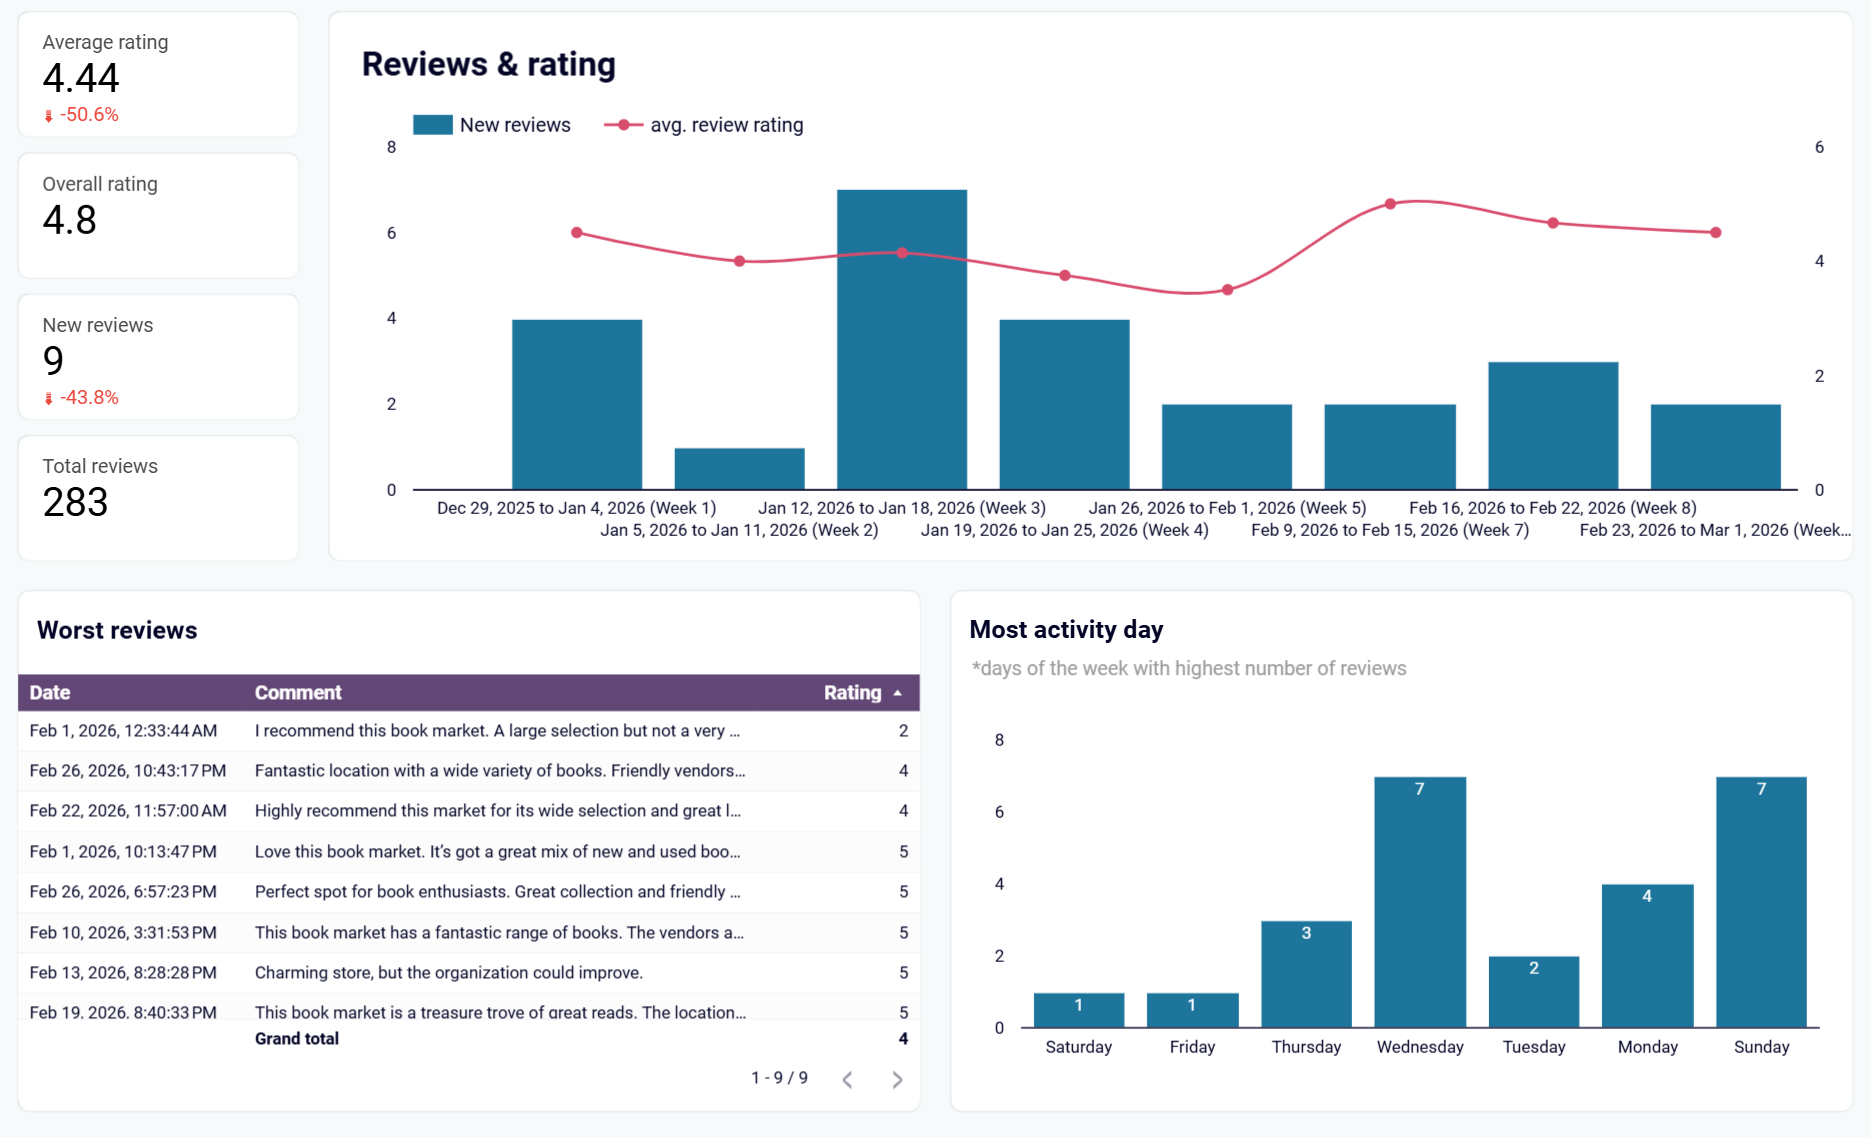
Review how your average rating shifts week by week and which periods generate the most new reviews. Spot recurring complaints early by filtering your lowest-rated feedback. Identify the days when customers leave reviews most often so you can respond promptly and protect your reputation.
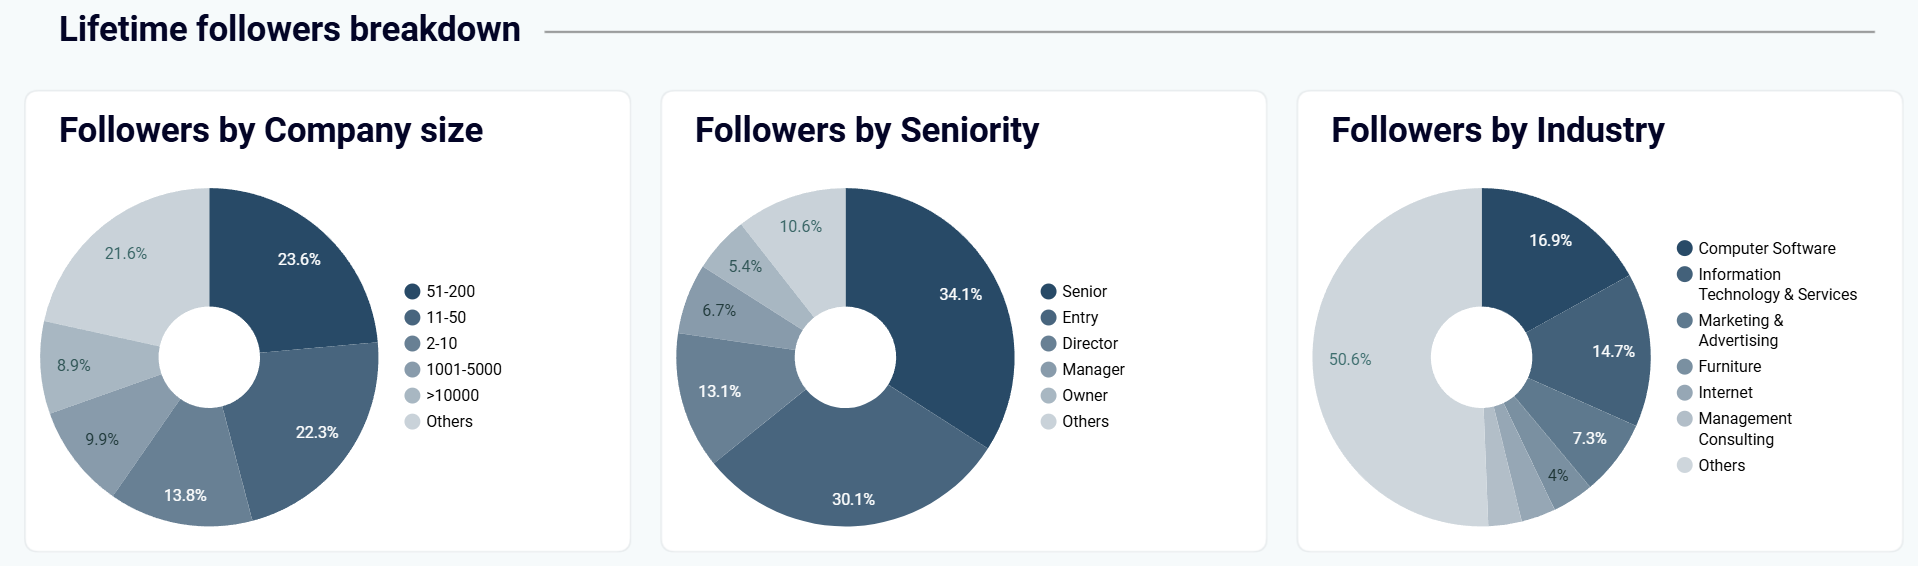
Explore follower details by seniority, company size, job function, and industry. Use this data to check whether your content attracts the decision-makers you're targeting. Adjust your posting topics if your actual audience doesn't match your ideal customer profile.
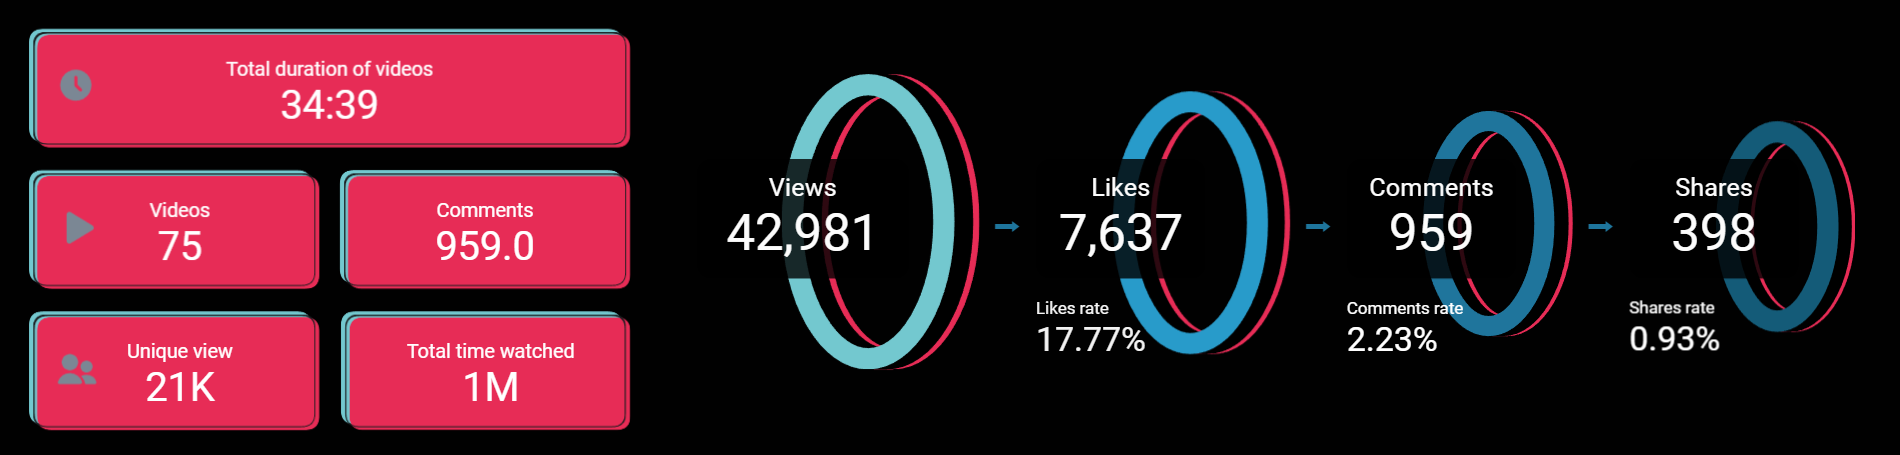
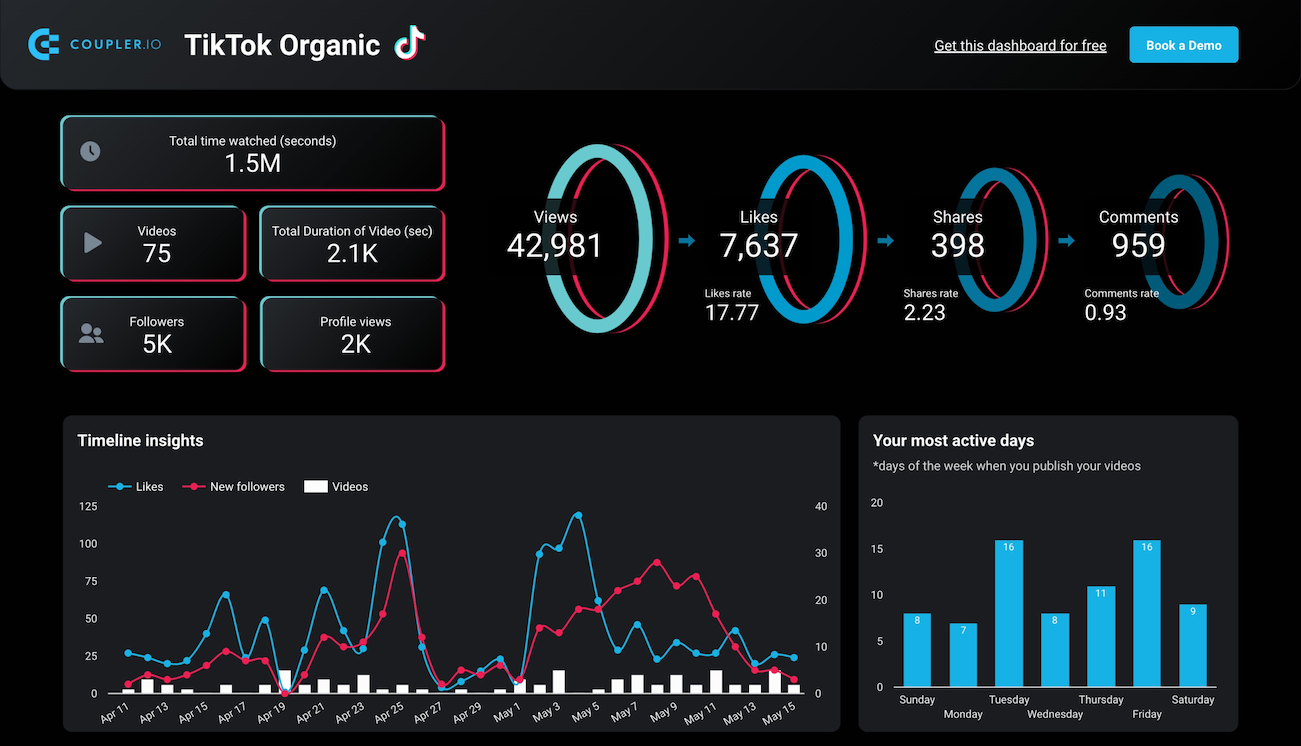
Walk through an engagement funnel that moves from views to likes to shares to comments. Pinpoint where your audience drops off at each stage. If views are high but shares are low, your content captures attention but doesn't motivate people to spread it.
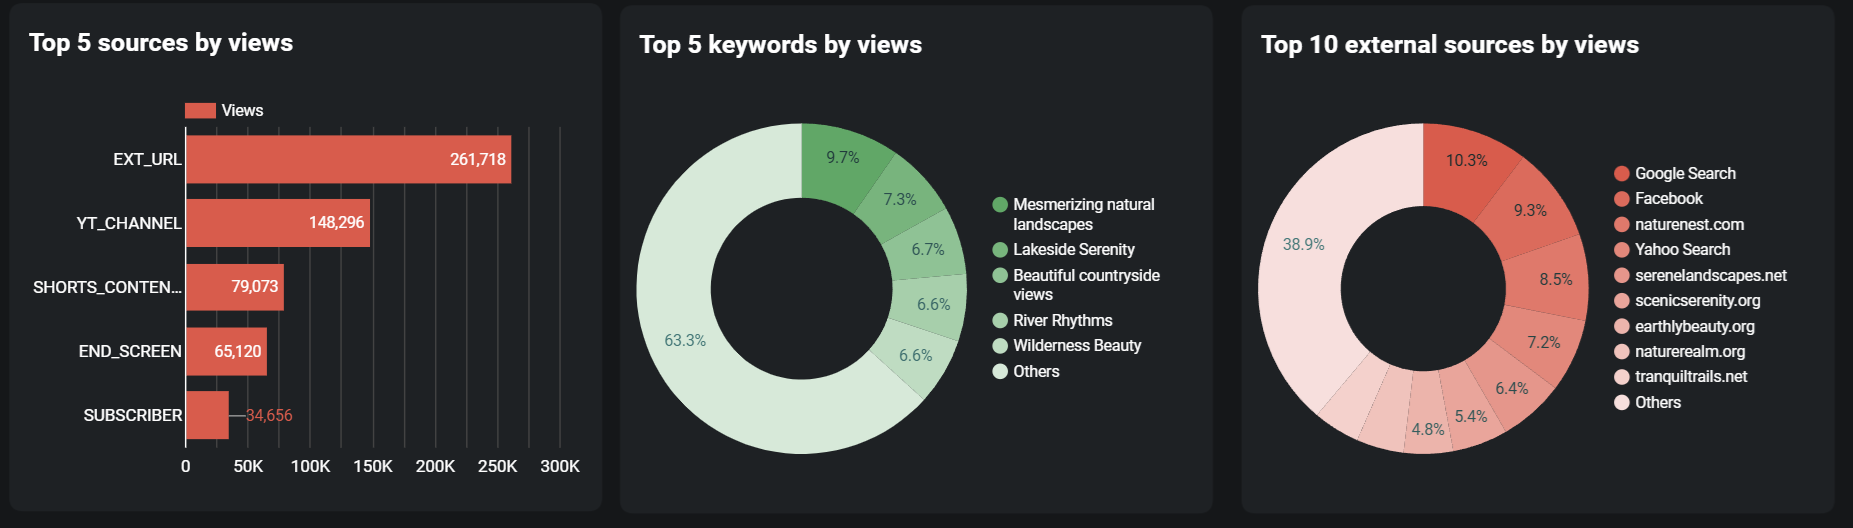
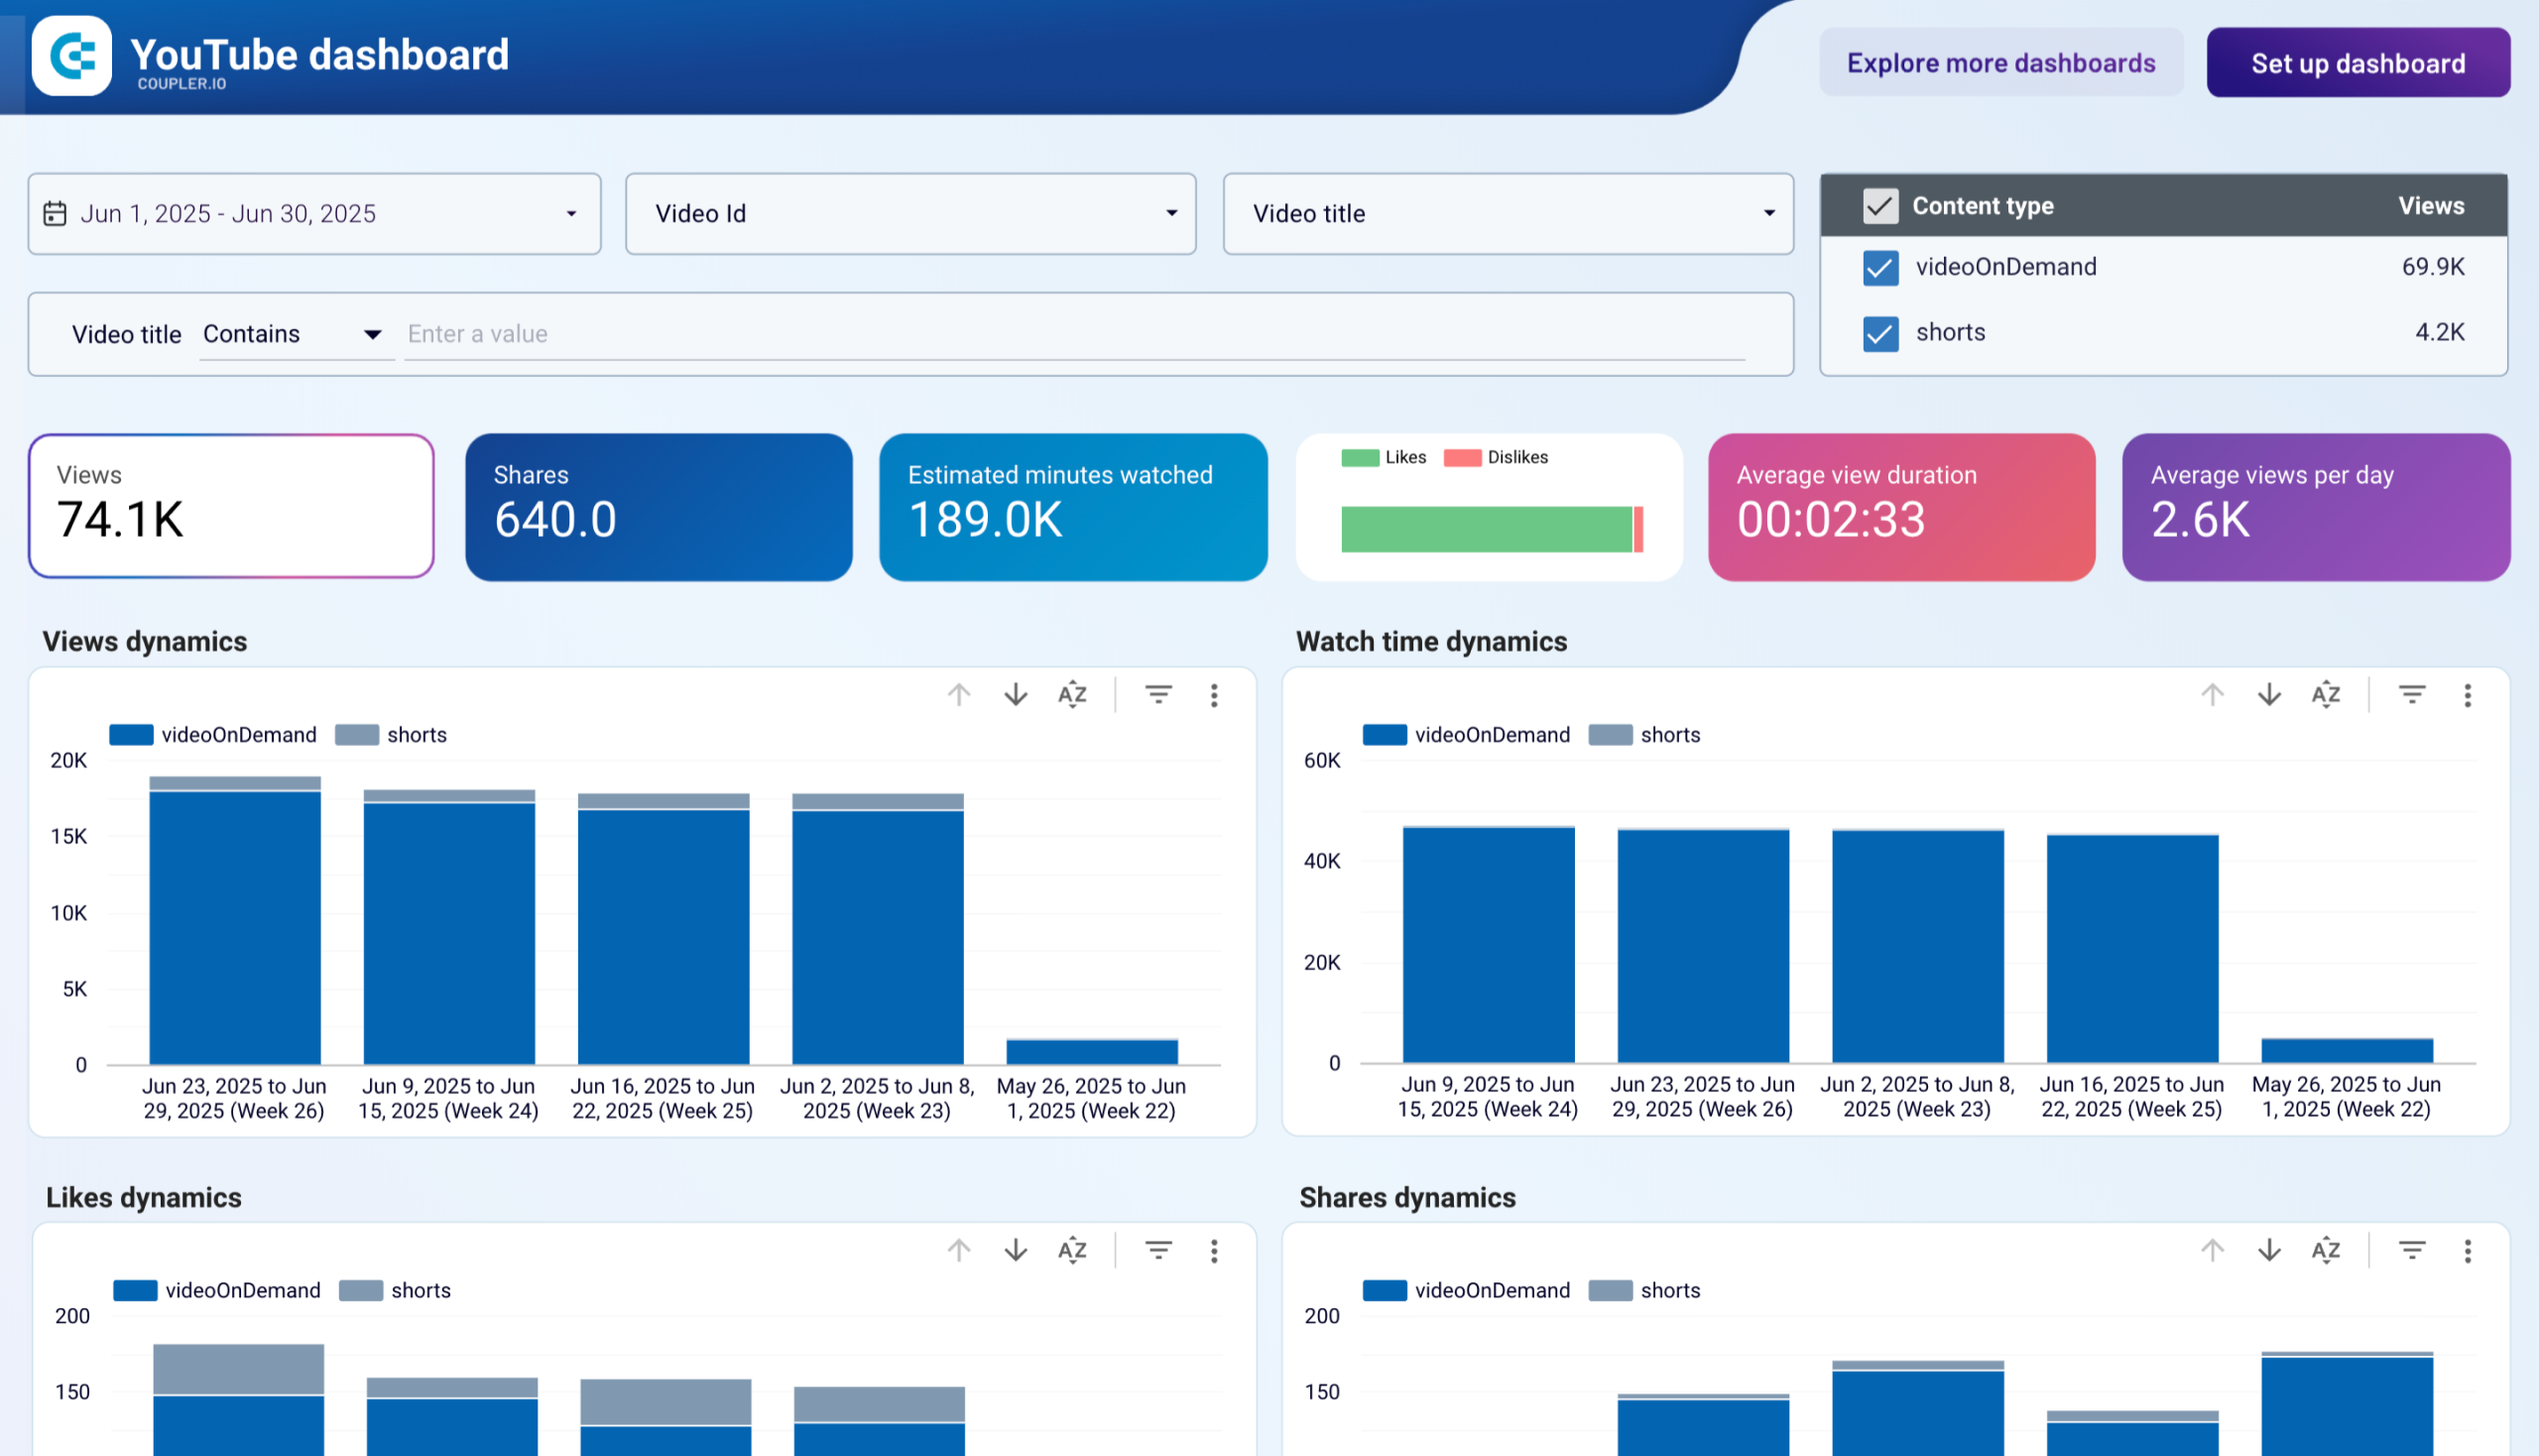
Analyze your top traffic sources ranked by views, including YouTube Search, Shorts, suggested videos, and external websites. The dashboard also surfaces the top keywords that drive viewers to your channel. Double down on the discovery channels that already work for you.
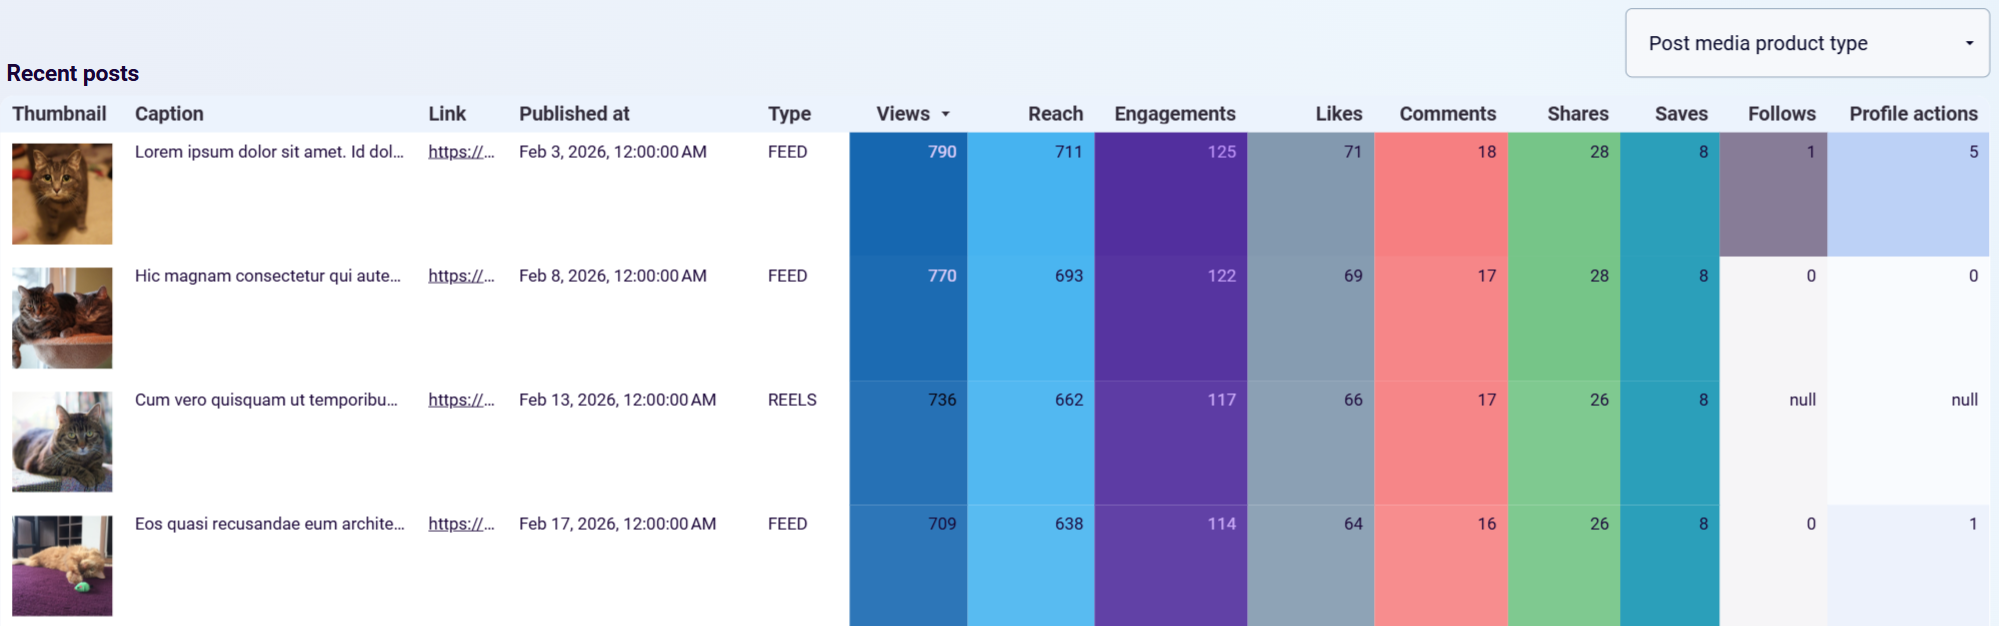
Check which posts attract non-followers by reviewing the views by follow type breakdown. It shows how much of your reach comes from people who don't follow you yet. Find the posts with the highest non-follower views and replicate what works to grow your organic audience.
How to create a Looker Studio social media dashboard?

Metrics you can track with a Looker Studio social media dashboard template
The number of unique users who saw your content during a selected period. This metric is available for Instagram and Facebook, where it separates organic reach from paid reach. Track reach over time to measure how effectively your posts penetrate your target audience.
The total number of times your content was displayed, including repeated views by the same user. Available across Instagram, Facebook, LinkedIn, and YouTube dashboards. Compare impressions against reach to understand how often people see your content more than once.
The percentage of interactions relative to impressions or reach, depending on the platform. LinkedIn dashboards calculate this based on clicks, likes, reposts, and comments divided by impressions. Use engagement rate to evaluate content quality independent of audience size.
The count of users subscribed to your account or page. Instagram, TikTok, LinkedIn, and Facebook dashboards track this metric along with follower changes over time. Monitor net subscriber change to assess whether your content strategy attracts more followers than it loses.
The number of times your video content was watched. YouTube dashboards track total views, average views per day, and views by traffic source. TikTok dashboards include views as the top of the engagement funnel. Use views alongside watch time to gauge content relevance.
The total minutes users spent watching your video content. Available in YouTube dashboards, this metric reflects how well your videos retain viewers after the initial click. Higher watch time signals that your content holds attention, which also influences YouTube's recommendation algorithm.
The number of times users clicked a link to your website from your social profile or posts. Instagram and Google Business Profile dashboards track this metric. It connects your social media presence directly to website traffic and helps evaluate how well your profiles drive visitors.
The number of times users visited your social media page or profile. Facebook and LinkedIn dashboards break this down by device (desktop vs. mobile) and by country. Track page view trends to understand how discoverable your profile is and whether your content drives people to learn more about your brand.