Instagram Ads dashboard examples and reporting templates
Monitor spend, placements, creative performance, and audience behavior across your Instagram ad accounts — all in one place. Coupler.io connects to your Meta Ads data and keeps your Instagram Ads dashboard updated on a schedule, so your reporting is always up-to-date without manual exports.
Instagram Ads dashboard examples for every need


about your case. It doesn't cost you a penny 😉
Choose your Instagram Ads dashboard template to kick off
What is an Instagram Ads dashboard?
Where standard platform reports show data in isolation, a well-built Instagram Ads dashboard connects spend to outcomes, surfaces cost efficiency trends, and flags performance anomalies across multiple dimensions at once. Coupler.io automates the data pipeline: it connects to your Meta Ads account, consolidates the data, and loads it into Looker Studio or Google Sheets on a scheduled refresh — so the numbers you see reflect your actual campaign state.

What reports should be included in Instagram Ads dashboards?
The most useful Instagram Ads dashboards don't try to show everything — they organize data into distinct reporting layers, each answering a different operational question. Below are the four reports that form the backbone of effective Instagram Ads reporting.
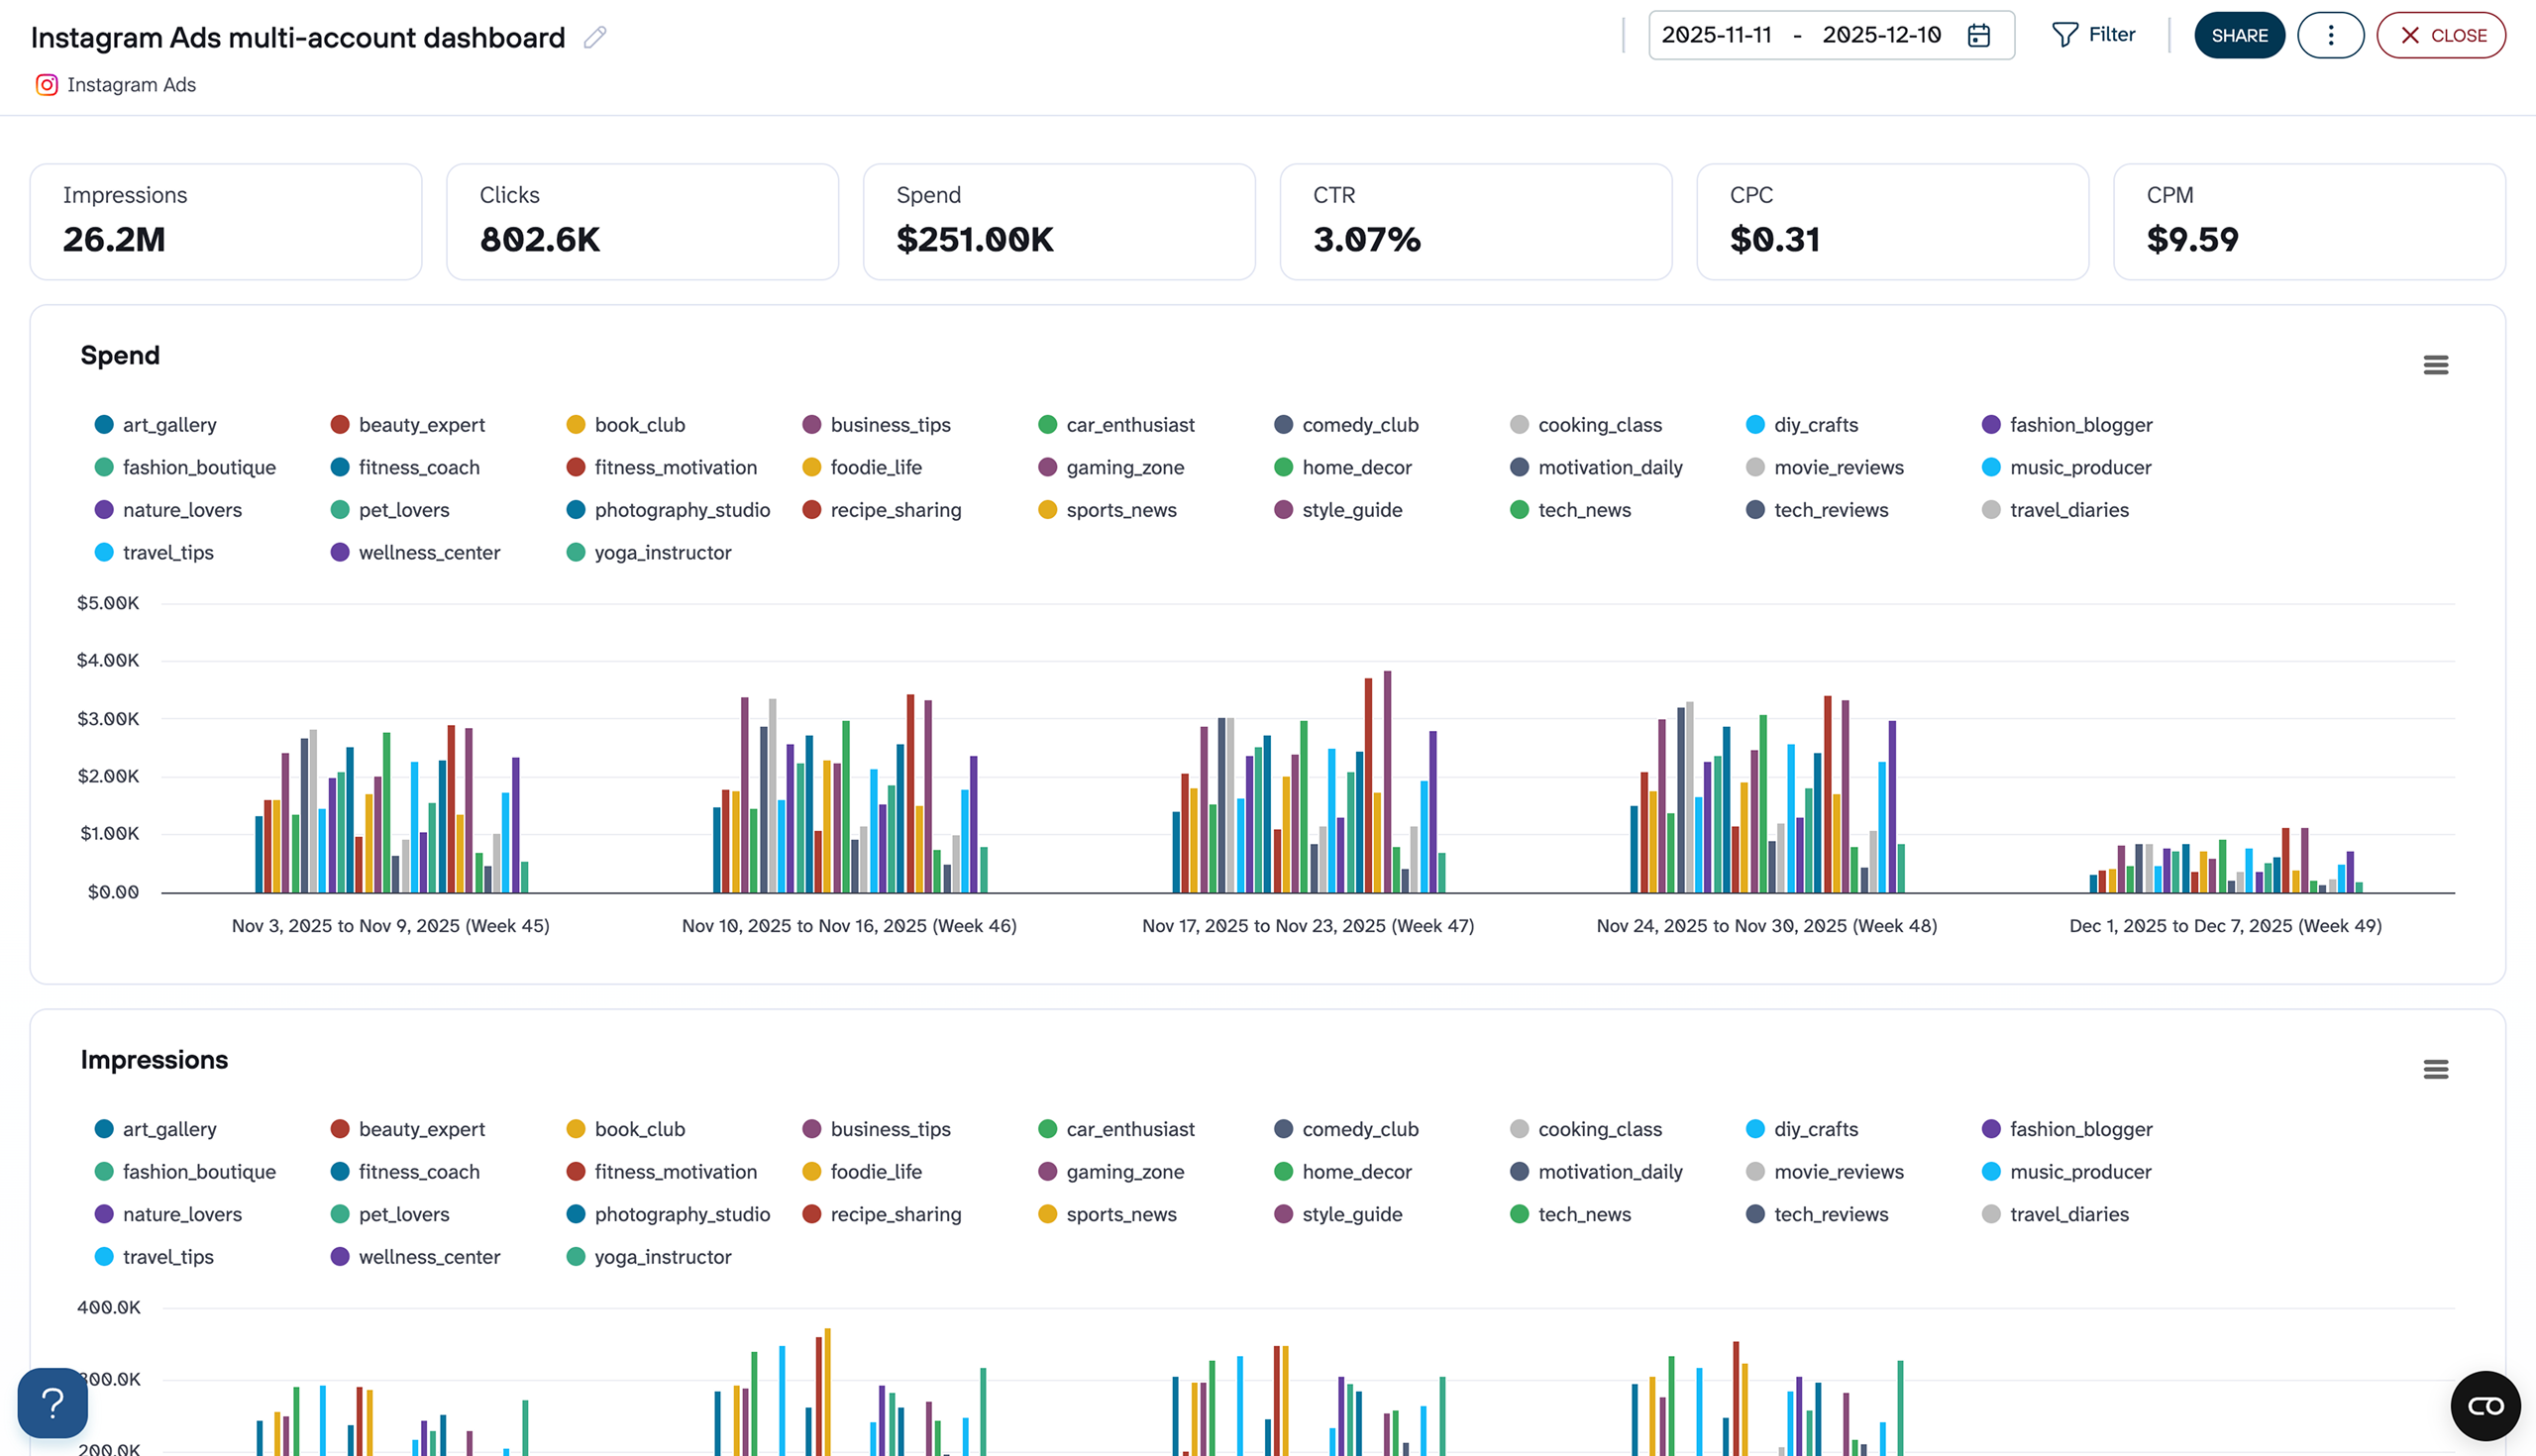
When you're running Instagram campaigns across multiple ad accounts, a single-account view creates blind spots. The multi-account performance report consolidates spend, impressions, clicks, CTR, CPC, and CPM across every connected account into one view, with weekly breakdowns by account. This makes it possible to compare pacing, identify which accounts are consuming disproportionate budget, and catch CTR drops in specific accounts before they affect overall cost efficiency.
Instagram ads run across a range of placements — Feed, Stories, Reels, Audience Network, and more — and each behaves differently in terms of cost and engagement. A placement performance report breaks down CPM, CPC, CTR, and engagement rate by placement, with weekly trend lines that show whether a placement's performance is holding steady or declining. Campaign-level cross-tables let you see if a placement that works well for one campaign is underperforming for another, enabling precise budget reallocation rather than blanket adjustments.
Budget efficiency depends heavily on which creatives are running. The ad creative performance report ranks each creative by engagements, CTR, CPM, CPC, conversions, and total spend in a single table, so you can identify which assets are pulling results and which are inflating costs. Paired with impressions/CPM and clicks/CPC trend charts, this report makes it straightforward to spot when a creative's performance is fading and a refresh is overdue.
Knowing who responds to your ads — and on what device — shapes both targeting and creative decisions. This report breaks down click distribution by age group and gender, shows which devices (mobile app, desktop, iPad, Android smartphone) drive the most engagement, and maps geographic performance across markets. A frequency meter tracks how often the same users are seeing your ads, which is a leading indicator of audience saturation before it shows up in rising CPC.
What insights you can get with a dashboard for Instagram Ads
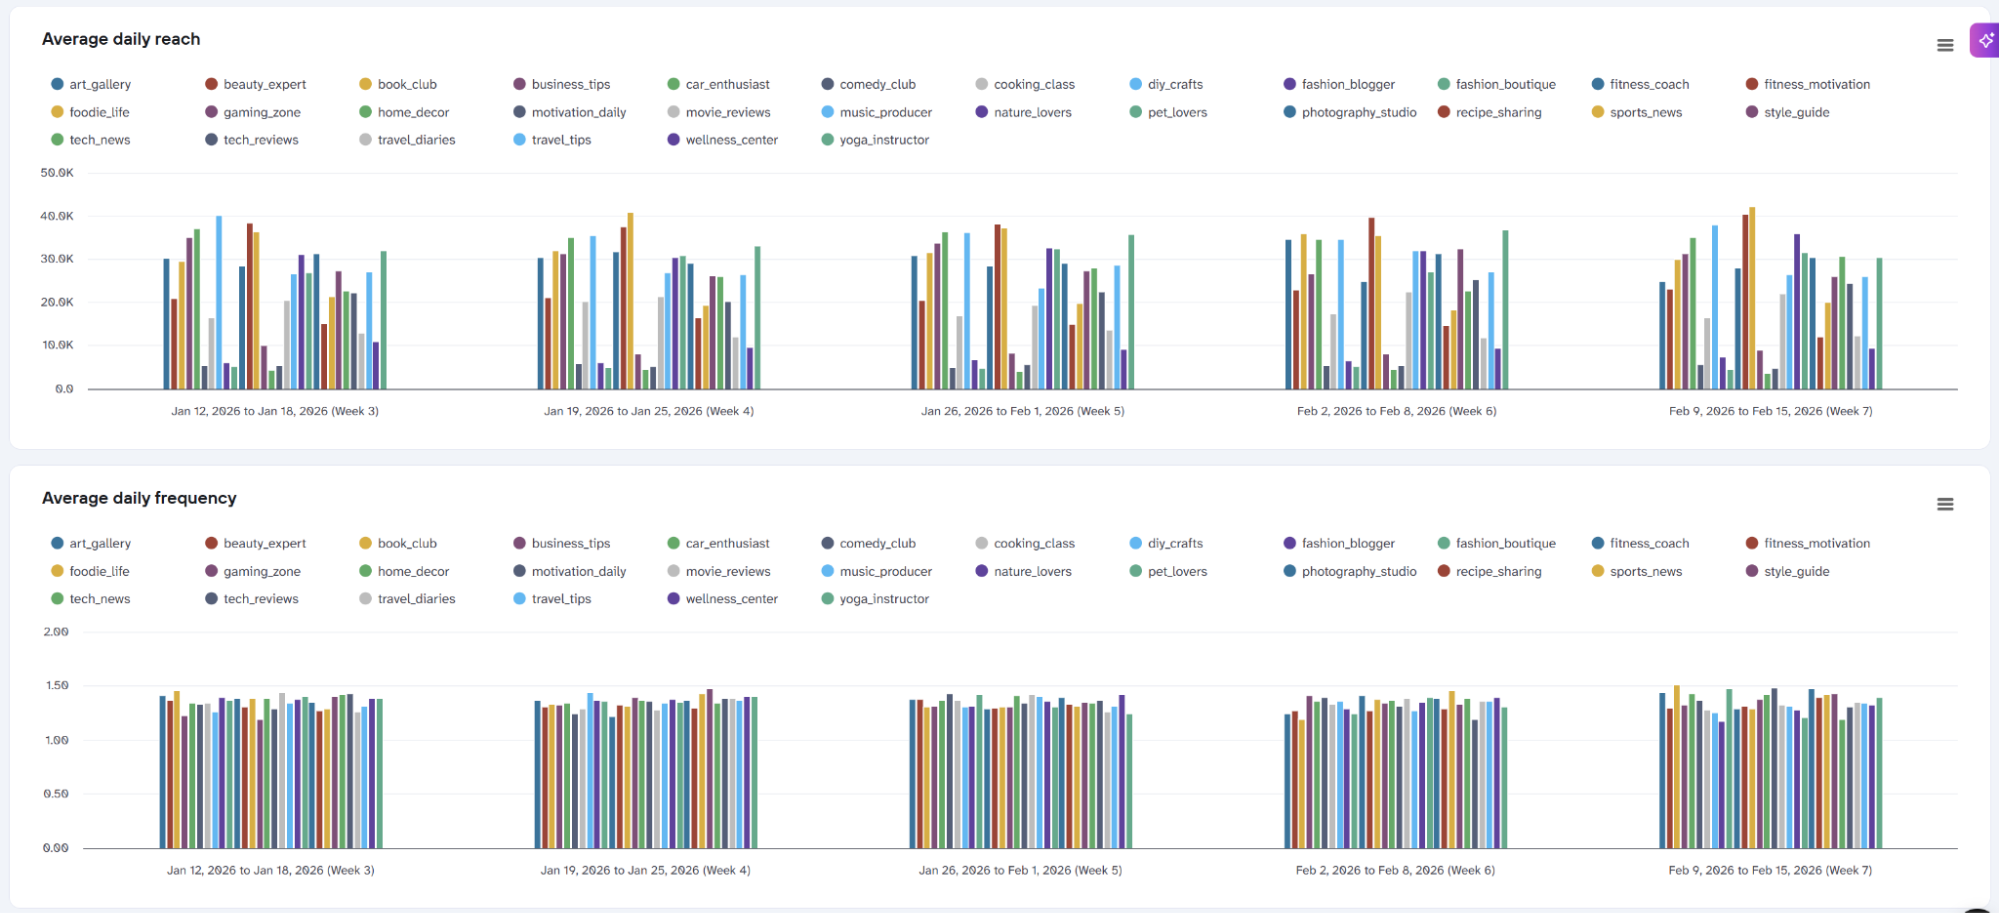
When frequency rises while CTR falls on the same account, you're paying to show ads to people who have already stopped responding. Catching this pattern before it ripples into rising CPC lets you reduce spend on saturated accounts. You can shift budget to those where the audience hasn't been overexposed yet, recovering clicks at the same overall monthly cost.
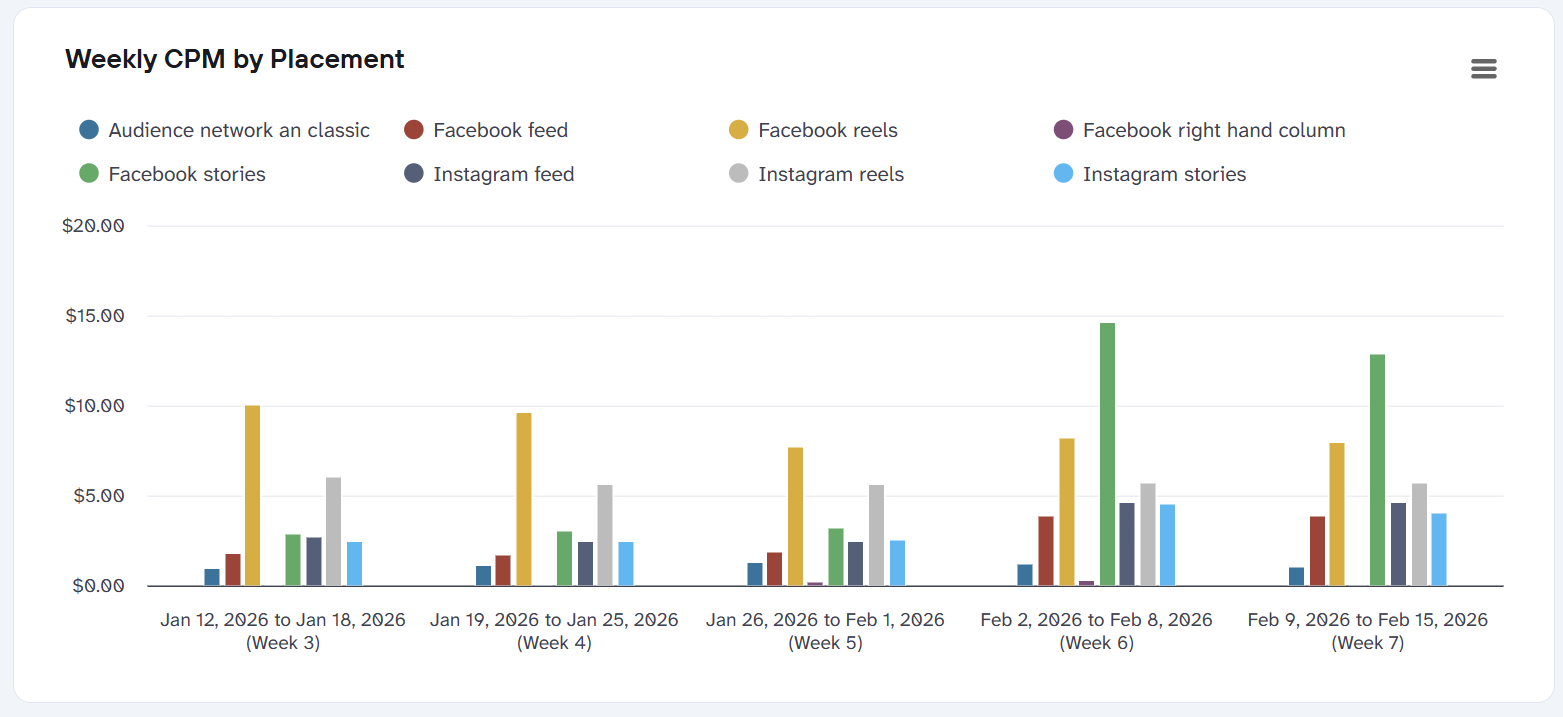
Placements that look similar in reach can differ significantly in what each click costs. If Stories are generating clicks at a third of the CPM of Feed, continuing to split budget evenly between them means overpaying for the same outcome. Identifying that gap by placement — and acting on it before the next billing cycle — is one of the fastest ways to improve overall campaign efficiency without changing targeting or creative.
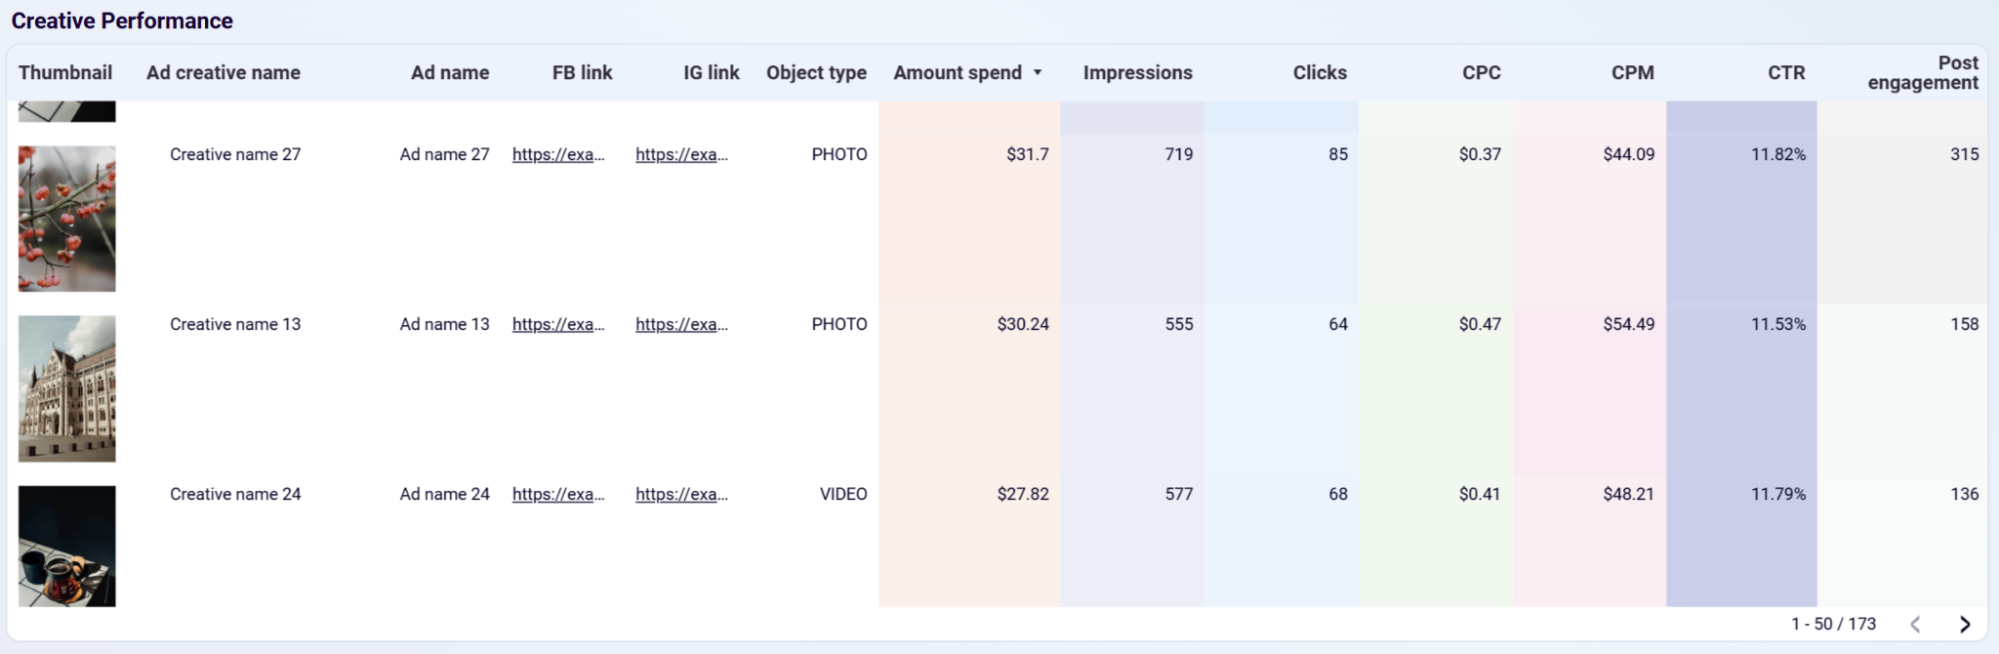
When multiple creatives run simultaneously, spend tends to distribute across all of them even when one or two are responsible for most of the results. Seeing which specific ads generate the highest CTR and engagements at the lowest CPM makes it clear where to concentrate budget — and which creatives to pause or replace before they pull the account's average cost efficiency down.
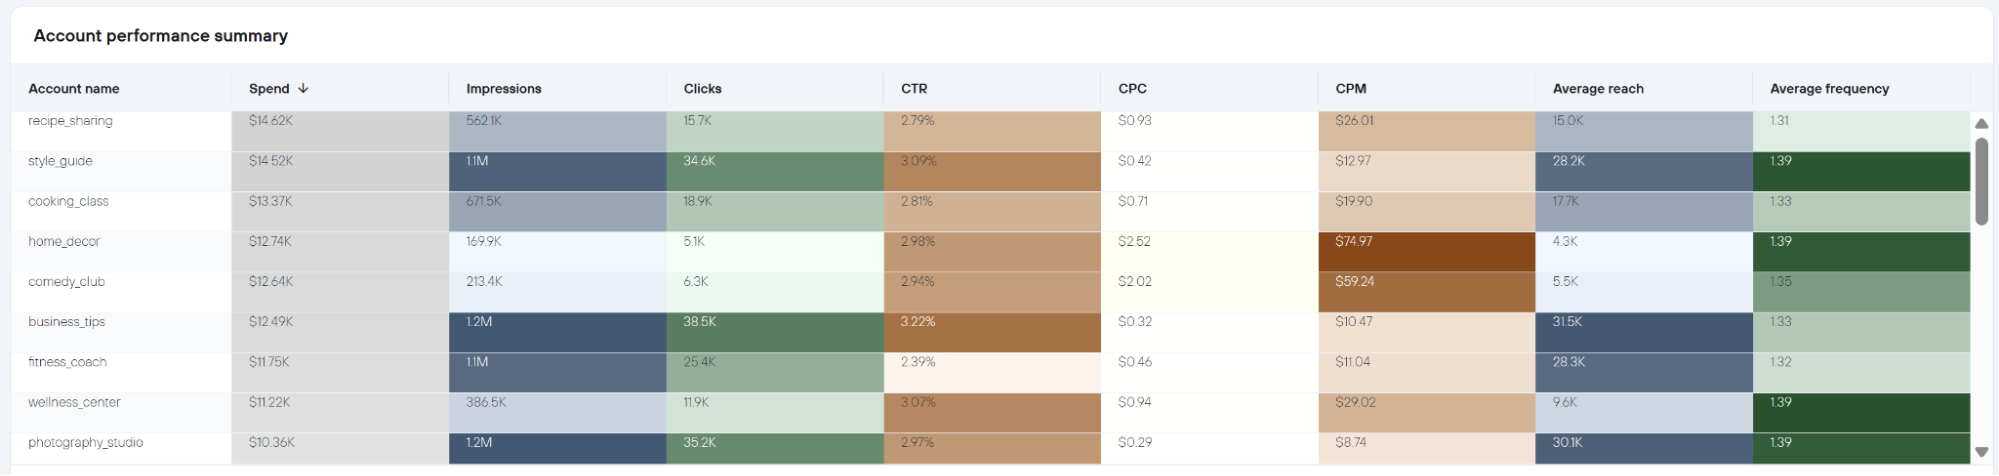
When every account's spend, CTR, CPC, CPM, reach, and frequency sit in the same table, outliers become hard to miss. An account running the same budget as others but returning double the CPC or half the CTR is immediately visible when sorted by column. This gives you a clear starting point for investigation rather than a hunch to chase across separate reports.
How to create an Instagram Ads dashboard?

Metrics you can track with an Instagram Ads dashboard template
The total number of times your ads were displayed across all connected accounts and placements in the selected period. Impressions measure campaign delivery volume and serve as the baseline against which all cost and engagement efficiency metrics are calculated.
Total advertising spend recorded across all accounts or placements for the selected date range. Spend is the anchor metric for budget pacing reviews — tracking it weekly by account or placement reveals whether budget is being consumed evenly or front-loaded in ways that leave campaigns under-funded at month-end.
Clicks divided by impressions, expressed as a percentage. CTR measures how effectively ad creative and targeting prompt action from the audience being reached. Declining CTR in a specific account or placement — without a drop in impressions — is a reliable early signal of creative fatigue or audience-ad misalignment.
Total spend divided by total clicks. CPC tracks the average cost of each user interaction with an ad. Rising CPC alongside stable CTR points to increasing auction competition rather than a creative quality issue, which calls for a different optimization response than falling CTR would.
Spend divided by impressions, multiplied by 1,000. CPM measures how efficiently your budget is buying audience reach. Comparing CPM across placements — for example, Instagram Stories versus Facebook Feed — directly informs which formats are the most cost-effective for building reach at scale.
The number of unique users who saw your ads at least once in the selected period. Reach differs from impressions in that it counts individuals rather than total ad exposures. Monitoring reach alongside frequency identifies when campaigns are cycling through the same audience repeatedly rather than expanding to new users.
The average number of times each unique user in your reached audience saw your ads. Frequency above 2.0 combined with declining CTR is a consistent indicator of audience saturation — the point at which continued spend on the same audience produces diminishing returns and rising costs.
The total number of interactions users had with your ads, including reactions, comments, and shares. Engagement rate — engagements relative to impressions — reveals which placements and creatives generate genuine audience interaction beyond clicks, and is particularly useful for comparing Reels performance against static Feed placements.
Clicks that took users away from Meta's platform to an external destination, such as a landing page or product page. Outbound clicks are a more precise conversion signal than total clicks, which can include interactions that keep users within Meta's ecosystem without driving traffic to your owned properties.
The number of times your video ads were watched to completion or for at least 15 seconds. Thruplay rate — thruplays divided by impressions — measures how effectively video creative holds audience attention across different placements and devices, and helps identify whether Stories or Feed placements retain viewers longer through the completion funnel.