Export Toggl to Looker Studio
Create stunning visual narratives from time tracking data with the Toggl to Looker Studio integration by Coupler.io. Build engaging interactive dashboards, compelling project reports, and beautiful data stories that make productivity insights immediately understandable for any audience.
What data you can export from Toggl
-
Time entriesTime tracking records optimized for visualization showing work patterns, project allocation, and productivity trends through interactive Looker Studio charts and compelling visual storytelling.
-
OrganizationsOrganizational structure data formatted for visual analysis enabling interactive organizational performance dashboards and compelling multi-entity comparison visualizations.
-
Organizations usersUser profile information structured for visual representation supporting interactive user performance dashboards and engaging team productivity visualization across organizational contexts.
-
Organizations groupsTeam and group data organized for visual analysis enabling interactive departmental performance dashboards and compelling group comparison visualizations within organizational frameworks.
-
WorkspacesWorkspace information formatted for visual representation supporting interactive workspace performance dashboards and engaging productivity visualization across different project environments.
-
Workspace clientsClient data structured for visualization enabling interactive client performance dashboards and compelling client relationship analysis through engaging visual representations.
-
Workspace projectsProject data organized for visual storytelling supporting interactive project performance dashboards and compelling project analysis through dynamic Looker Studio visualizations.
-
Workspace tasksTask information formatted for visual analysis enabling interactive task performance dashboards and engaging task completion visualization within comprehensive project contexts.
All-in-one tool for Toggl data exports and analytics
Import time tracking records from Toggl and blend with project budgets, financial reports, and operational metrics to create rich datasets that power compelling Looker Studio visualizations and engaging data storytelling experiences.
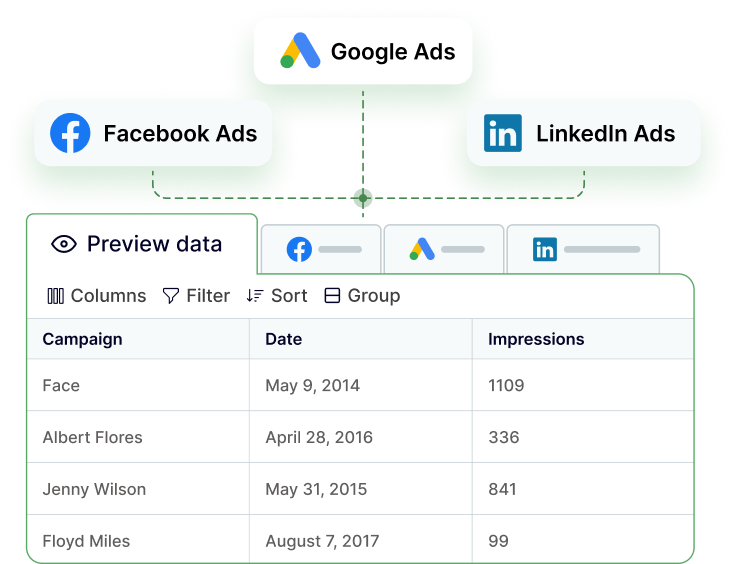
Format time entries and project metrics for maximum visualization impact in Looker Studio, with carefully structured dimensions and measures that enable smooth interactive filtering, dynamic drilling, and responsive dashboard performance.
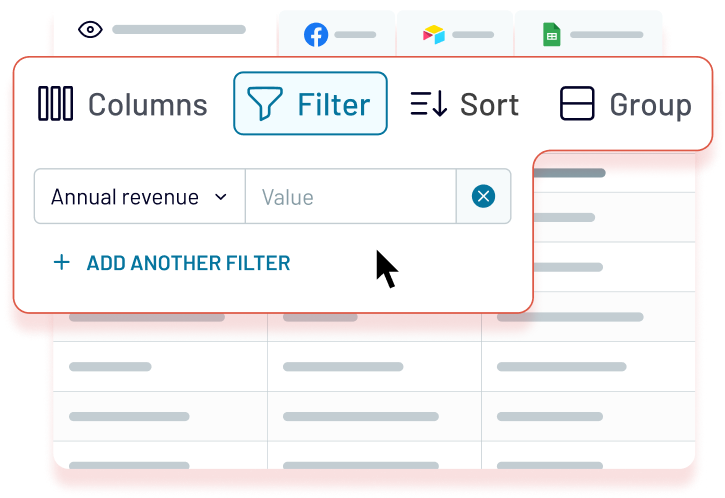
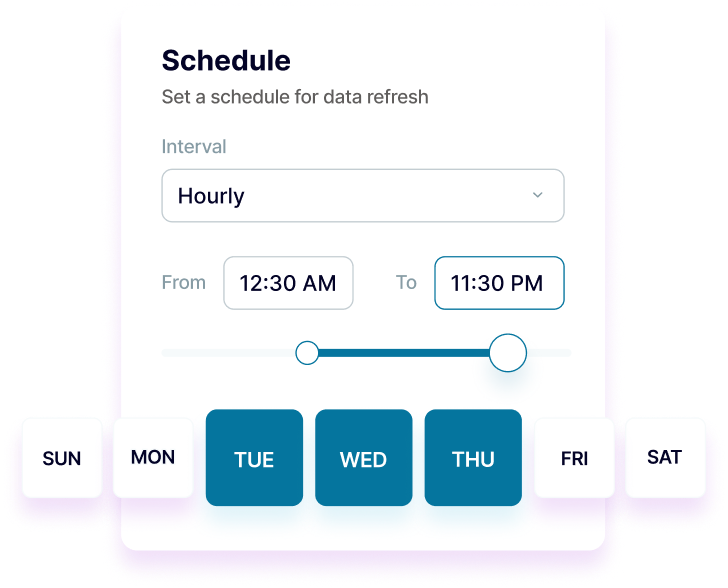
Keep Looker Studio reports fresh with scheduled data updates from monthly to 15-minute frequencies. Ensure stakeholders always have access to the latest time tracking performance through automatically updated visualizations.
Enhance your time tracking insights with Coupler.io AI integrations, enabling natural language exploration of productivity patterns and project performance for deeper analytical understanding.


Why export Toggl to Looker Studio - real life cases
Interactive executive time tracking dashboards
Client reporting and project transparency
Team performance and productivity visualization
Project profitability and resource optimization
How to export Toggl to Looker Studio
Automate data exports with the no-code Toggl Looker Studio integration
Connect similar Time Tracking apps and get data in minutes
Quick start with dashboard templates
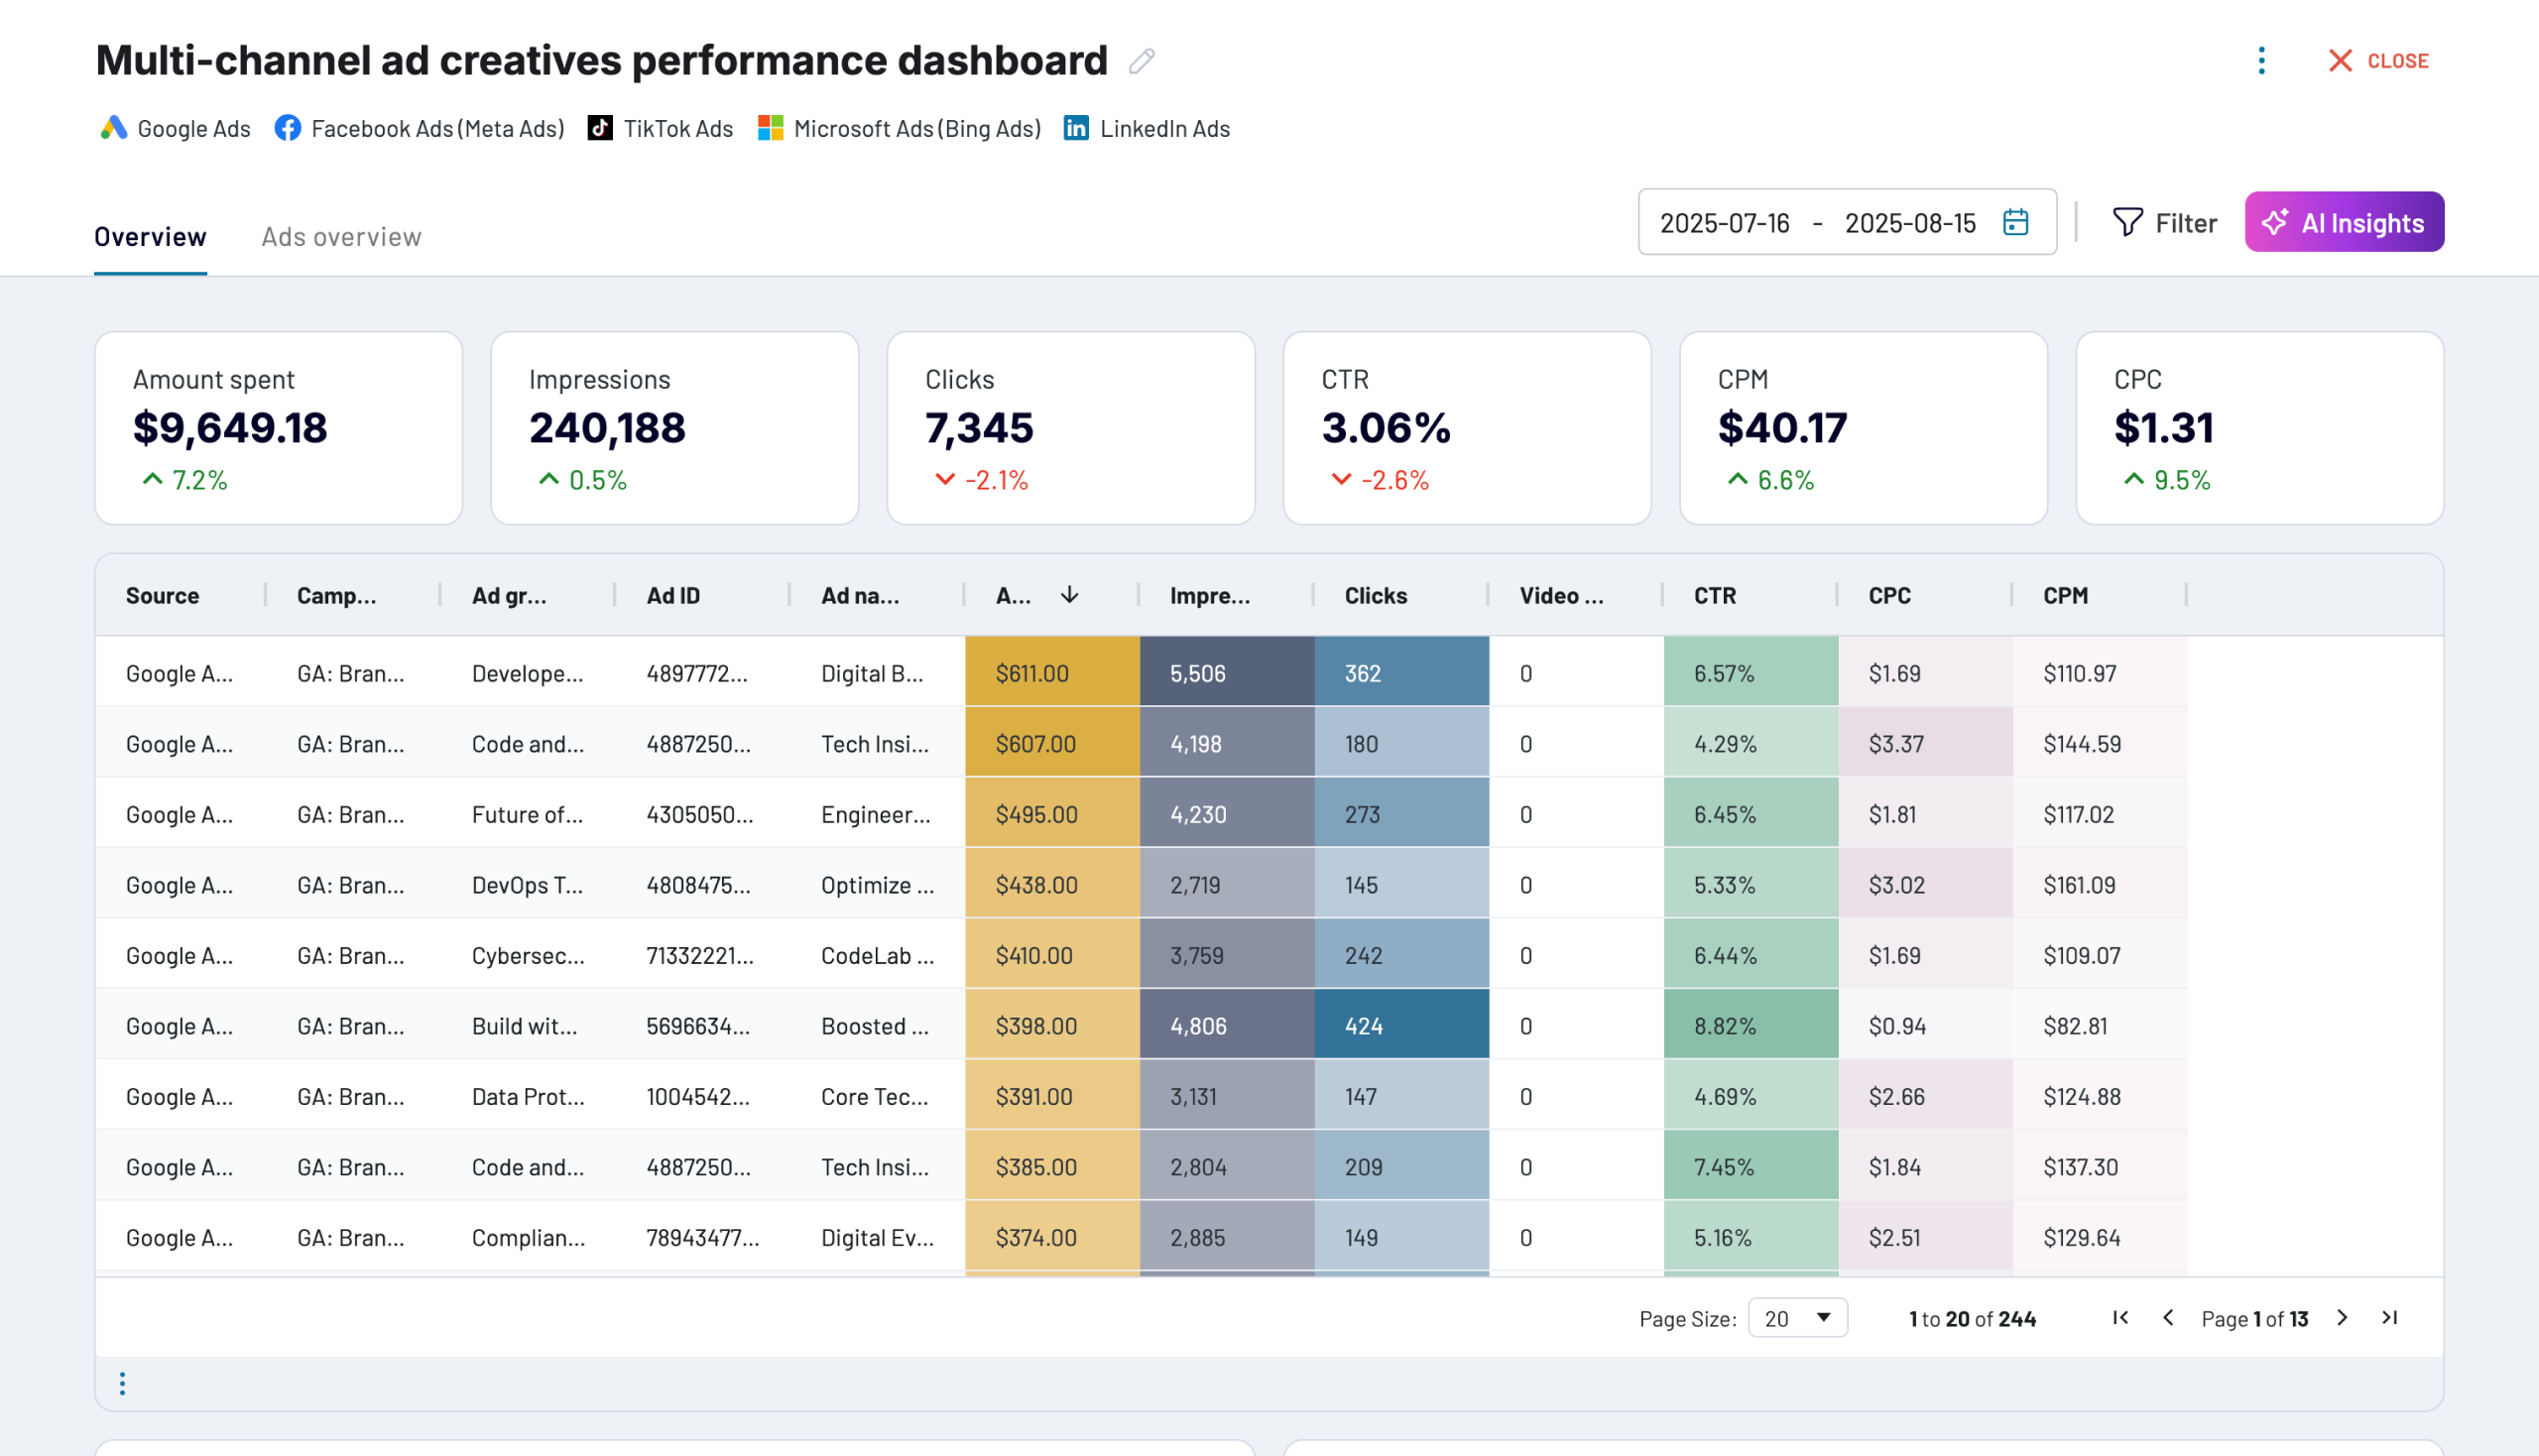


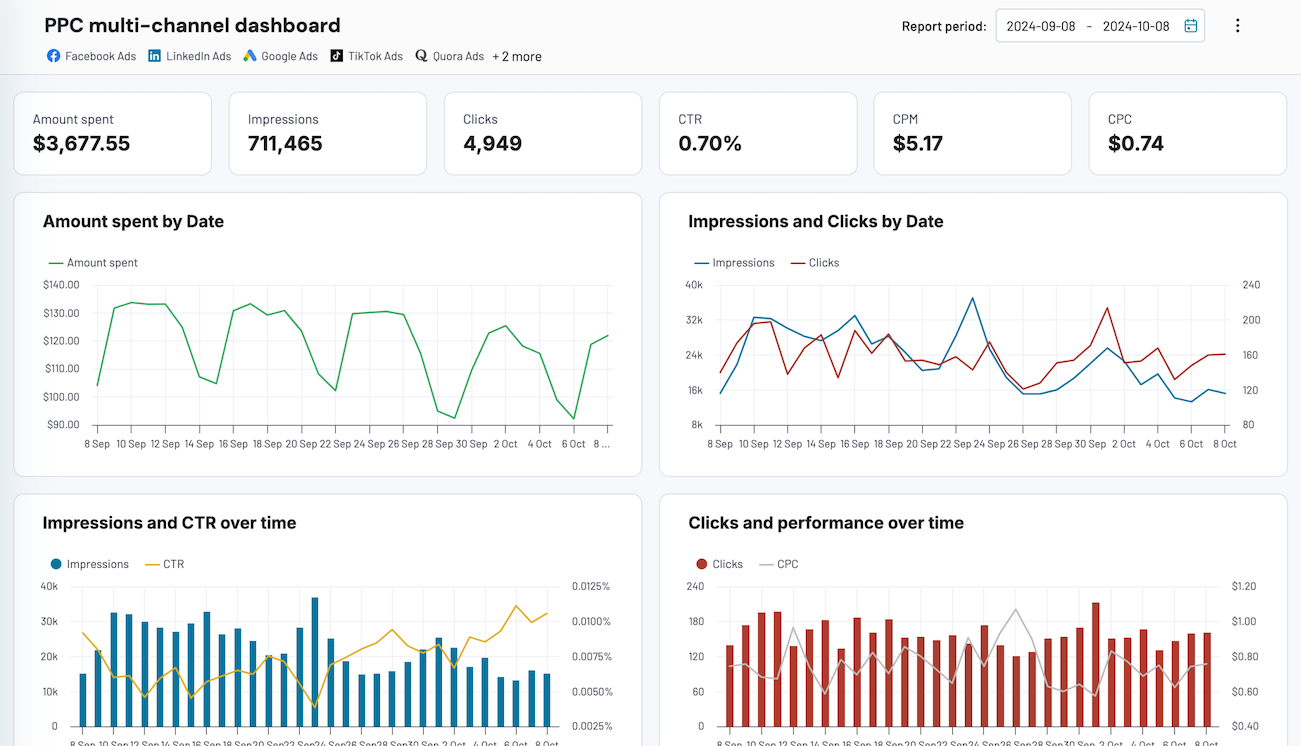


 +3
+3


 +6
+6

about your case. It doesn't cost you a penny 😉
Talk to AI about your Toggl data
Examples of questions you can ask about Toggl data:
- "Create visualizations showing seasonal patterns in our team productivity and project allocation"
- "What are the key metrics I should include in this month's executive time tracking dashboard?"
- "Identify the most effective visual formats for presenting project profitability to stakeholders"
- "Which time allocation patterns contribute most to project success and how should I visualize this?"


Keep your data safe
Coupler.io safeguards your shared information and data transfers from breaches, leaks, and unauthorized disclosures.
