SEO monitoring dashboard examples and reporting templates
Monitor your website's organic search performance with automated SEO monitoring dashboards that transform Google Search Console data into actionable insights. Track click patterns, evaluate ranking positions, analyze device-specific traffic, and identify growth opportunities across global markets with real-time visibility into your search performance.
SEO monitoring dashboard examples for every need


about your case. It doesn't cost you a penny 😉
Choose your white label SEO monitoring dashboard template to kick off
What is an SEO monitoring dashboard?
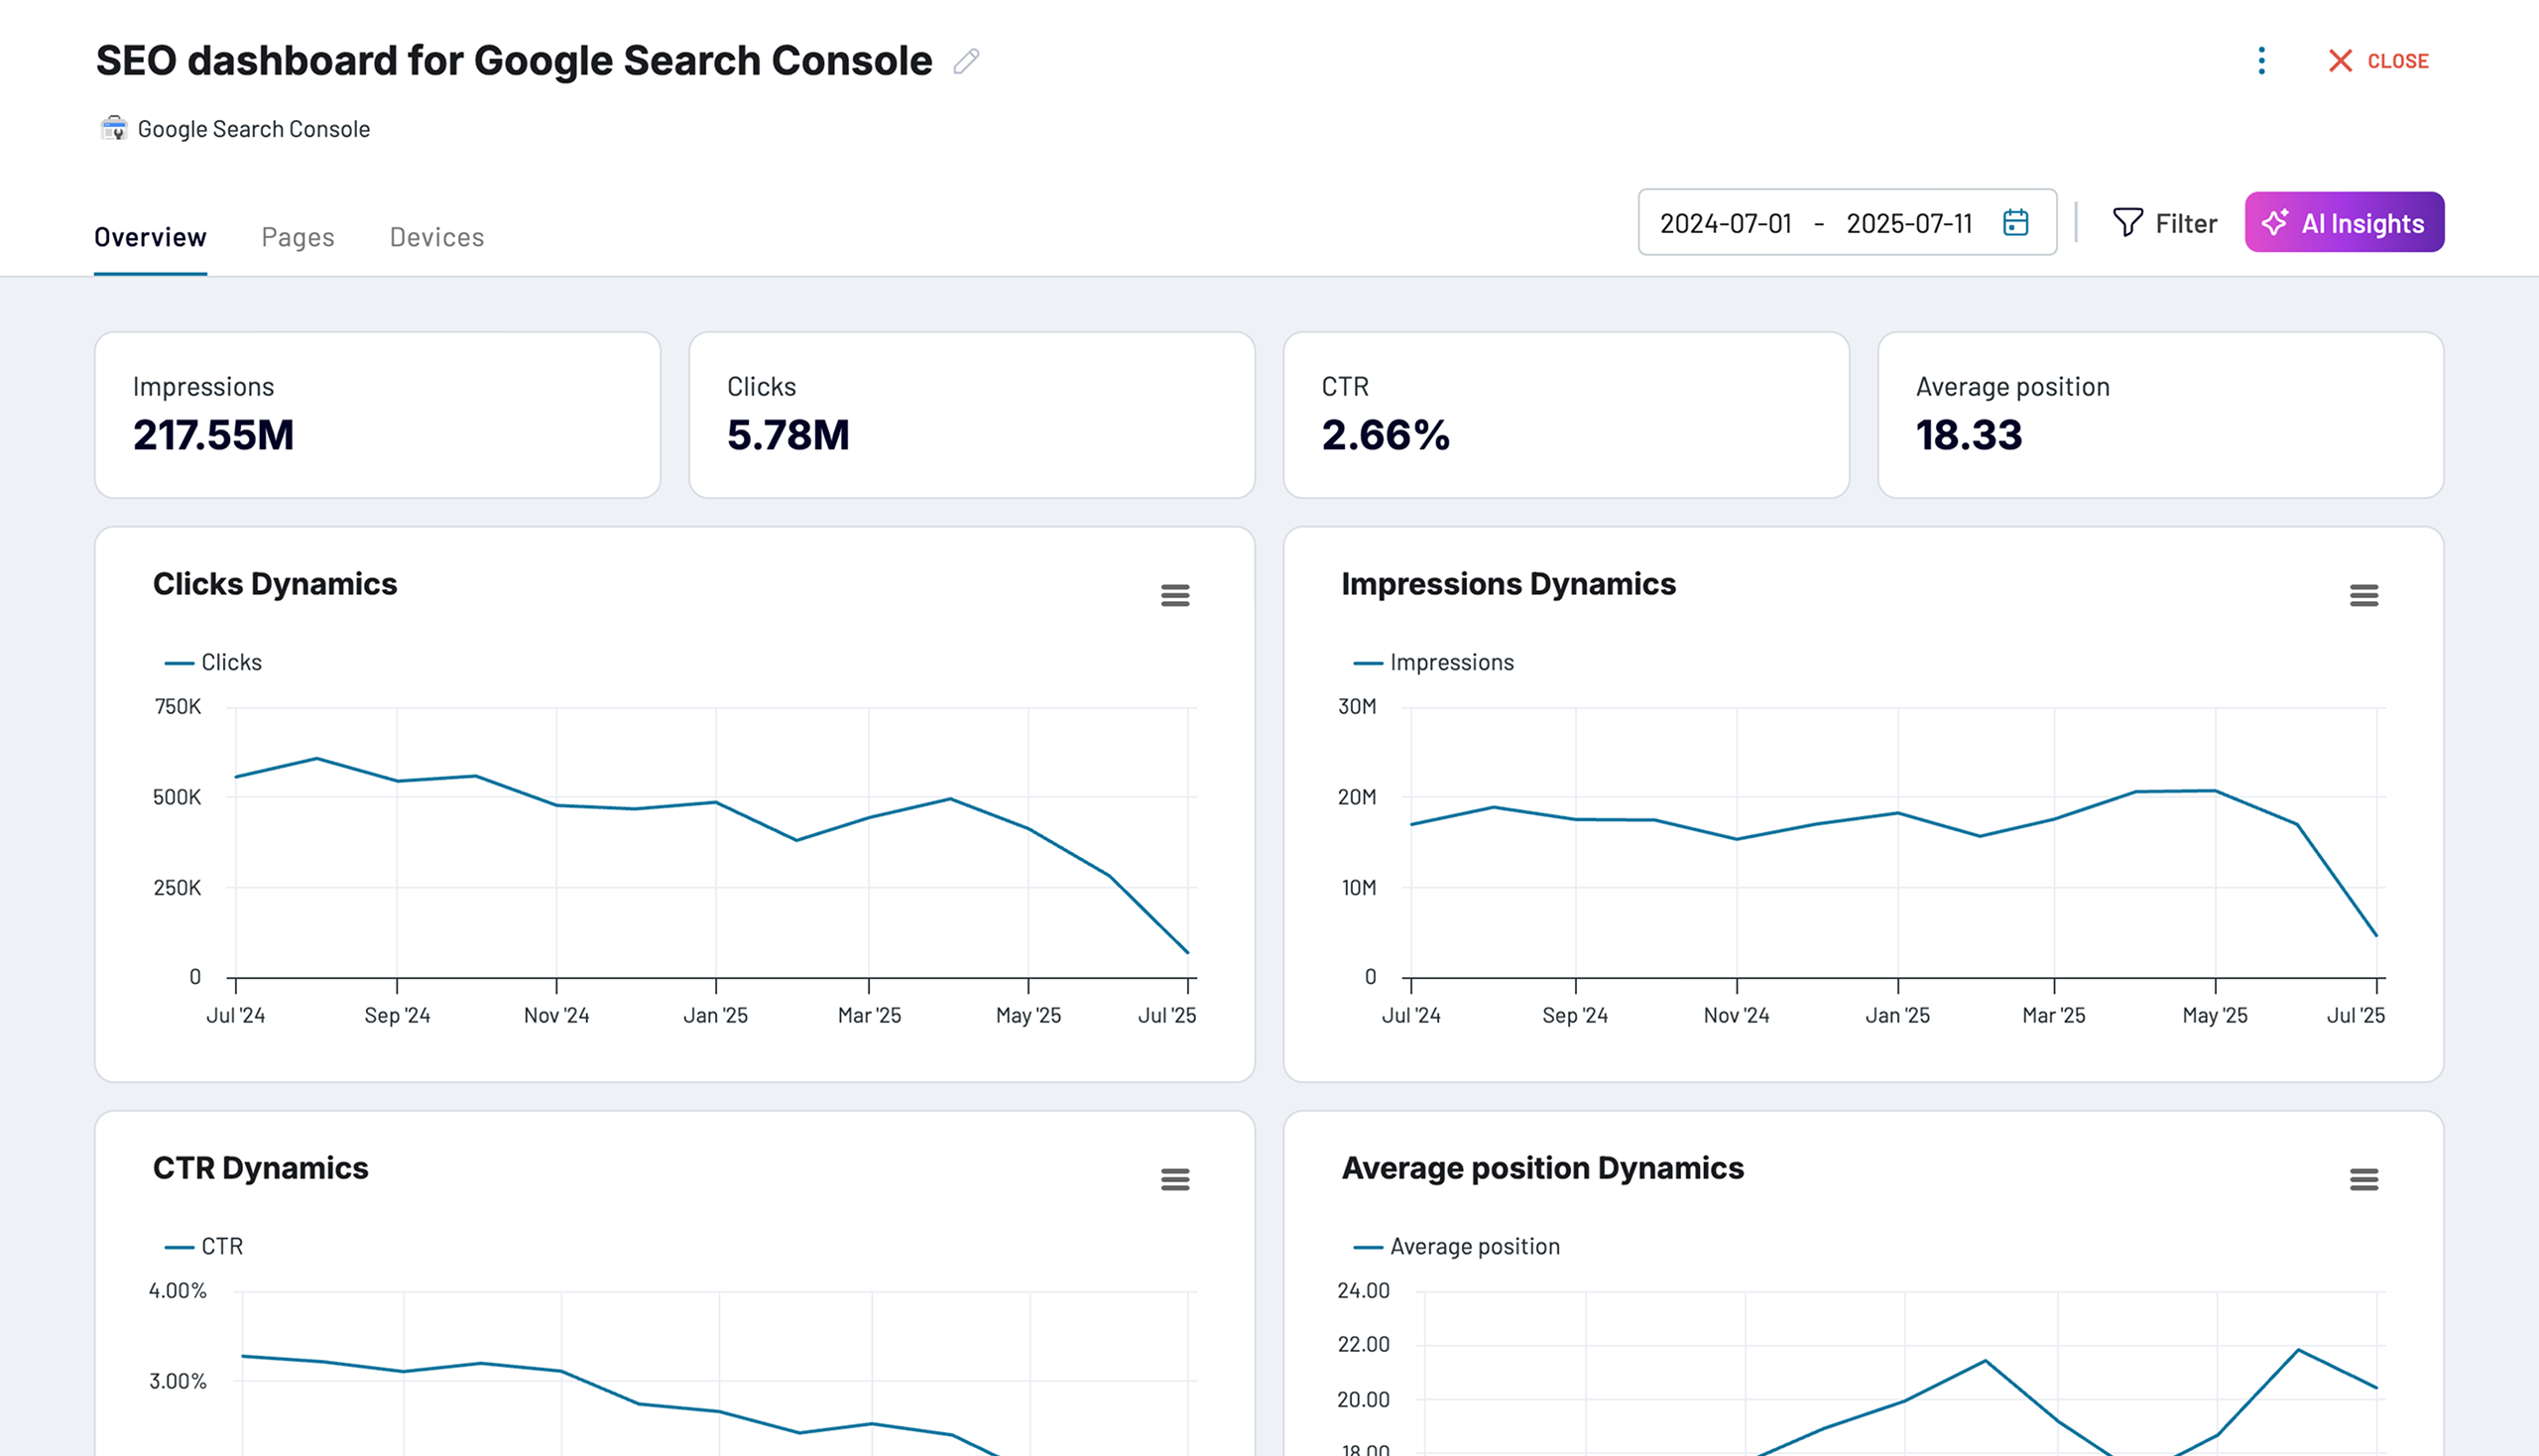
With automated data refreshing through Coupler.io, our SEO monitoring dashboard templates ensure you're always working with up-to-date search performance information without manual data extraction. It consolidates global traffic patterns, device-specific performance, and page-level metrics into a single source of truth for your organic search position.

What reports should be included in SEO monitoring dashboards?
Building an SEO monitoring dashboard requires selecting reports that transform raw search data into strategic advantages. Through our analysis of Google Search Console implementations, four report categories consistently deliver the insights needed to improve rankings, capture more traffic, and expand into new markets:
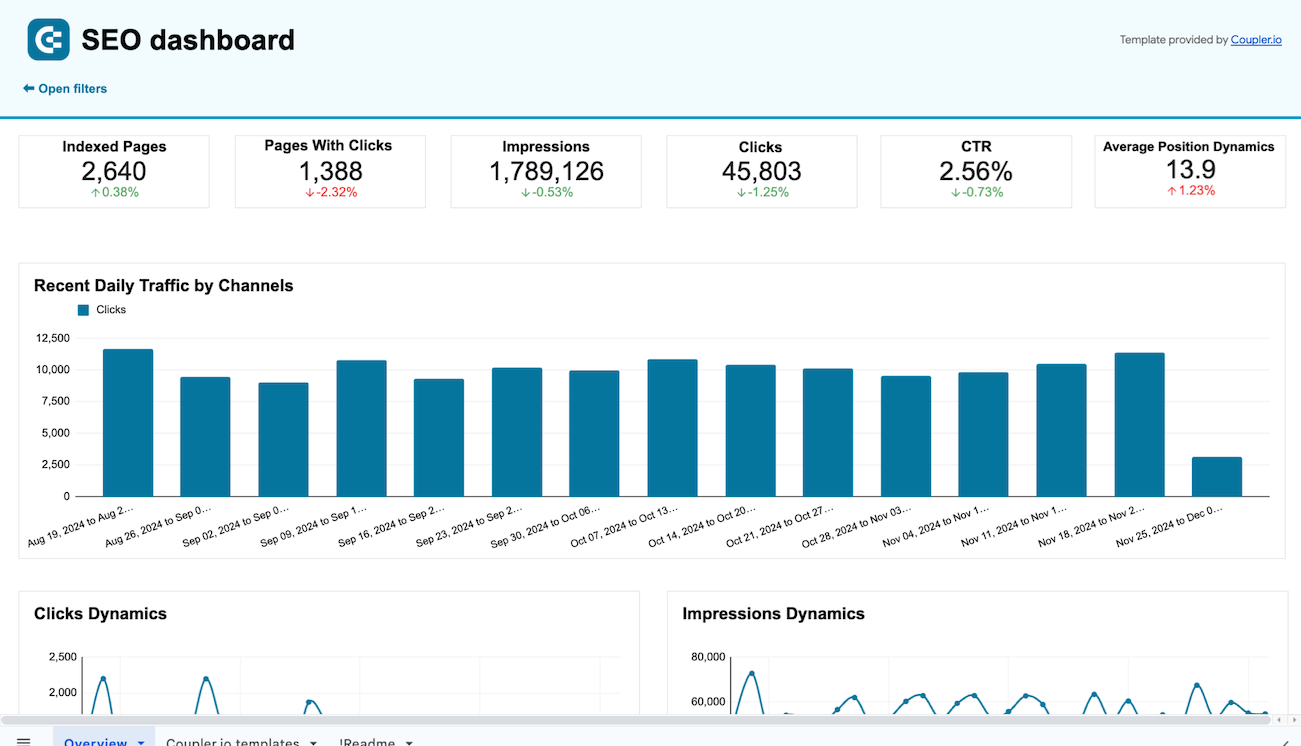
The organic traffic performance report tracks click dynamics across weekly and long-term periods, revealing how your search visibility translates into actual website visits. This report includes weekly traffic comparisons that highlight the immediate impact of SEO updates or seasonal changes, alongside extended trend analysis showing growth patterns over multiple months.
The page-level performance report identifies which specific URLs contribute most to your organic traffic and which pages underperform. It includes comparative tables showing best and worst performers based on month-over-month click changes, allowing you to spot pages gaining momentum or losing traction quickly.
The device and platform report breaks down organic search performance across desktop, mobile, and tablet platforms. It compares how clicks and impressions vary between devices, helping you identify where engagement is strongest or weakest. The report includes device-specific CTR analysis to determine which platform converts impressions to clicks most effectively.
The international SEO performance report reveals the geographic distribution of your organic search traffic across countries and regions. It tracks traffic dynamics for your top-performing countries, showing which markets are growing or declining over specific periods. The report includes comparative tables highlighting best and worst-performing countries based on recent click changes, enabling quick identification of emerging opportunities or declining markets.
What insights you can get with an SEO performance monitoring dashboard
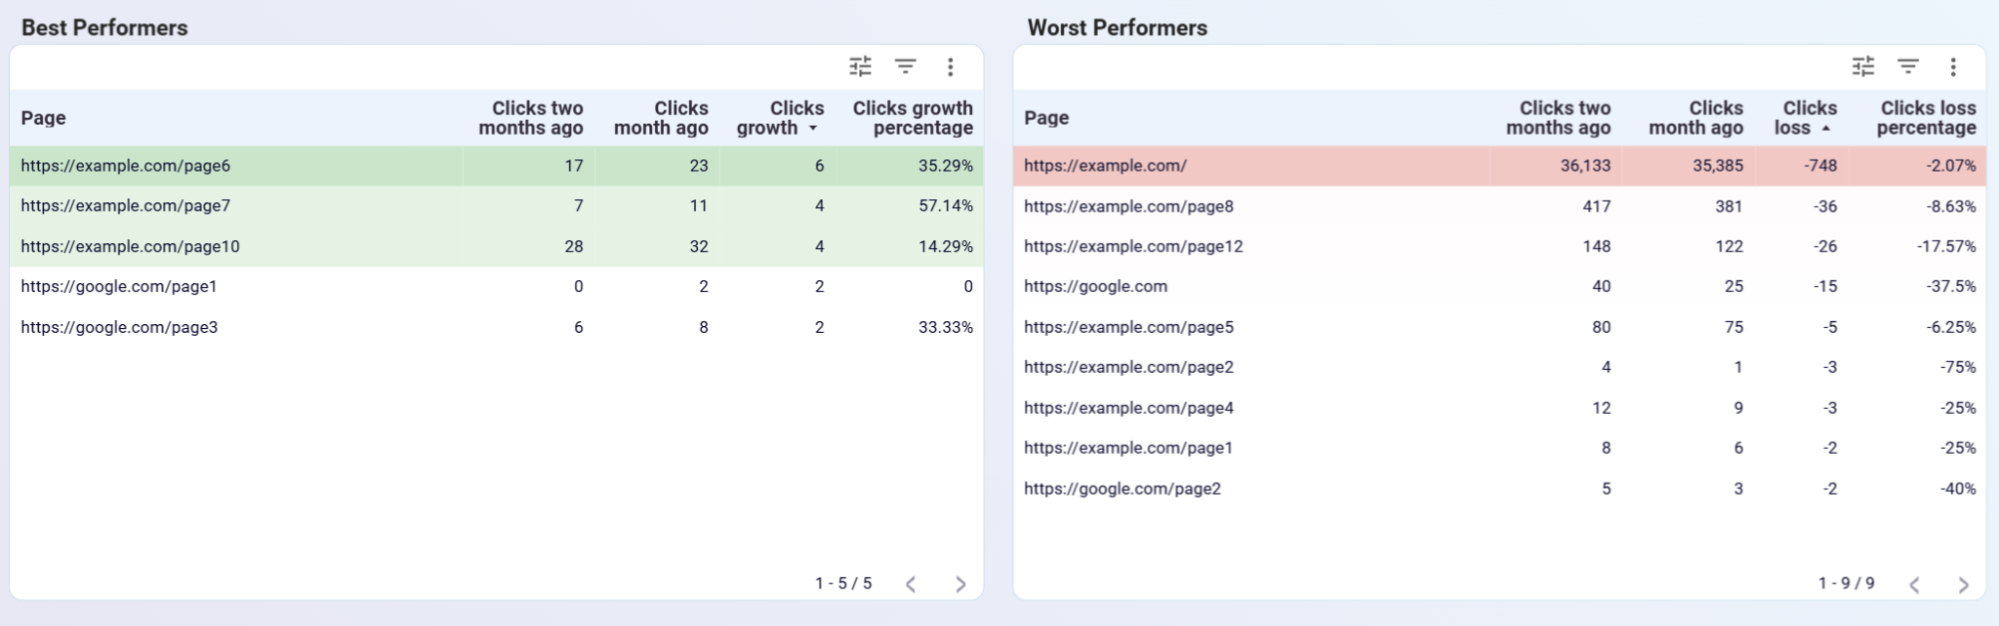
Discover exactly where your traffic gains and losses occur through month-over-month page comparisons. Two tables in the SEO dashboard compare clicks for each page from the last full month against the previous month. The best performers table displays pages that gained traffic, while the worst performers table identifies pages that lost visitors. This allows you to quickly spot declining performance and take immediate action—whether checking technical status, reviewing content quality, or analyzing competitive changes. Finding this information in the native Search Console interface would require applying multiple complex filters repeatedly.
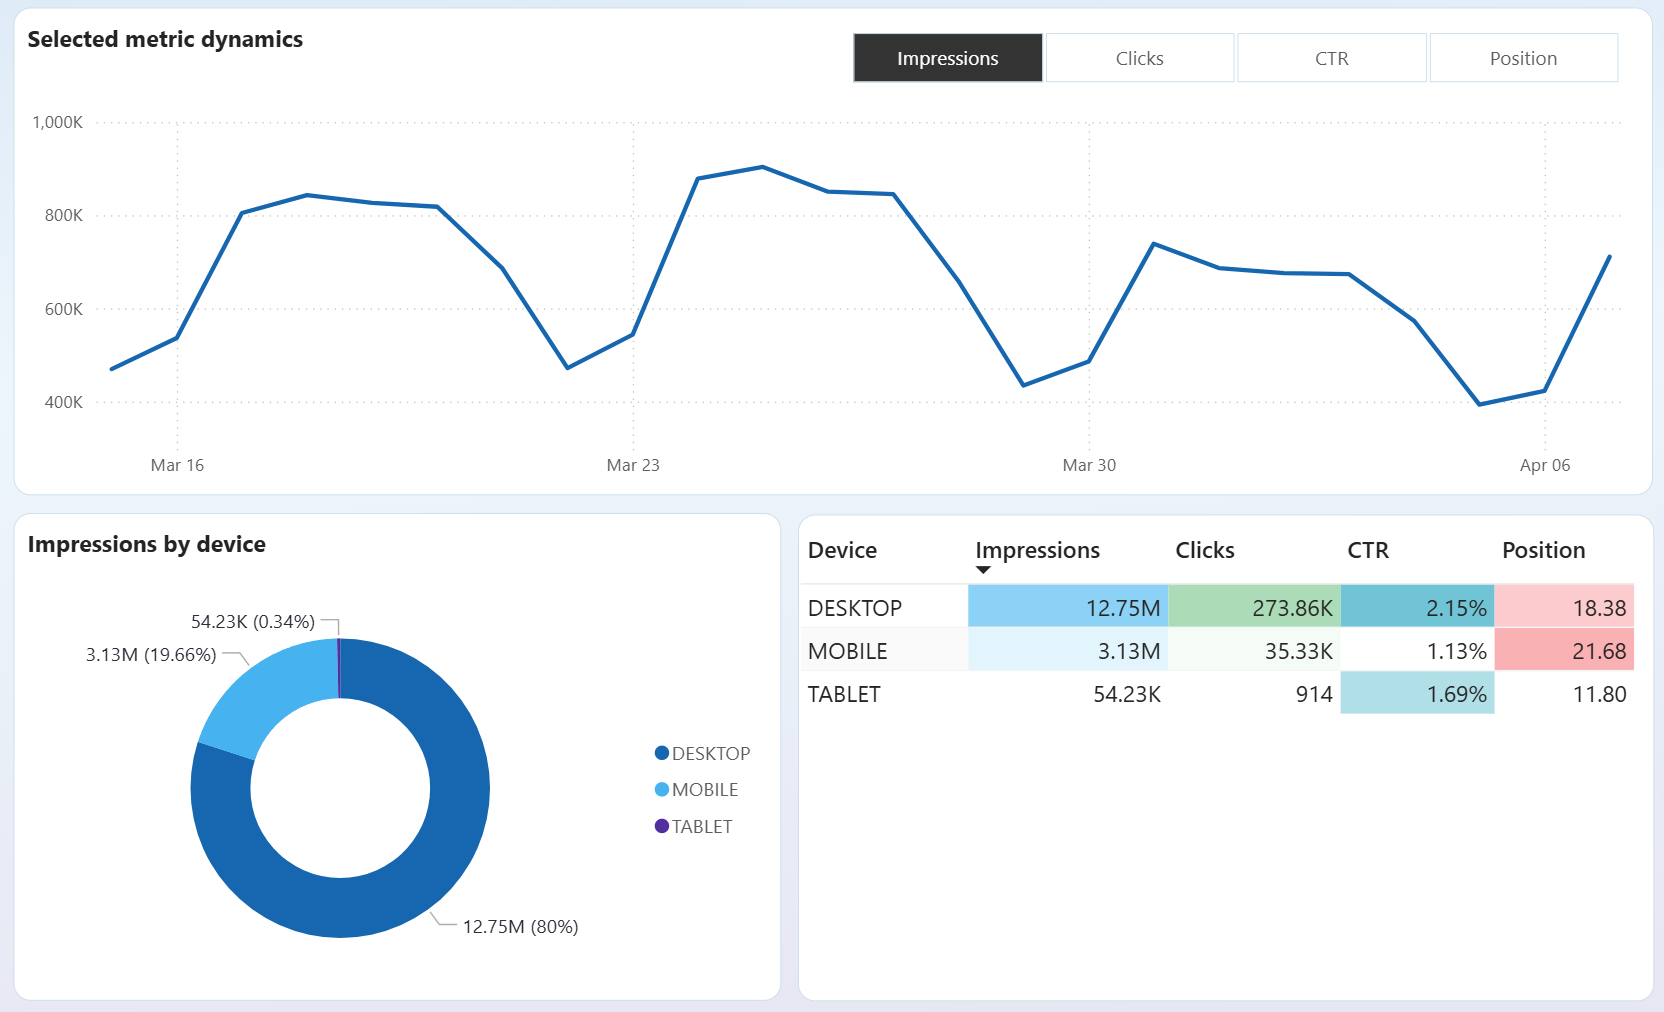
Uncover platform-specific performance gaps that limit your traffic potential. The device performance analysis compares clicks and impressions between platforms to identify optimization opportunities. This insight reveals which devices drive the strongest engagement and where user experience improvements are needed. By evaluating CTR differences across devices, you can determine which platforms convert search impressions most effectively and prioritize optimization efforts accordingly. This visibility ensures your site delivers consistent performance regardless of how visitors discover your content.
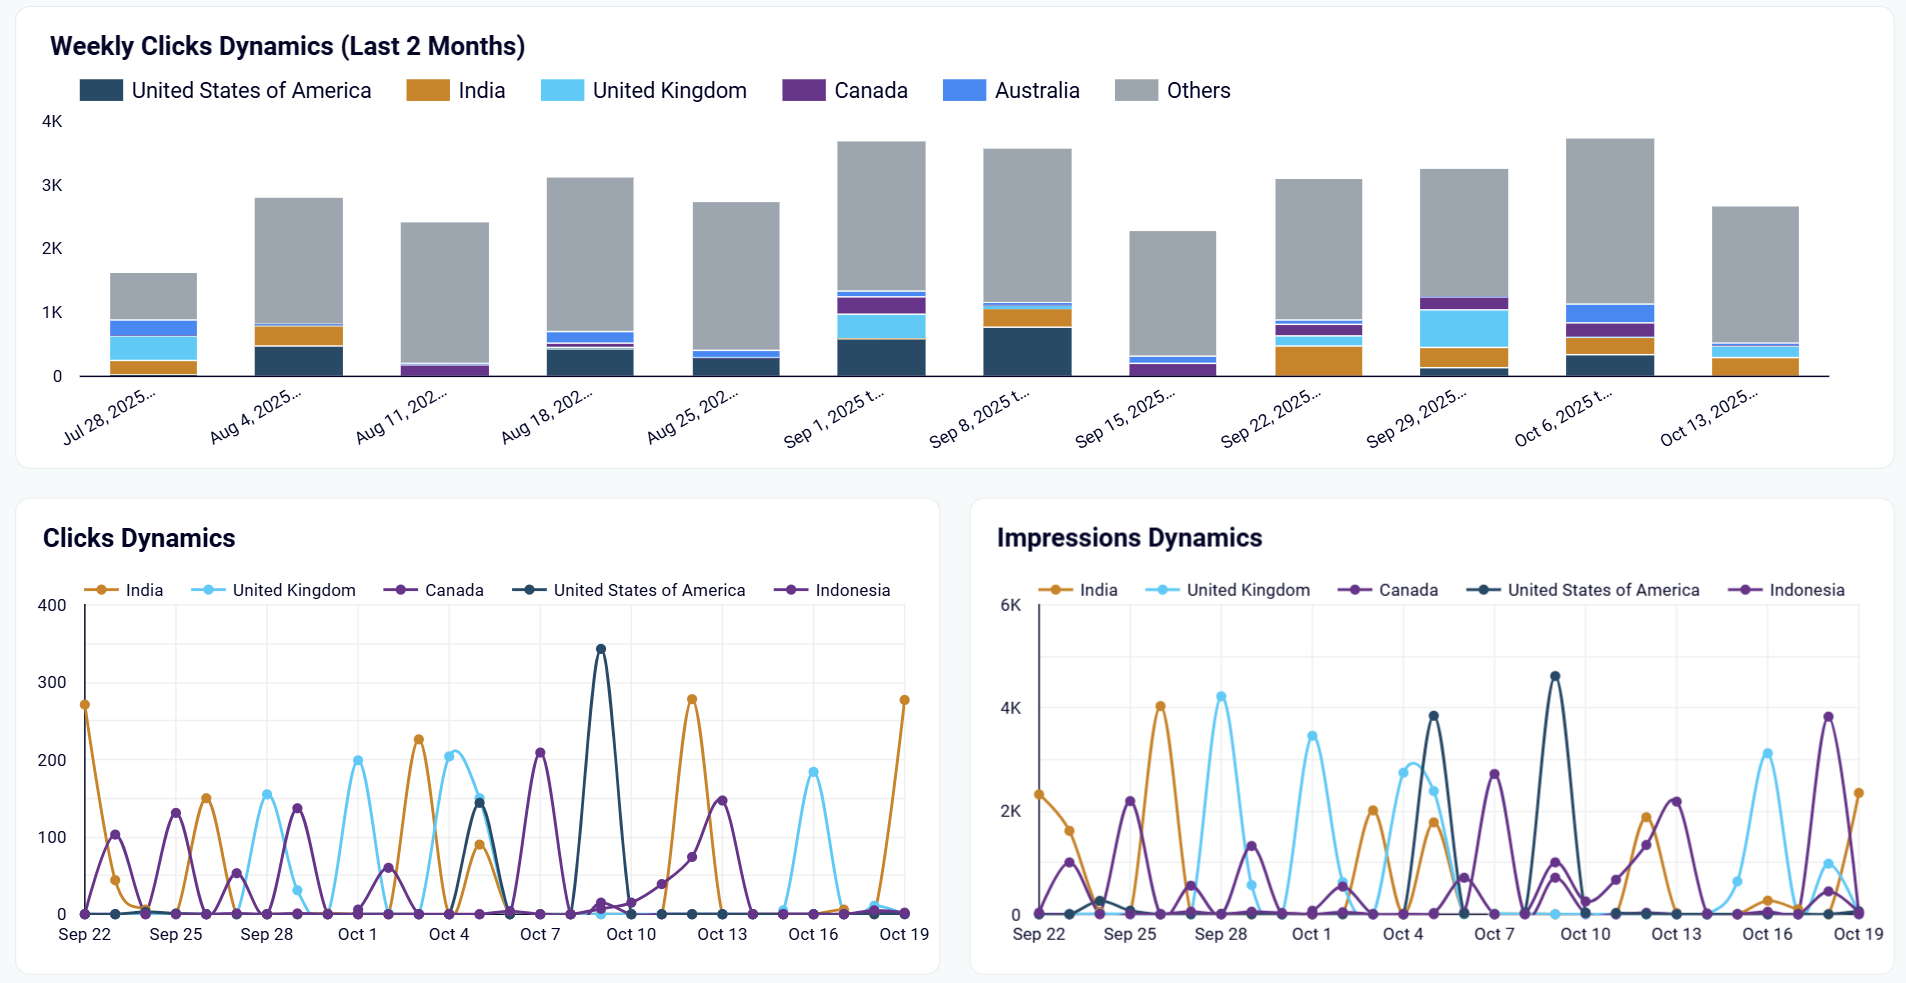
Recognize which countries show momentum in your organic search visibility. The international performance view monitors traffic patterns for the top 5 countries by clicks over the last two months, revealing regional trends that inform localization strategies. For businesses launching region-specific content or localized site versions, this insight shows whether those efforts translate into increased traffic from target countries. The geographic breakdown helps you understand which markets respond best to your content and where additional optimization investment could yield strong returns.
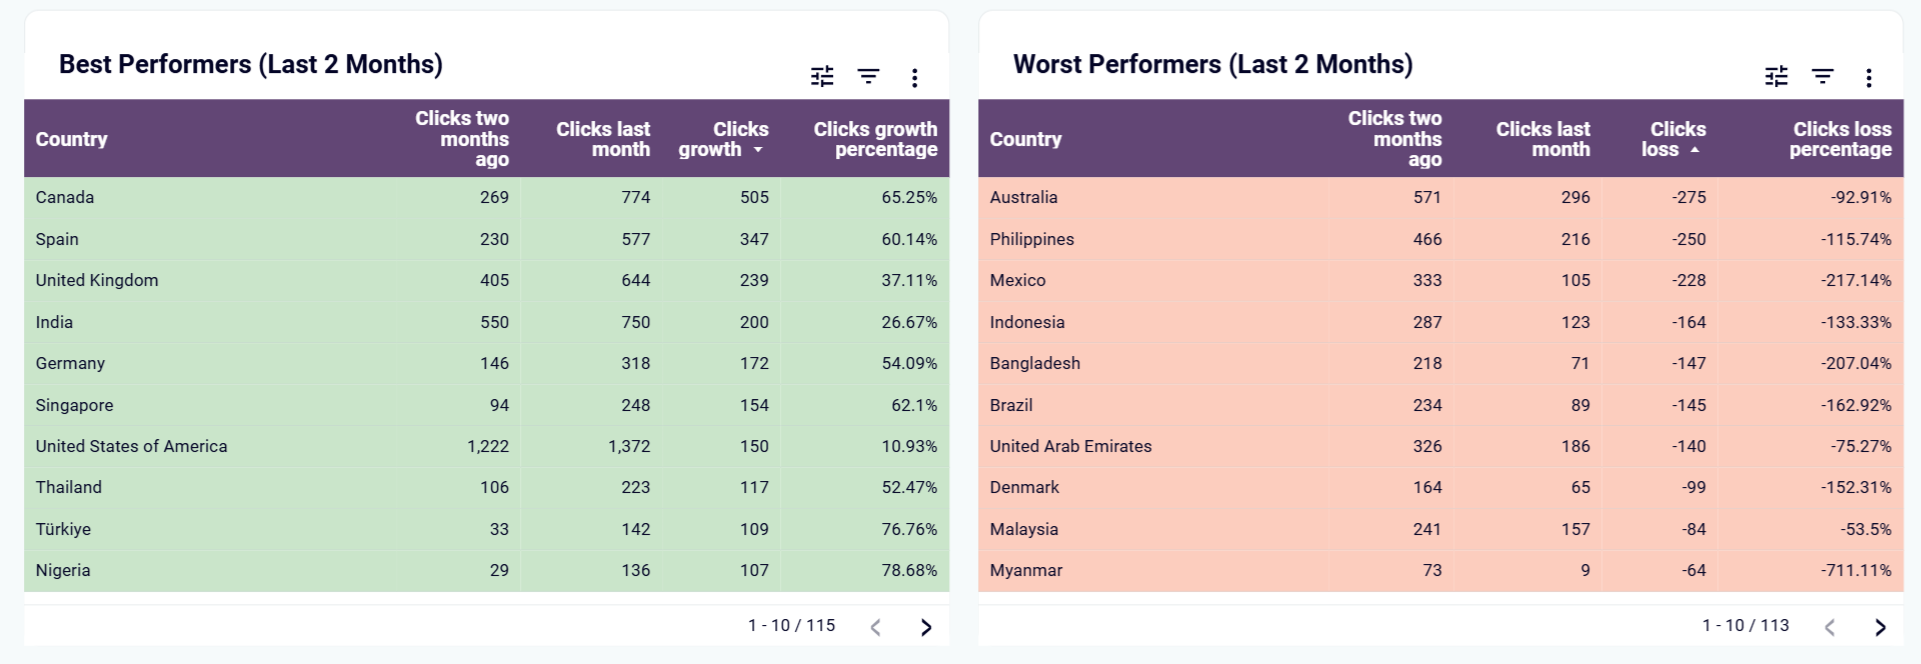
Identify geographic opportunities and threats within days instead of months. Two comparison tables in the Global SEO dashboard analyze the last 30 days of clicks against the previous 30 days. The top-performing countries table shows markets with the strongest growth, while the declining countries table highlights regions losing traffic. This rapid identification of geographic performance changes enables quick response to market opportunities or issues. Whether a new localized page drives growth in a specific region or competition impacts another market, these insights surface geographic trends that might otherwise remain hidden.
How to create an SEO monitoring dashboard?

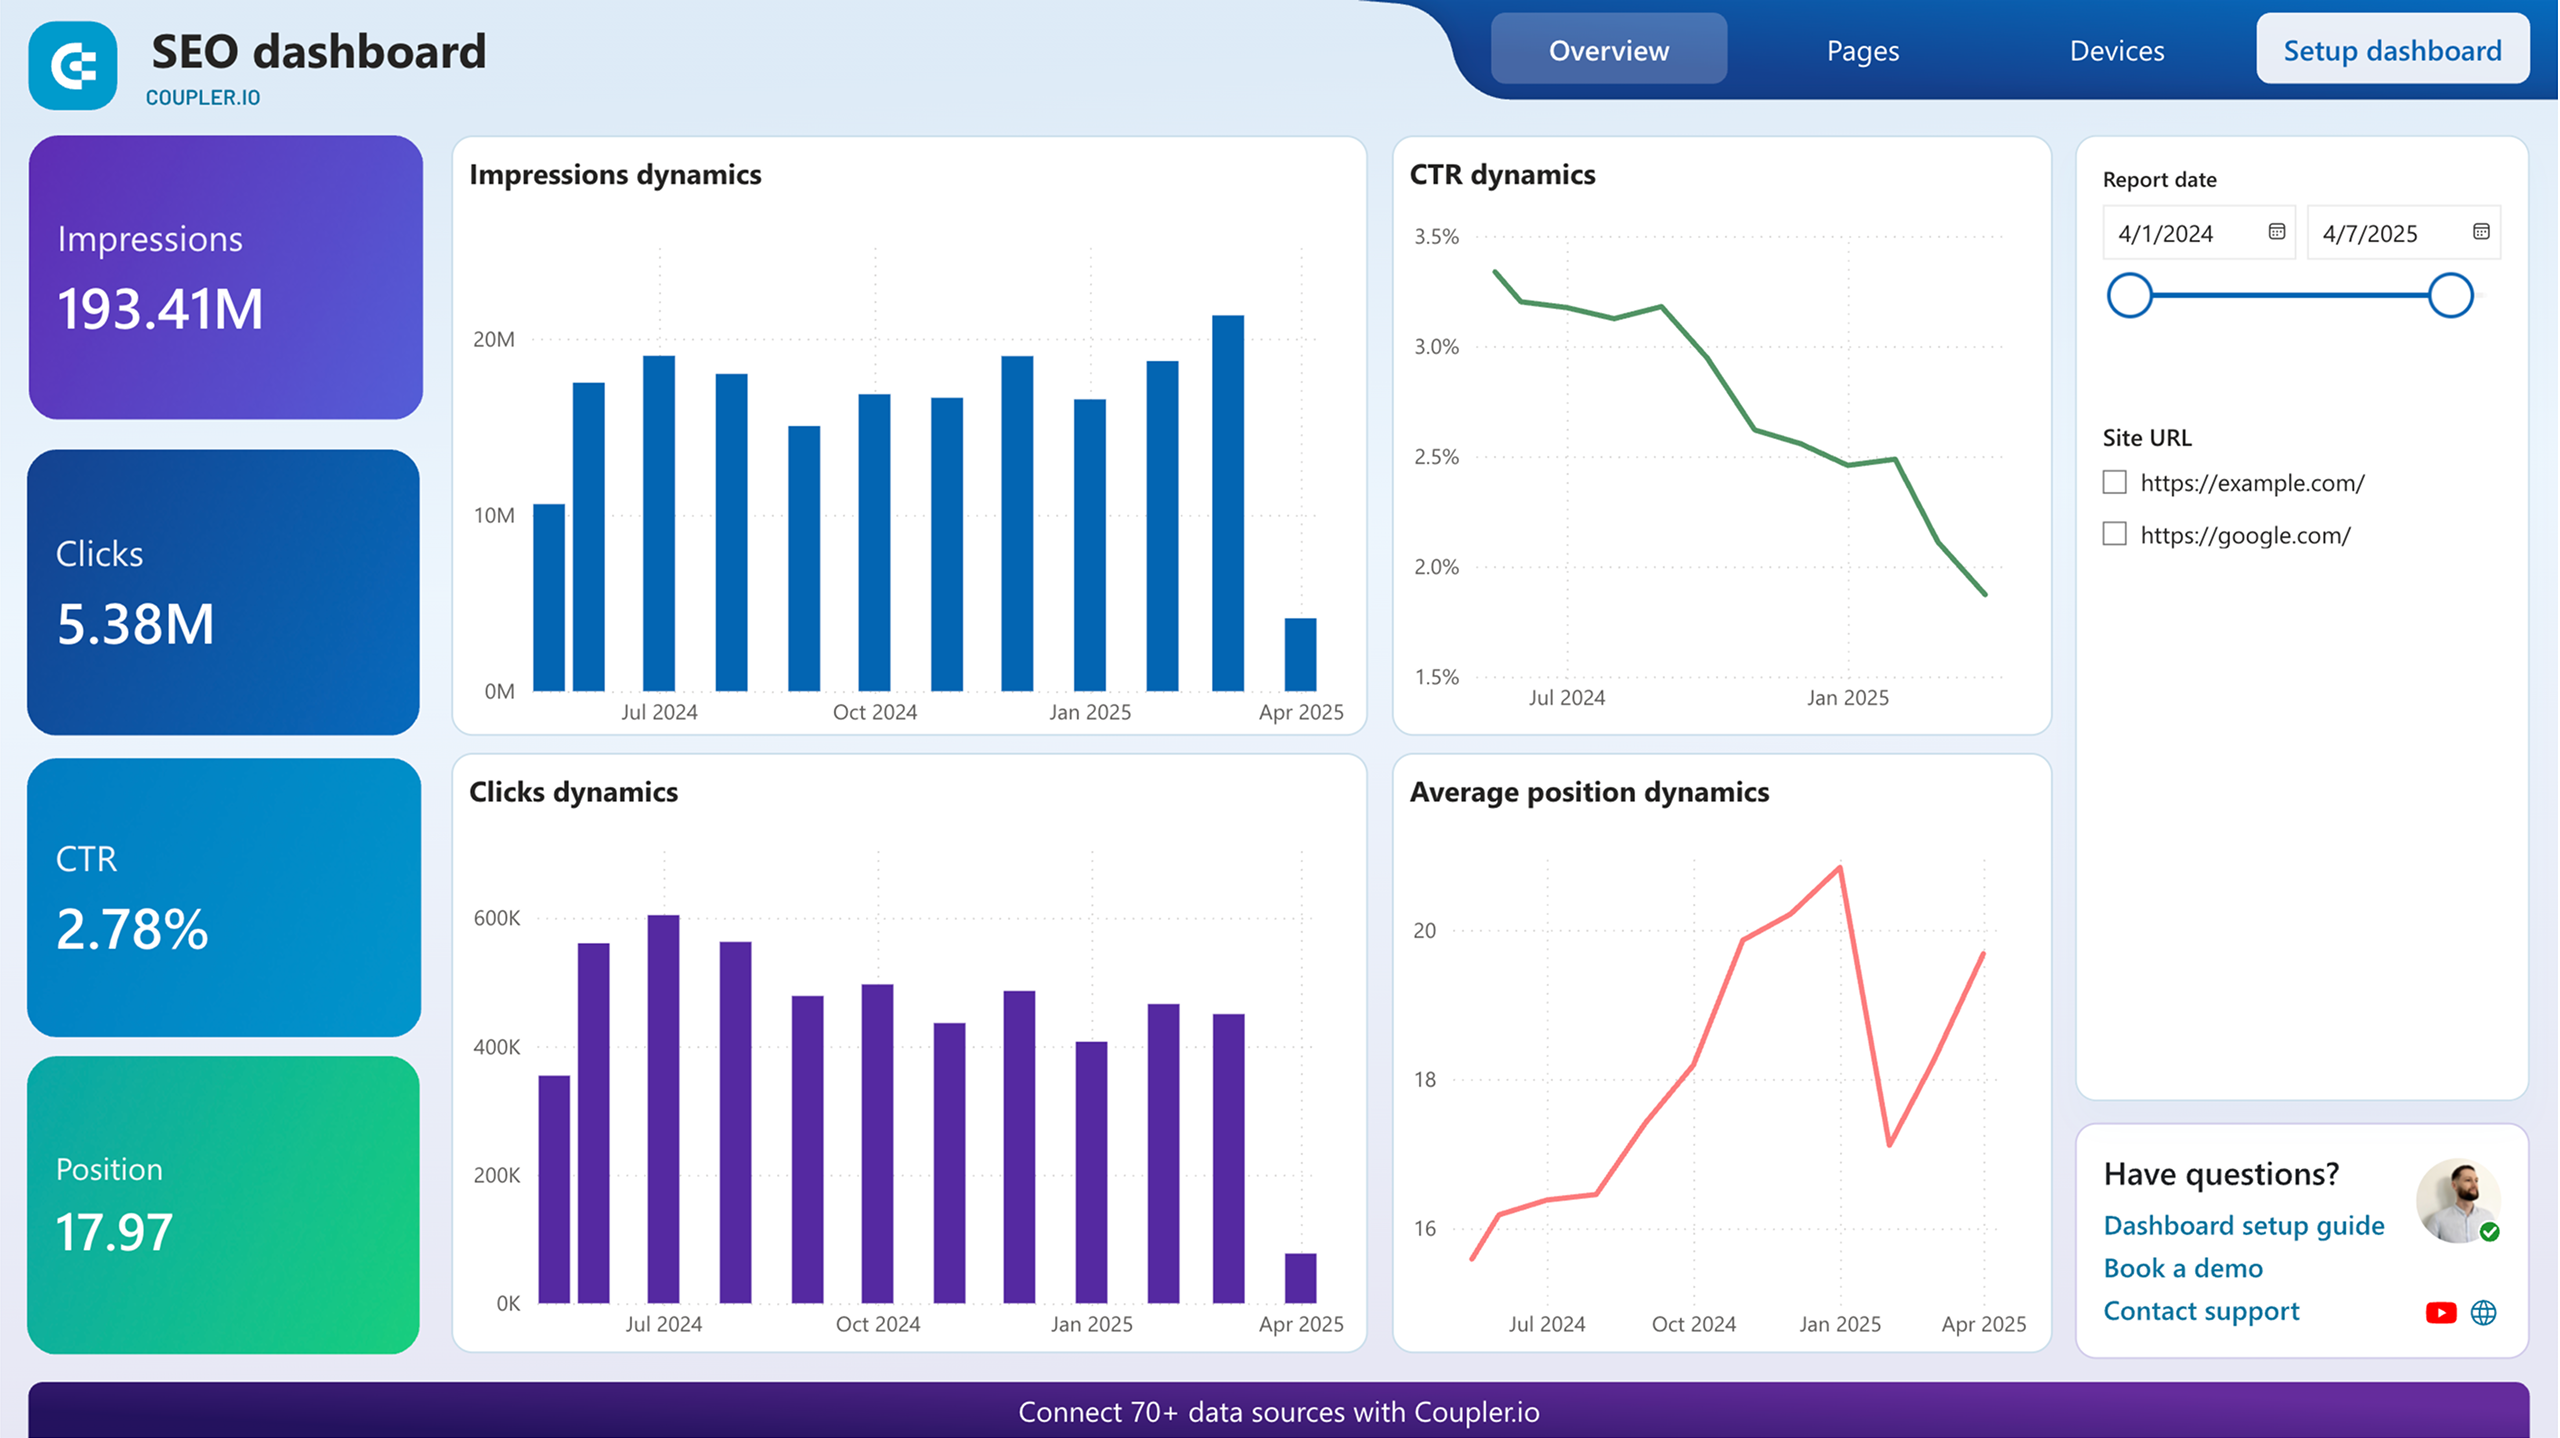
Metrics you can track with an SEO monitoring dashboard template
The total number of times users clicked through to your website from search results. This metric represents actual traffic generated from organic search and serves as the primary indicator of your search visibility's conversion into website visits. Track clicks at the site level, page level, or filtered by device and country to understand which content and markets drive the most traffic. Changes in click volume reveal the immediate impact of ranking improvements, seasonal trends, or algorithmic updates on your traffic generation.
The count of how often your pages appeared in search results, regardless of whether users clicked through. Impressions measure your brand's visibility and content reach in search engines. High impression counts with low clicks indicate opportunities to improve meta titles and descriptions to increase engagement. Track impression trends to understand whether your content is gaining or losing visibility in search results, which often precedes changes in actual traffic patterns.
The percentage of impressions that result in clicks, calculated by dividing clicks by impressions. CTR measures how compelling your search listings are to users. Low CTR despite high impressions suggests your titles and descriptions fail to motivate clicks, even when your pages appear prominently. Analyze CTR by page, query, device, and country to identify specific optimization opportunities. Improving CTR delivers more traffic without requiring ranking improvements, making it one of the most efficient optimization opportunities.
Your typical ranking position in search results for queries where your pages appear. Position 1 represents the top organic result, while positions beyond 10 indicate placement on the second page or lower. Track position trends to measure whether your optimization efforts successfully move pages toward more visible placements. Declining positions signal the need to revisit content quality, technical performance, or competitive analysis. Even small position improvements, such as moving from position 8 to position 5, can significantly impact traffic.