Sales manager dashboard examples and reporting templates
Access automated sales management reporting that pulls CRM data from HubSpot, Salesforce, and Pipedrive into visualization platforms like Looker Studio and Google Sheets. Monitor individual and team performance, analyze pipeline health, identify win/loss patterns, and optimize deal distribution without manual data exports or spreadsheet updates.
Sales manager dashboard examples for every need


about your case. It doesn't cost you a penny 😉
Choose your white label sales manager dashboard to kick off
What is a sales manager dashboard?
Sales manager dashboards go beyond basic CRM reports by consolidating multiple data points into unified views that reveal patterns in team performance, deal progression, and conversion rates. With automated data refreshes via Coupler.io, the dashboard ensures you're always working with the latest information without manual exports or data consolidation. It creates a single command center for understanding both individual performance and overall pipeline health.

What reports should be included in sales manager dashboards?
Every effective sales manager reporting dashboard should provide visibility into both team dynamics and pipeline mechanics. Drawing from our analysis of CRM sales manager dashboard templates across HubSpot, Salesforce, and Pipedrive, four report categories deliver the most value for sales leaders making daily decisions.
Team performance analysis requires more than vanity metrics. These reports show win rates, close rates, and days to close across all team members, revealing who consistently converts opportunities and who needs support. By comparing metrics across owners, you identify patterns in achievement levels and can redistribute high-value deals to your strongest closers. The reports also highlight deal type preferences, showing which team members excel with specific opportunity categories. Filter by revenue range to understand whether certain reps are better suited for enterprise deals versus transactional sales. This segmented view enables strategic territory planning and targeted skill development.
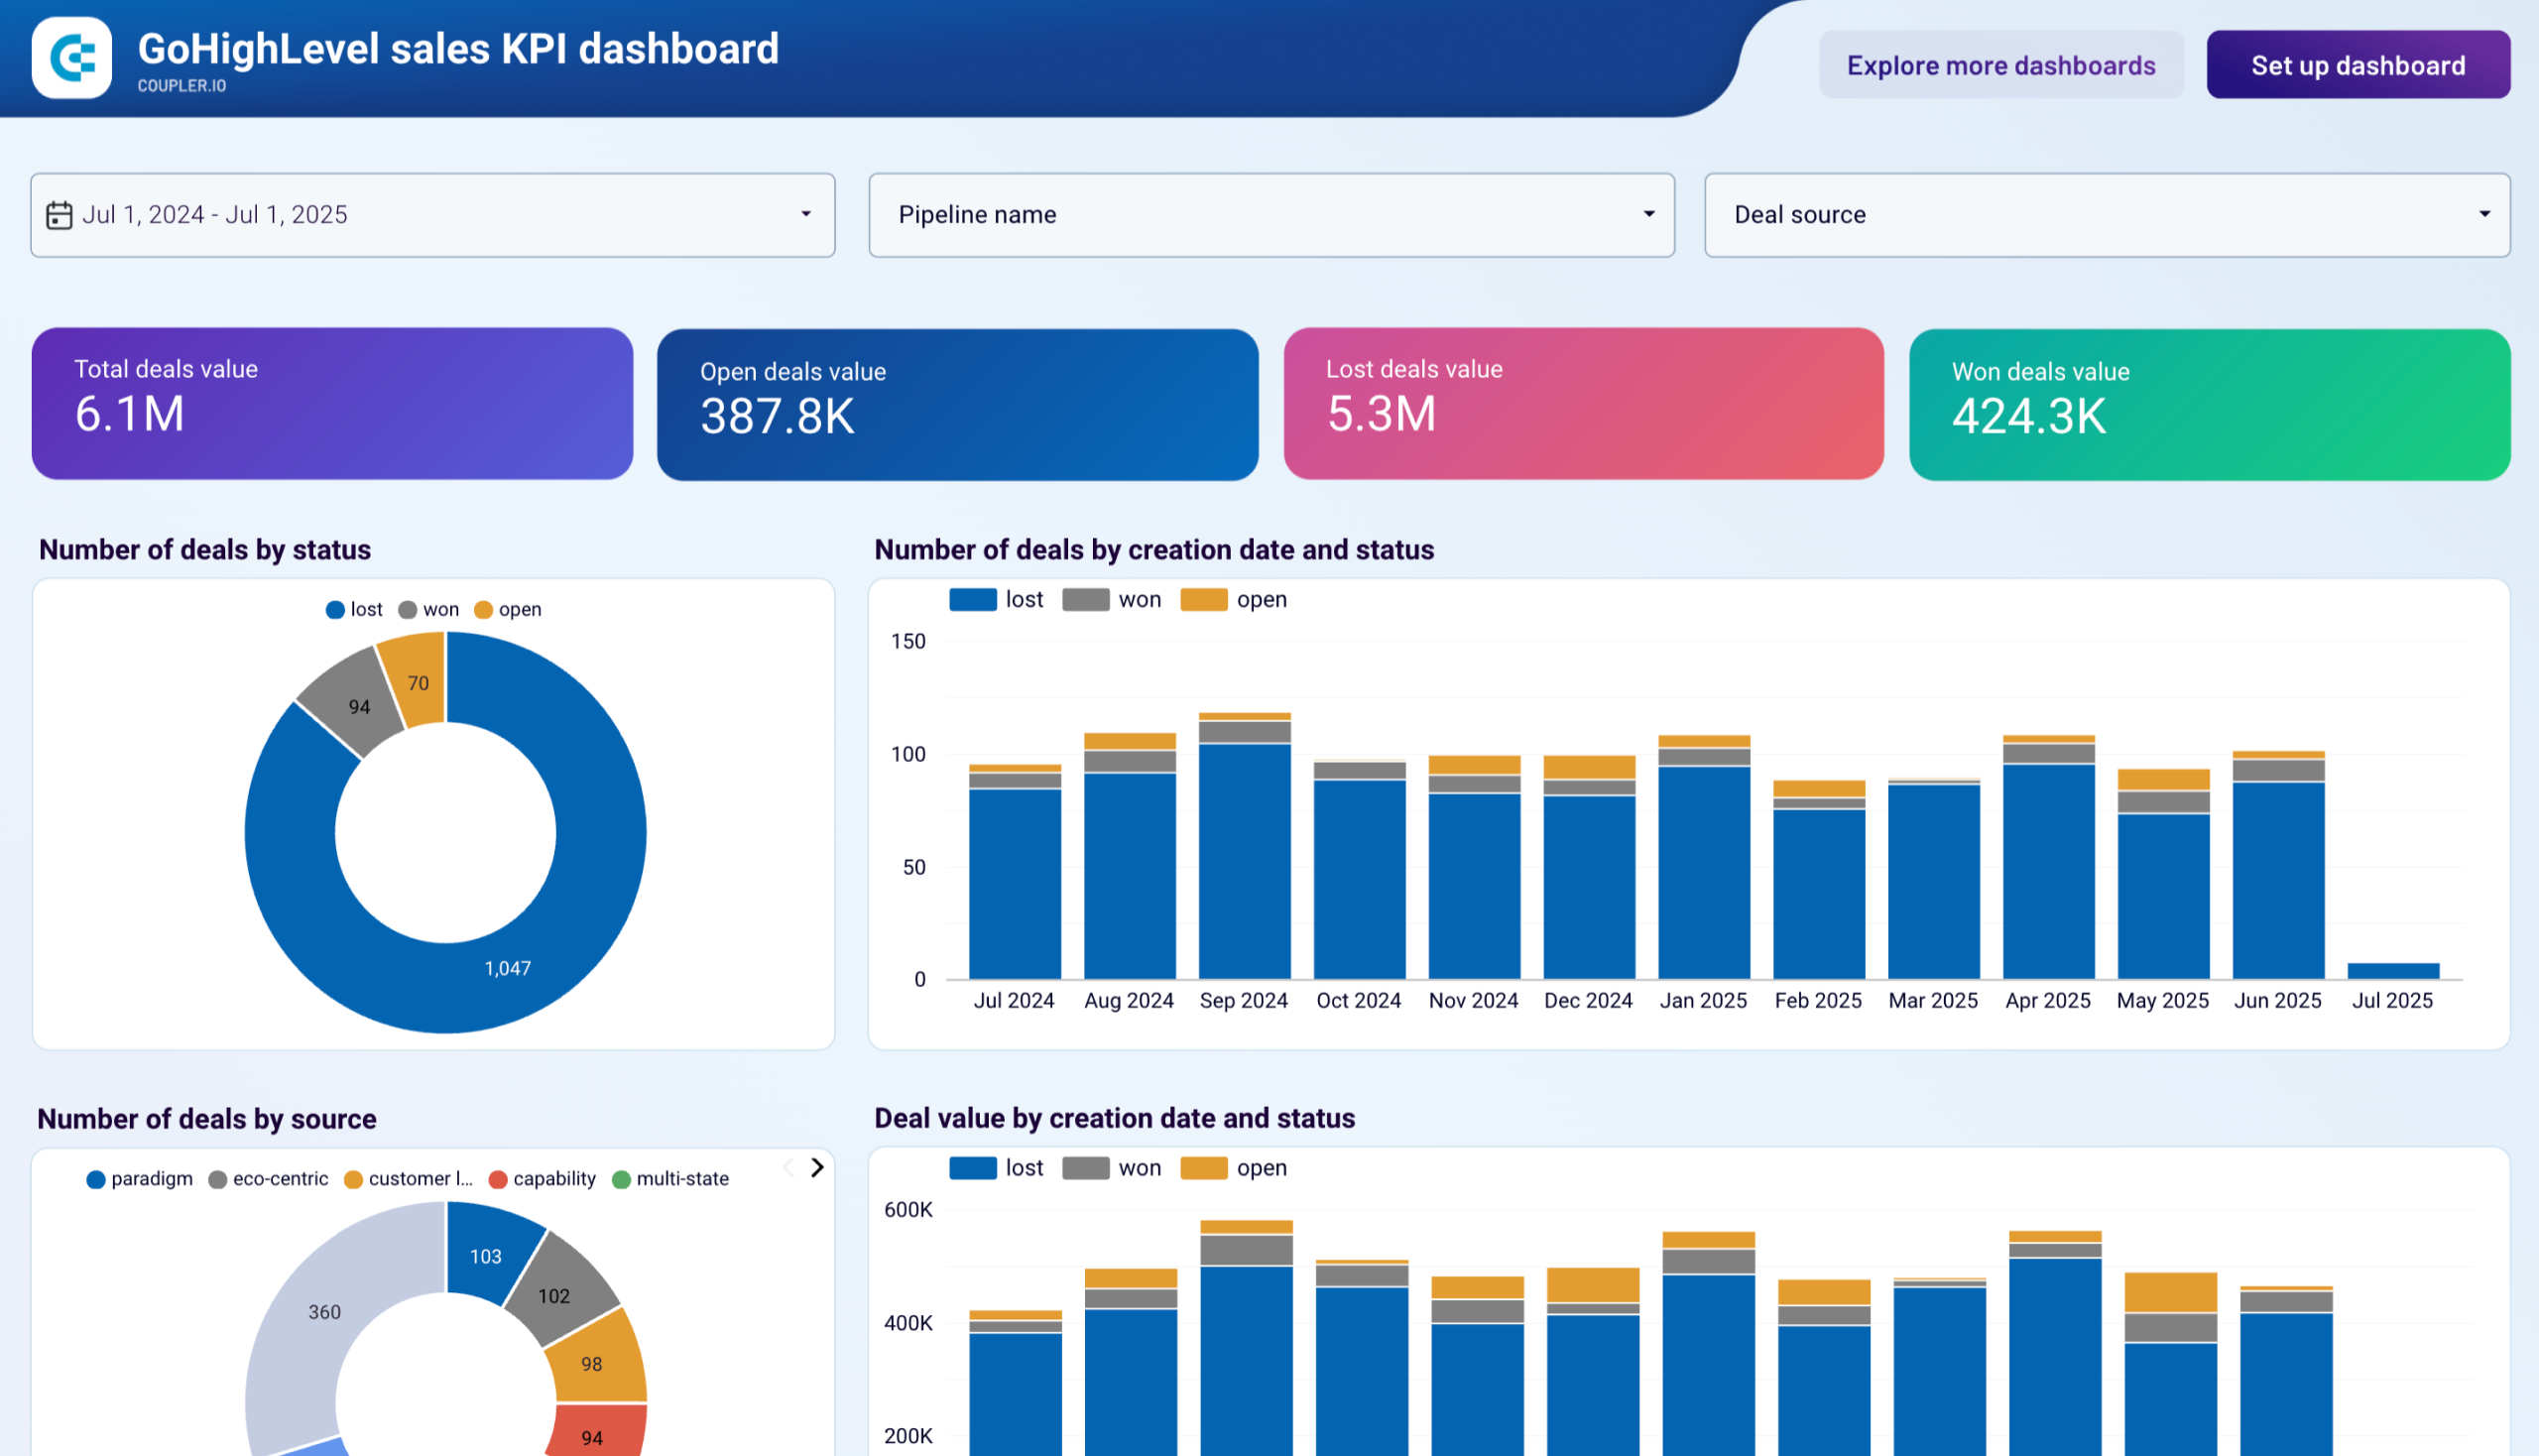
Understanding how deals move through your funnel is critical for identifying bottlenecks and forecasting accurately. Pipeline reports visualize deal distribution across stages, showing where opportunities accumulate and where they drop off. Customizable funnel views let you define up to five stages and track conversion rates between each phase. Apply filters by owner or deal type to compare how different segments perform at each stage. When you notice deals stalling in specific phases, you can intervene with additional resources or adjust qualification criteria. These reports also track projected revenue by stage, helping you forecast future outcomes based on current pipeline composition.
Learning from closed deals improves future performance. Win/loss reports segment opportunities by outcome and provide detailed breakdowns by owner, lead source, deal type, and geography. Compare characteristics of won deals versus lost opportunities to identify success patterns. Filter by revenue size to understand which deal tiers your team converts most effectively. The reports also reveal common reasons for lost deals, helping you address recurring challenges through training or process adjustments. Tracking these patterns over time shows whether your interventions are working and where further optimization is needed.
Sales performance fluctuates based on seasonality, marketing activities, and market conditions. Trend reports track deal volume and revenue dynamics across months, revealing patterns you can leverage for planning. Identify peak periods for resource allocation and slow periods where additional lead generation may be necessary. Compare trends across team members to understand whether performance variations reflect individual capability or external factors affecting everyone. Correlate sales patterns with specific campaigns, events, or team changes to understand what drives results. These longitudinal views inform strategic decisions about hiring, budget allocation, and territory adjustments.
What insights you can get with the sales management dashboard
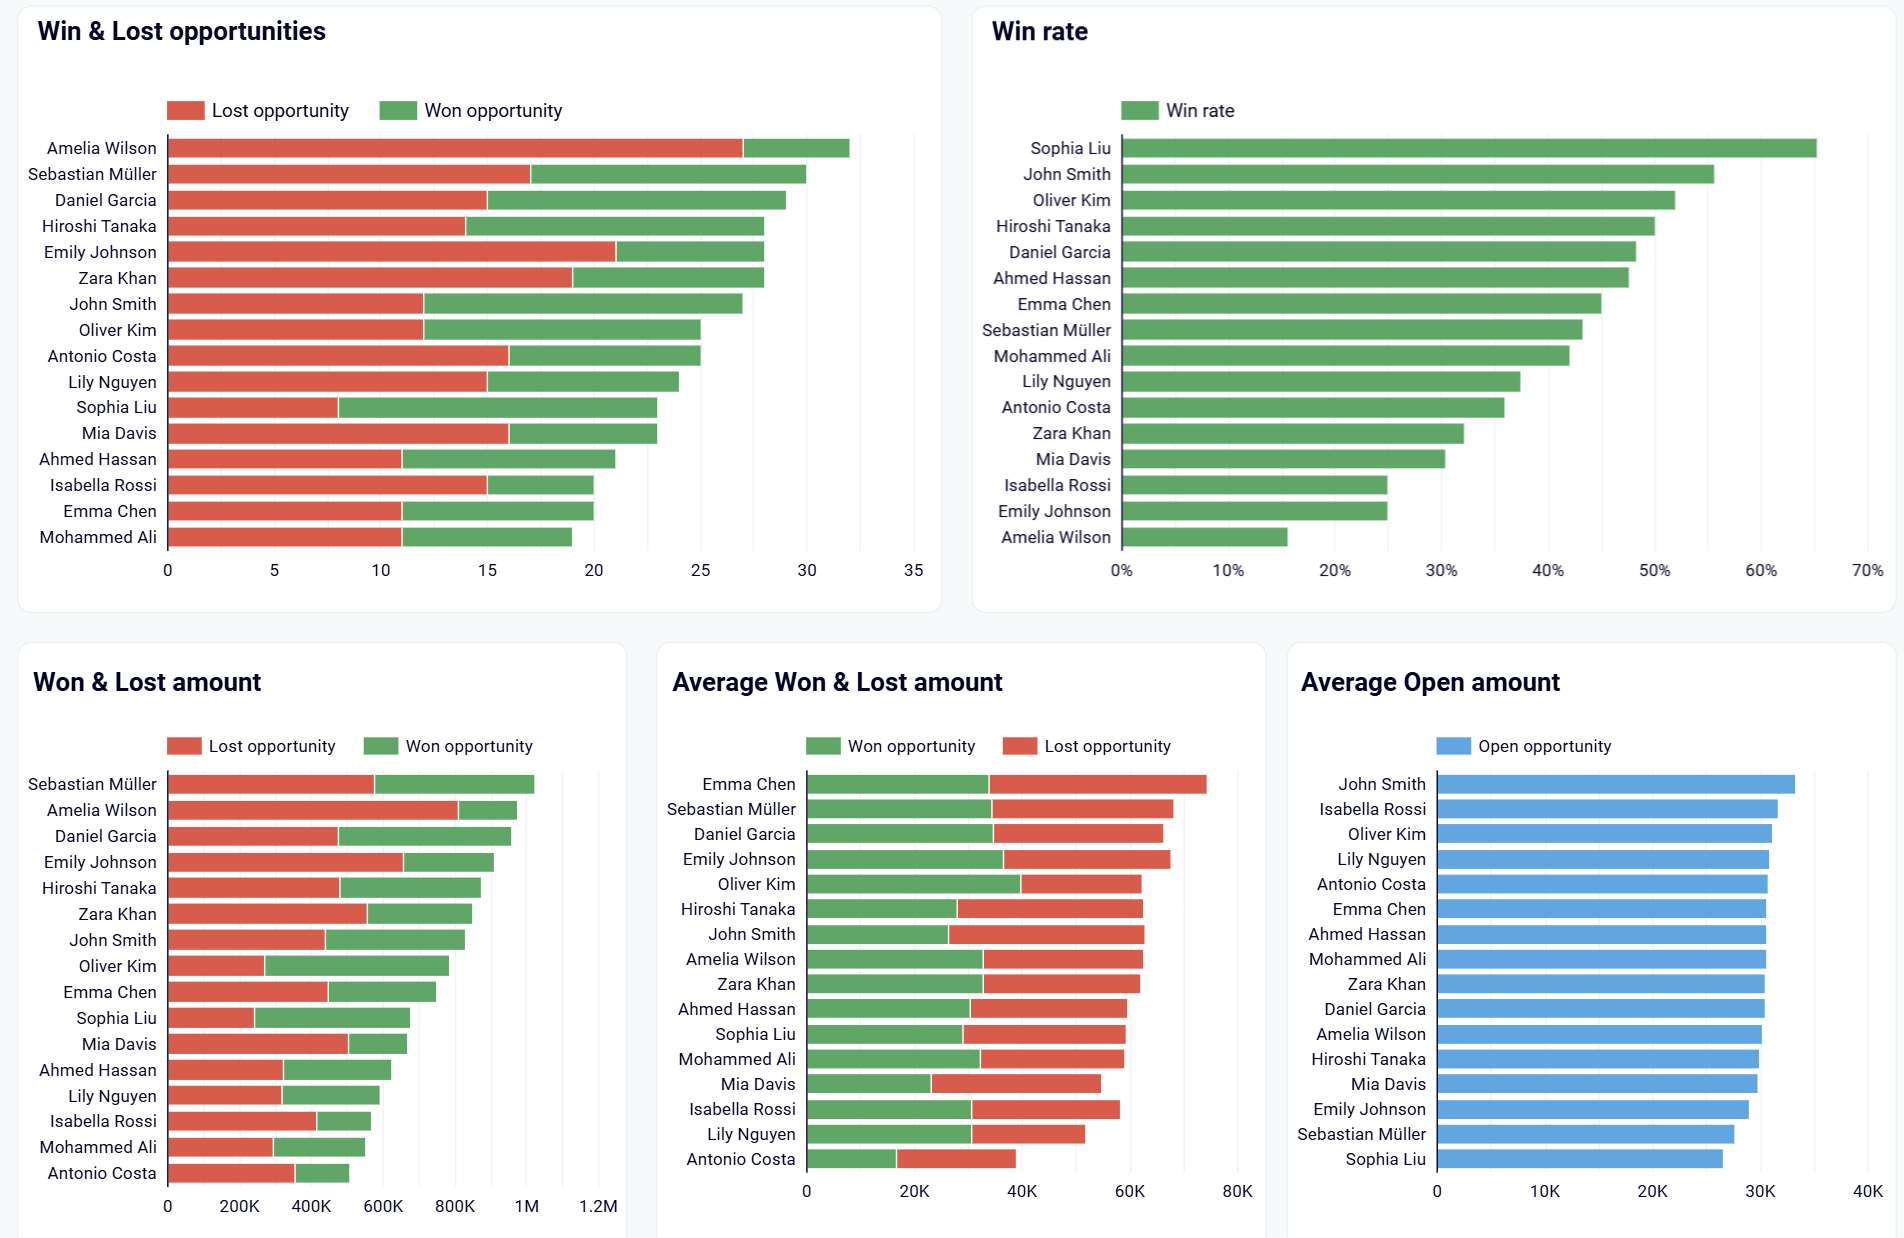
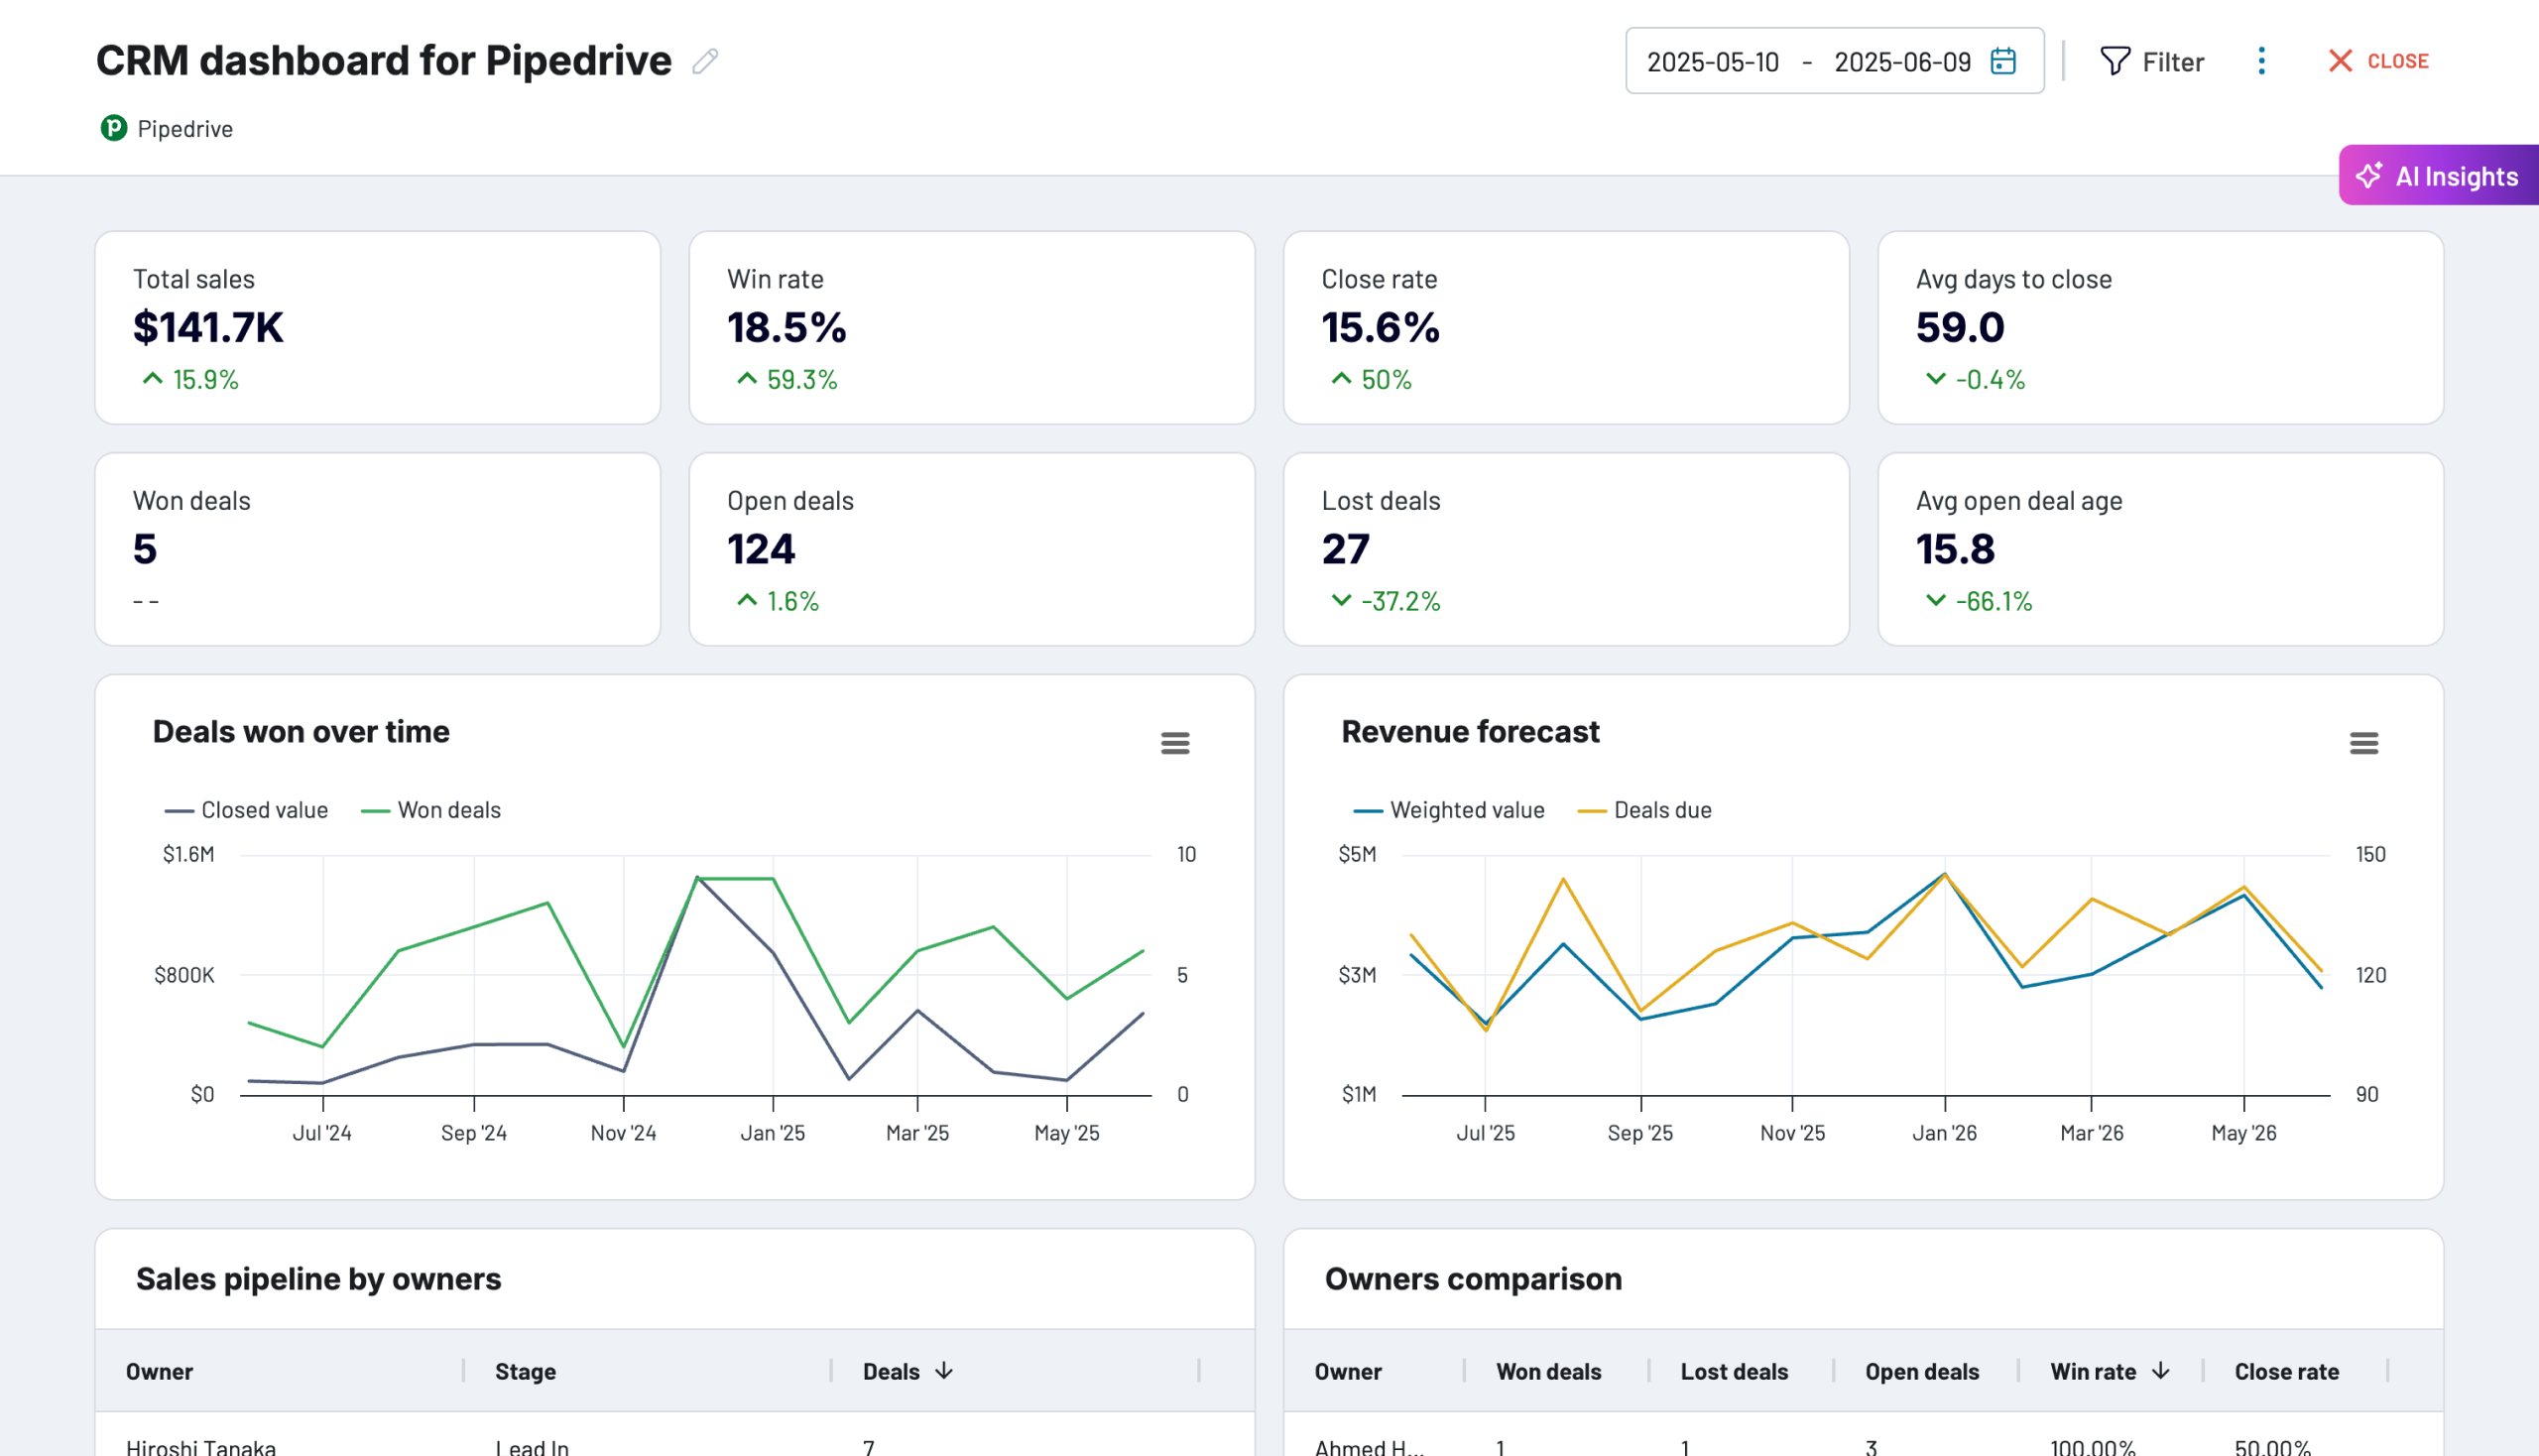
Compare win and loss rates across your entire team to identify top performers and redistribute high-value opportunities accordingly. The dashboard displays win rates, won and lost opportunity counts, and average deal sizes by team member, letting you spot performance gaps immediately. When you see one rep closing at 60% while another sits at 25%, reassign similar deal types to maximize conversion and revenue without adding headcount.
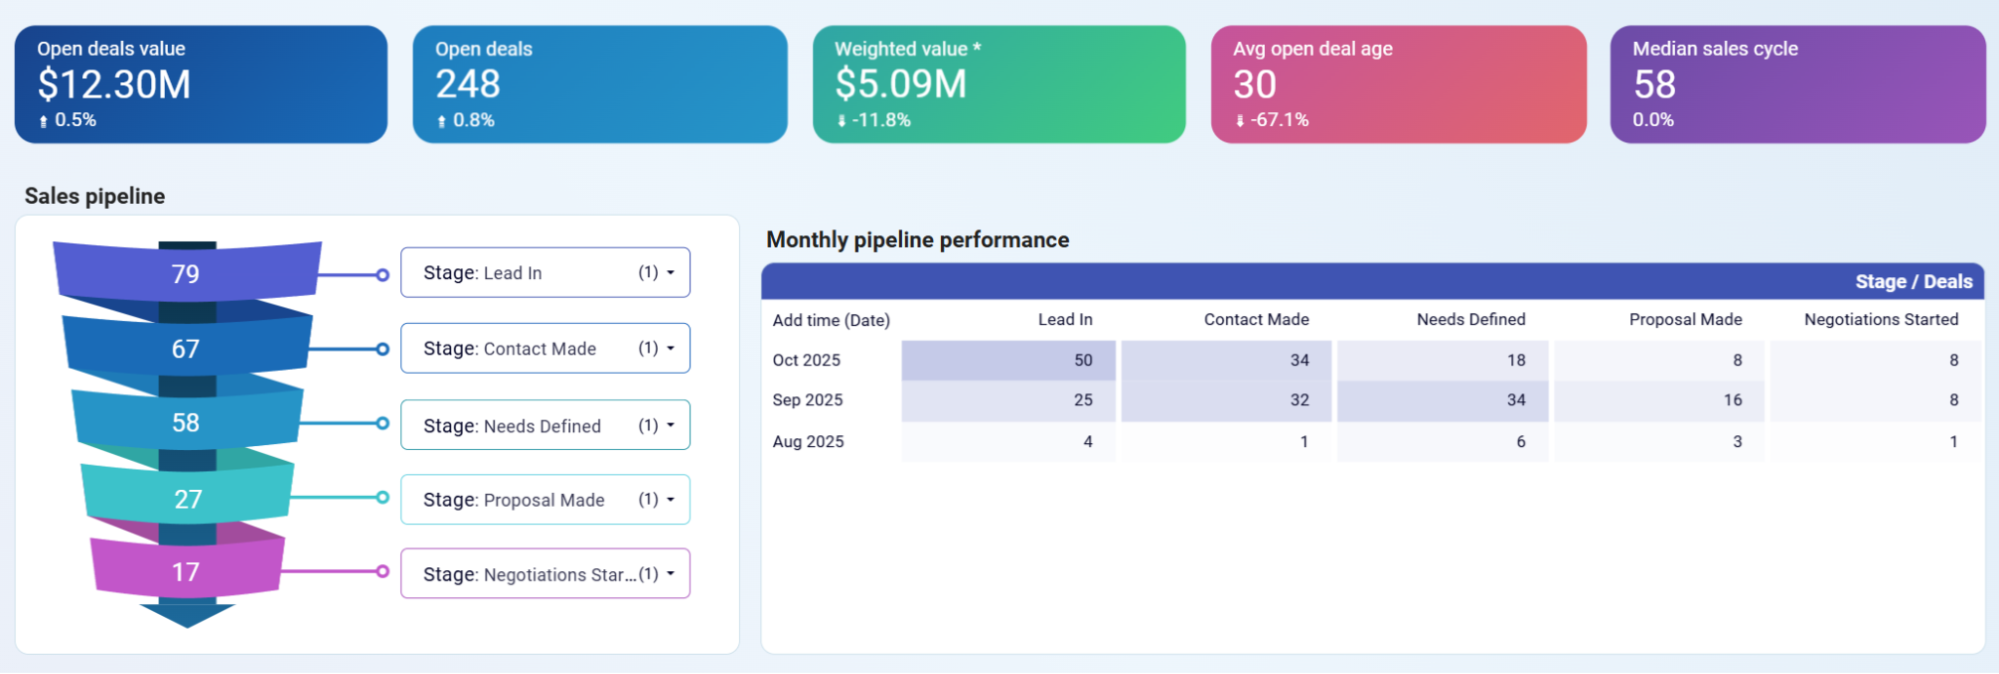
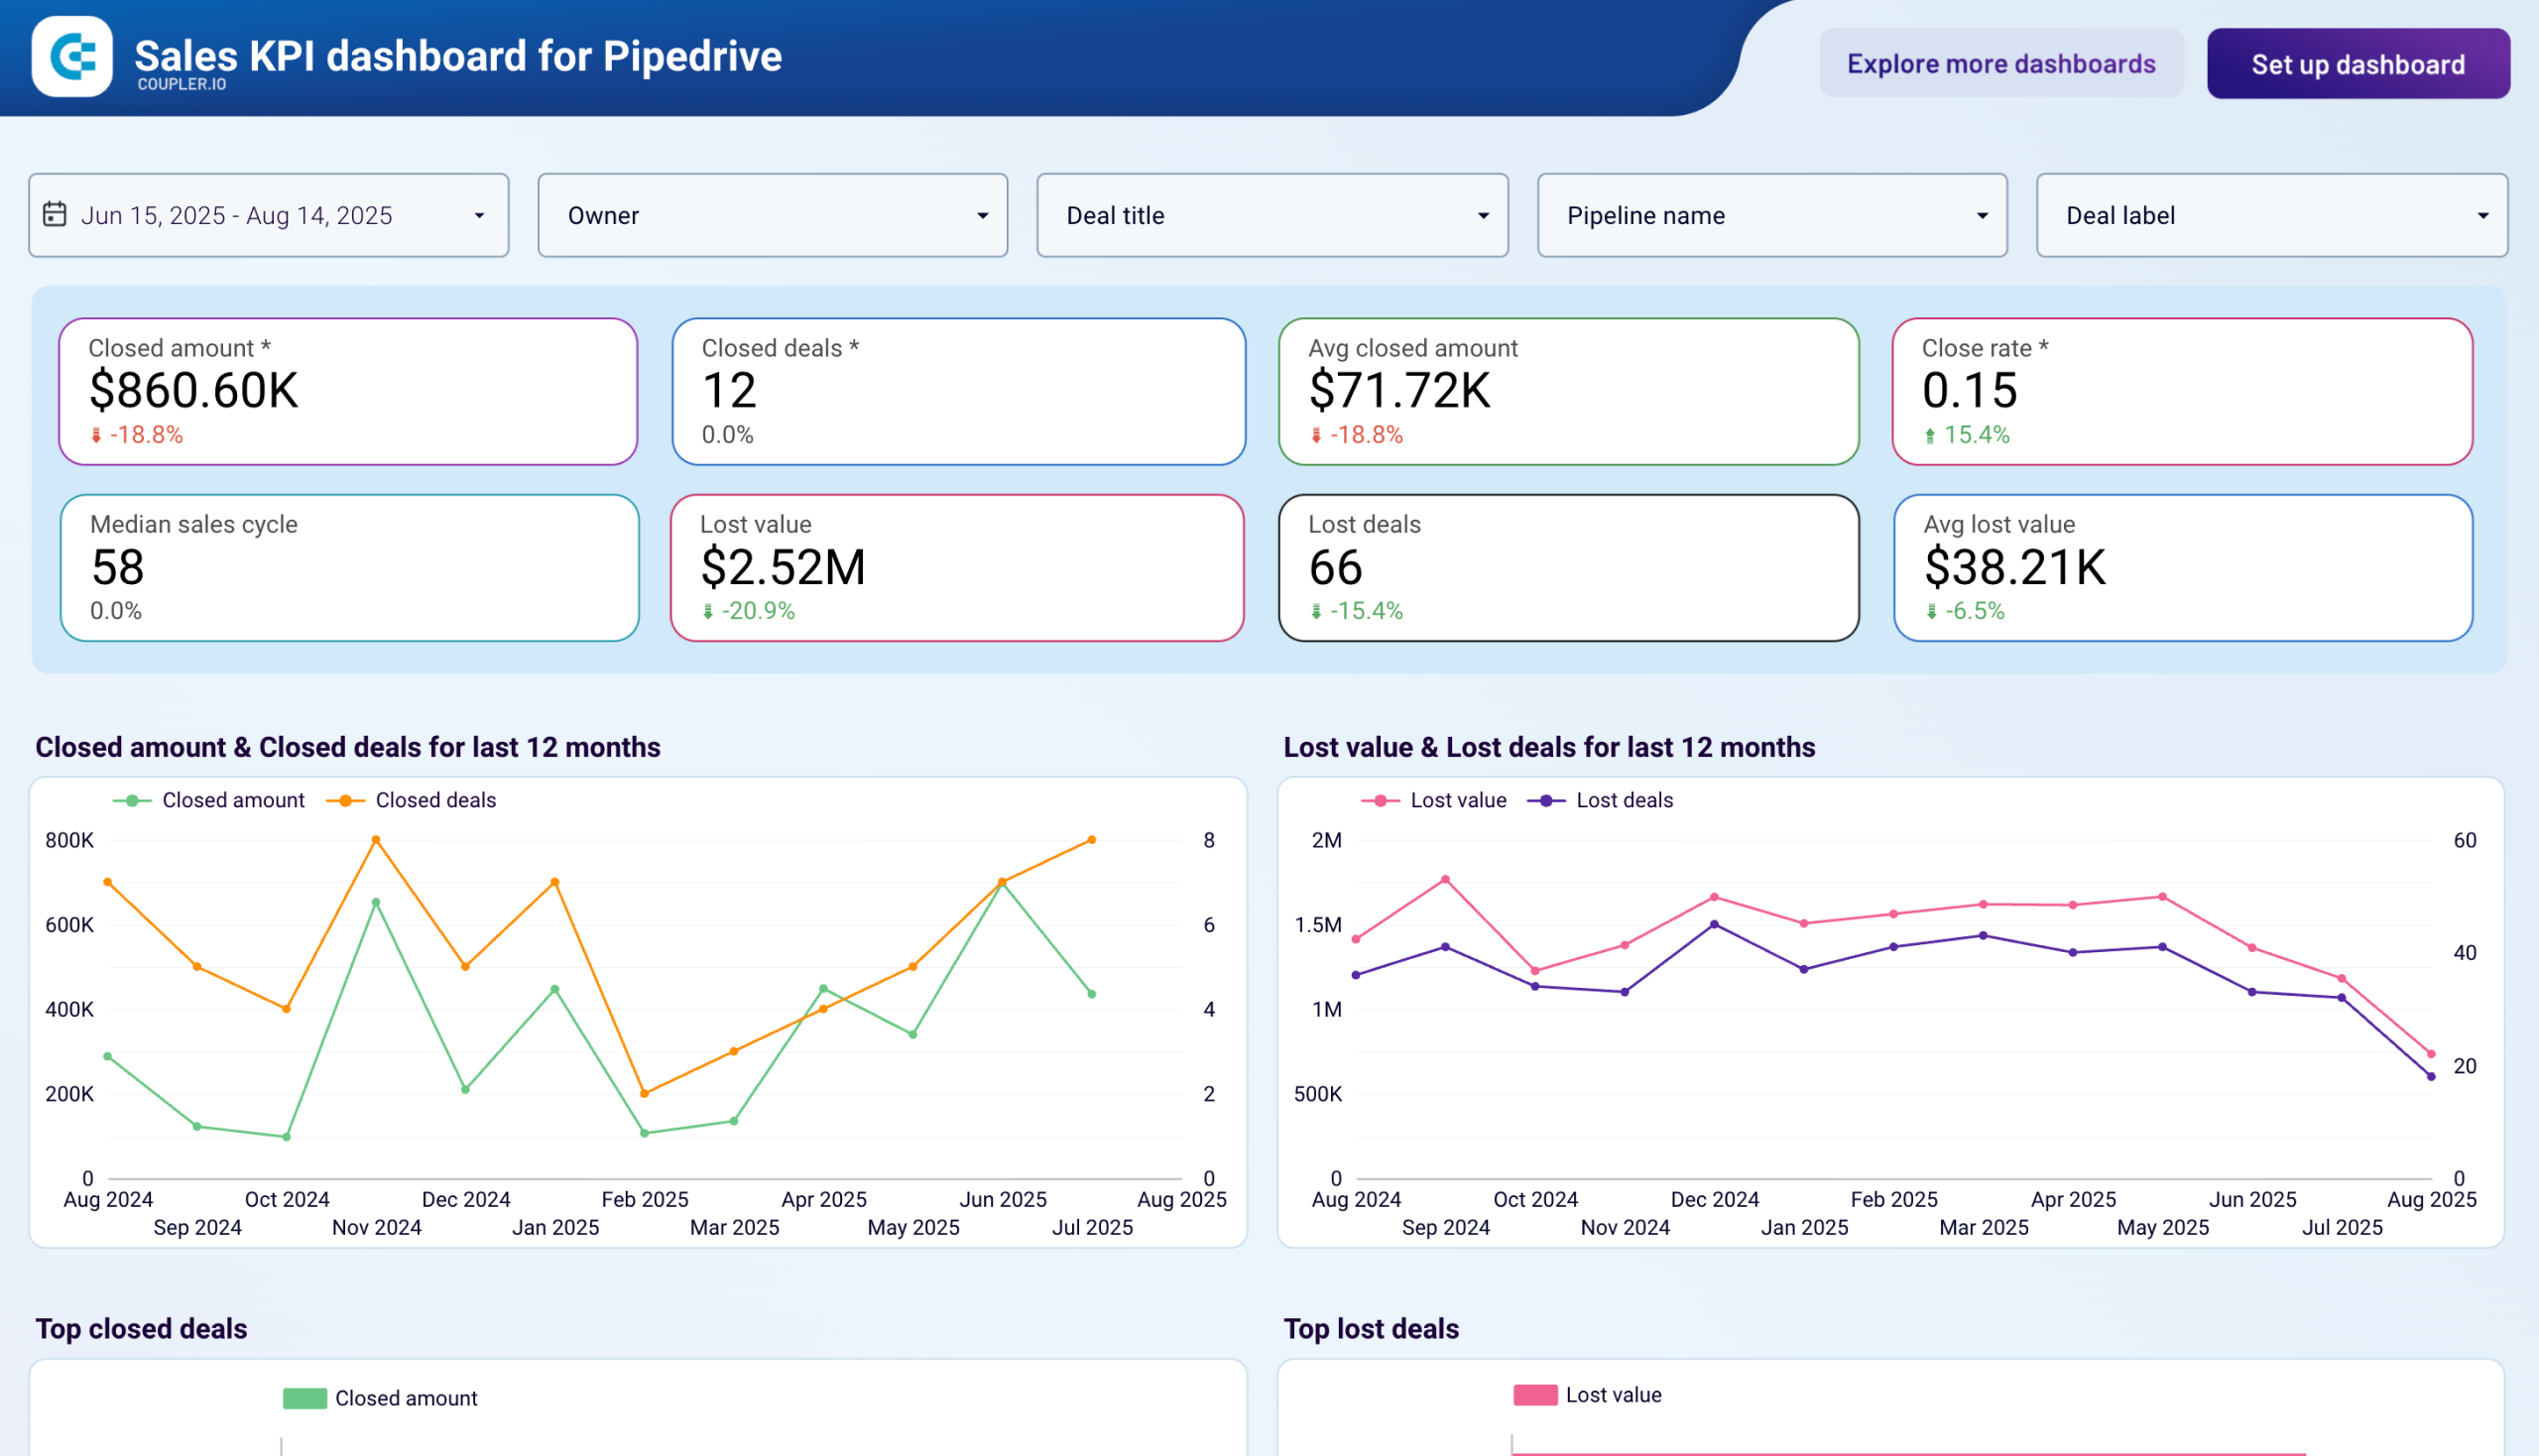
Monitor how deals move through your sales stages month over month with pipeline funnel visualization and stage-by-stage breakdowns. The dashboard shows open deal values, weighted pipeline, average deal age, and median sales cycle alongside monthly performance tables. Use this data to identify bottlenecks where deals accumulate, adjust your forecast based on weighted values, and intervene when deal age exceeds your normal cycle time.

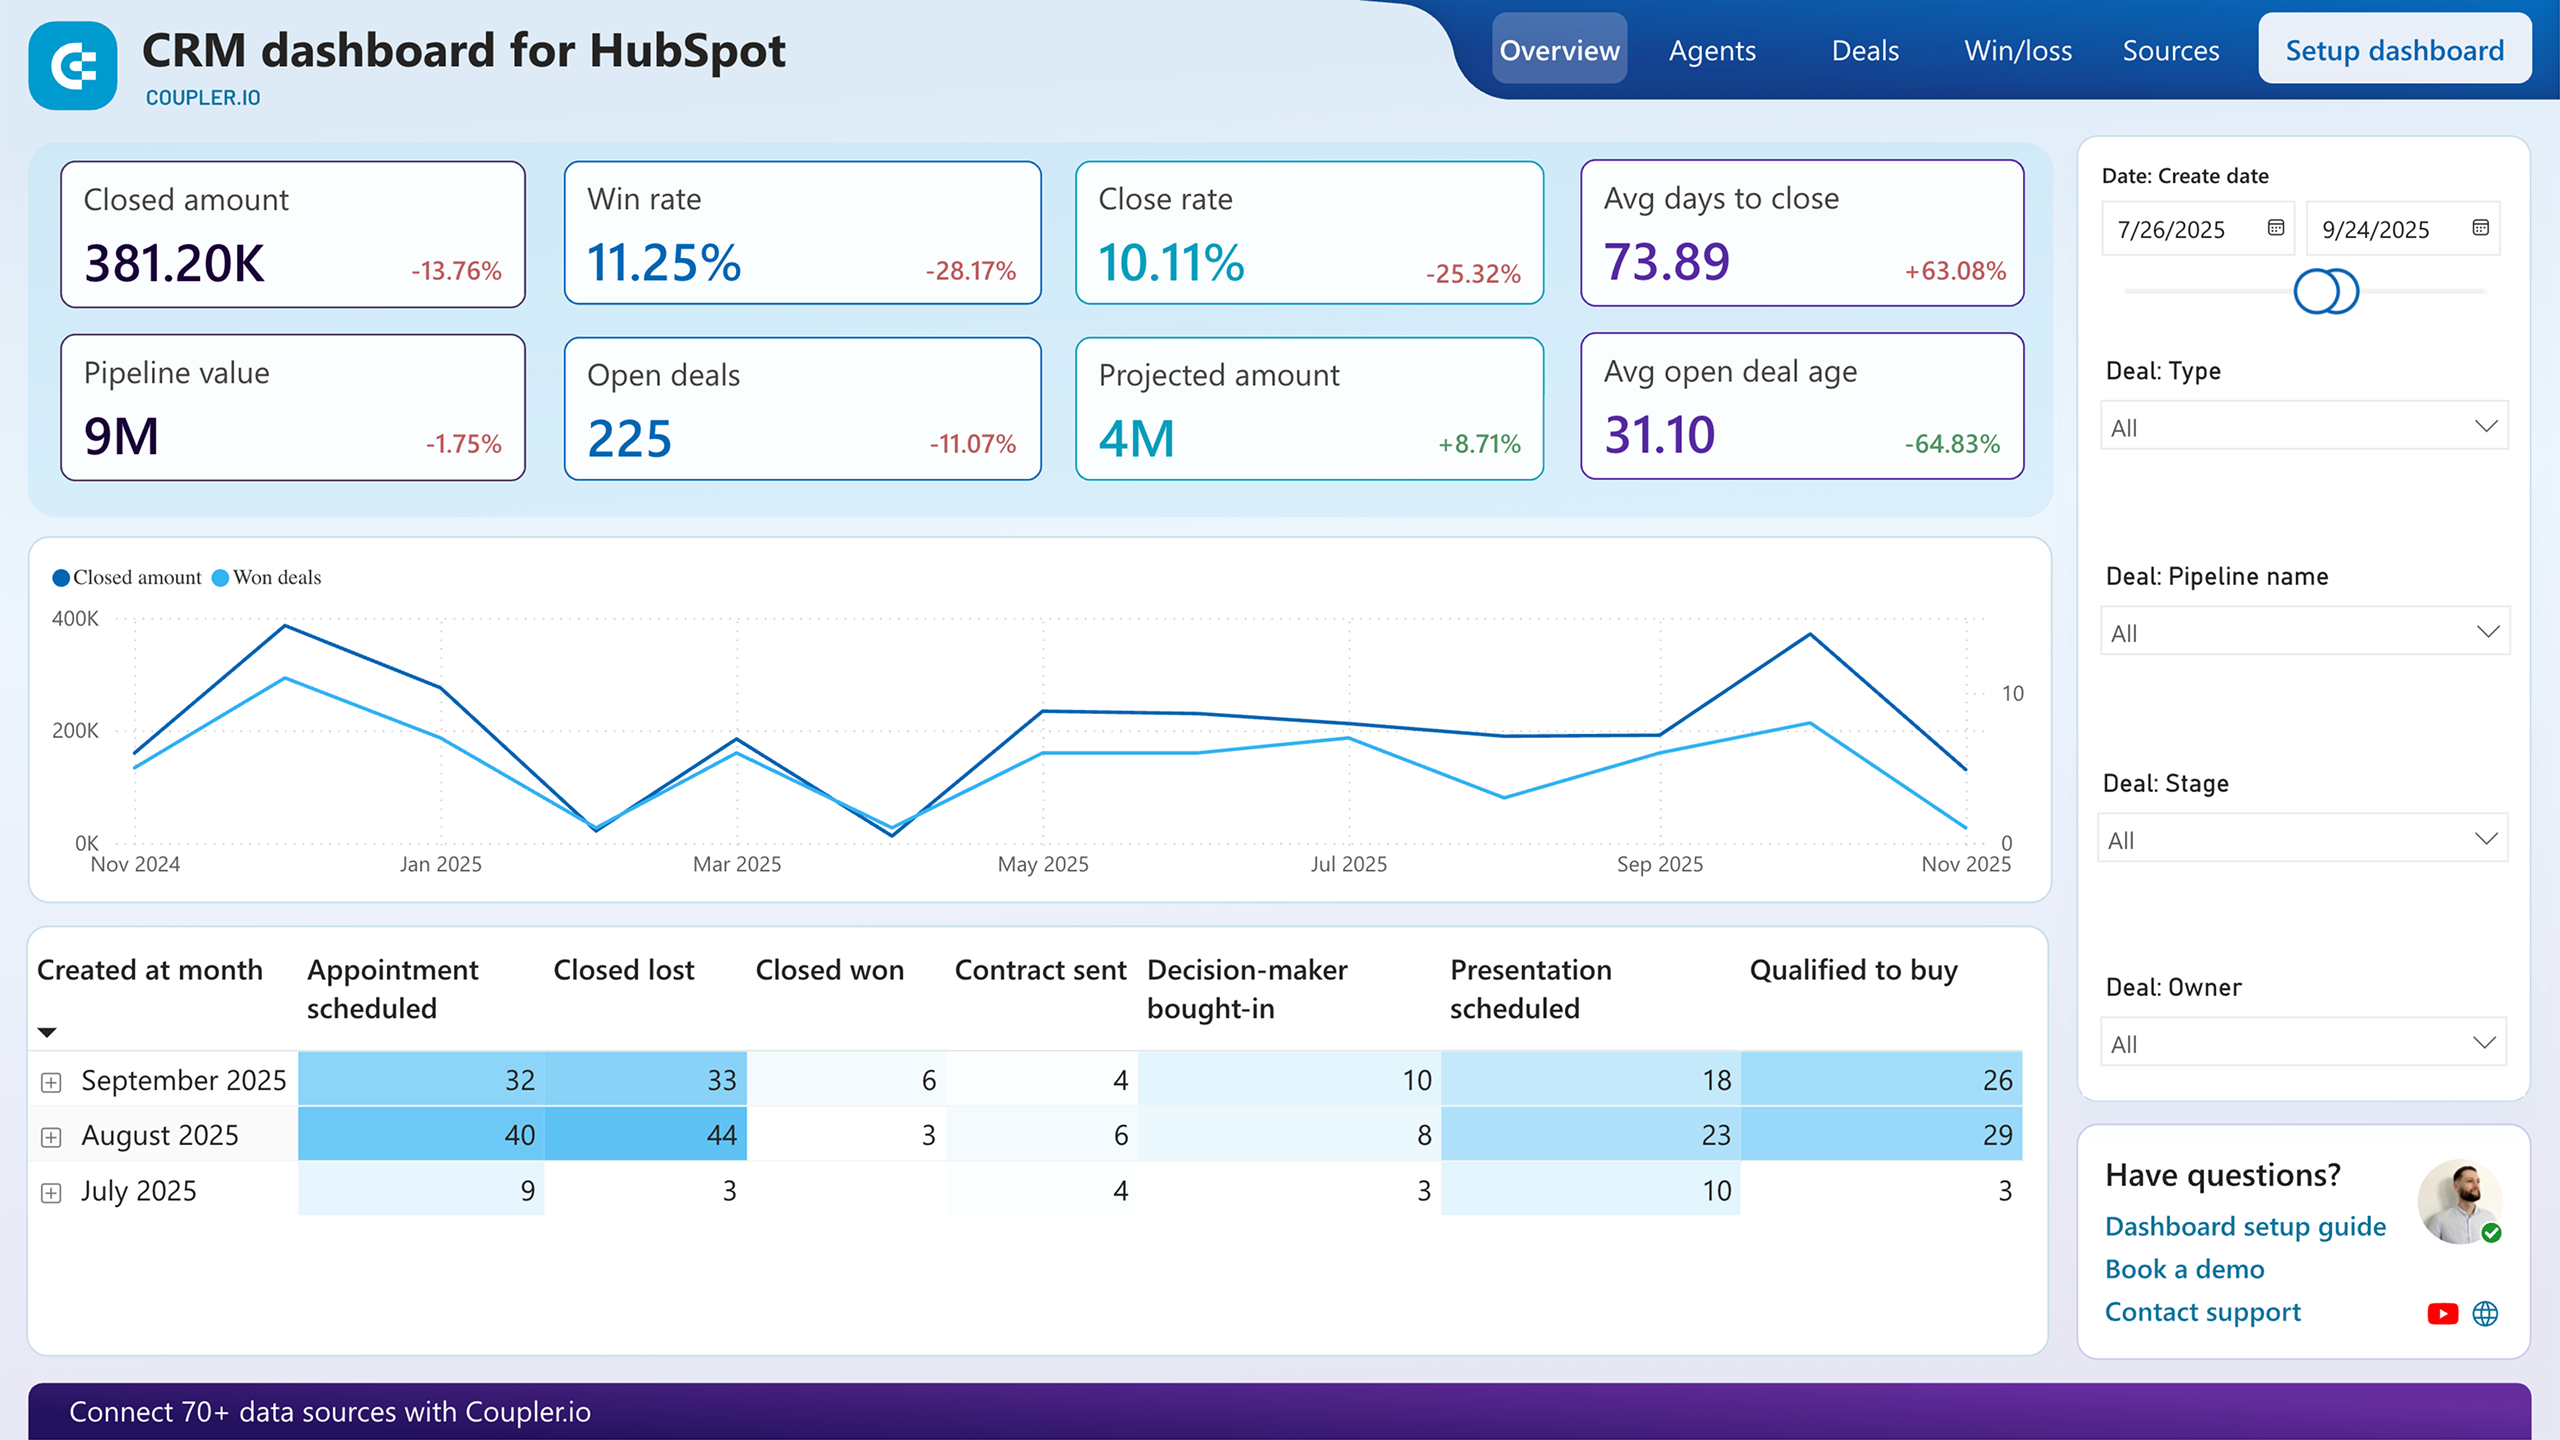
Drill down into every open deal with detailed tables showing owner, stage, value, probability, and critical "rotten days" metrics. Filter by team member to see exactly which deals are sitting idle and for how long, then take immediate action before they're lost. Schedule coaching sessions when specific reps show patterns of stalled deals, or reach out directly to prospects when opportunities exceed your acceptable aging threshold.
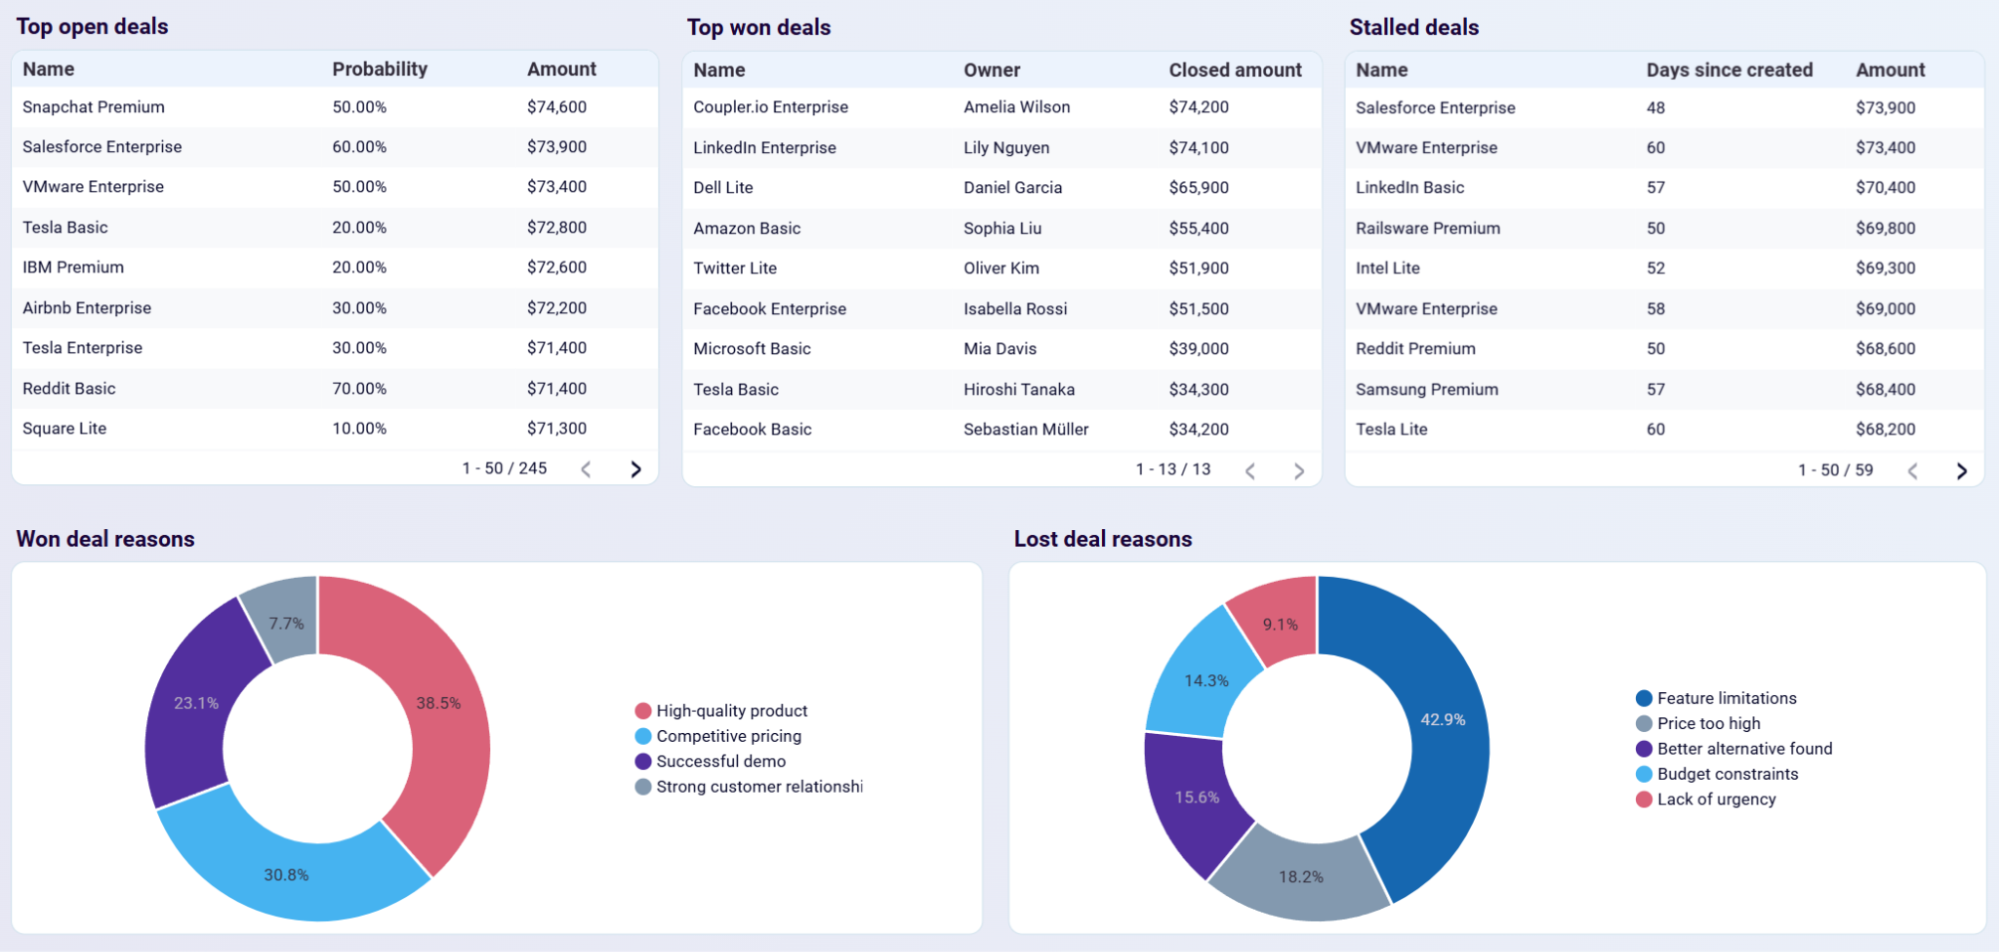
Examine each rep's complete deal portfolio including top open opportunities, won deals, and stalled deals alongside win/loss reason breakdowns. The dashboard reveals who consistently wins and why, which deals are stuck for each team member, and the specific reasons behind lost opportunities. Use win/loss reason analysis to replicate successful behaviors and address recurring failure patterns through targeted training.
How to create a sales manager dashboard?

Metrics you can track with a sales manager dashboard template
Track the total monetary value of closed-won opportunities across your team, with breakdowns by owner, time period, and deal characteristics. This metric shows which team members drive the most revenue and helps you identify patterns in high-value conversions. Monitor trends over time to spot growth trajectories or concerning declines that require attention. Use this data to set realistic quotas, allocate territories based on revenue potential, and reward top performers who consistently deliver results.
Measure the percentage of opportunities that result in closed-won deals compared to total opportunities created. This ratio reveals conversion effectiveness at the team and individual level. Compare win rates across owners to identify your strongest closers and those who need coaching. Segment by deal type or revenue size to understand where your team performs best and where processes need refinement. A declining win rate signals problems with lead quality, qualification processes, or competitive positioning.
Monitor the total number of deals that ended in closed-lost status, providing visibility into revenue that slipped away. Track this metric by owner to identify who loses deals most frequently and which team members maintain healthy conversion rates. Analyze trends over time to determine whether your loss rate is improving or deteriorating. When combined with loss reasons, this metric helps you understand whether deals are lost to competitors, budget constraints, or timing issues that require strategic responses.
Calculate the average time required to move opportunities from creation to closed-won status. This metric reveals deal velocity and highlights inefficiencies in your sales process. Compare days to close across team members to identify who moves deals fastest and who gets stuck. Segment by deal type or size to understand realistic timelines for different opportunity categories. Shorter cycles often indicate better qualification and more effective selling techniques that can be replicated across the team.
Measure the total expected monetary value of opportunities currently in your pipeline, weighted by stage probability and close date. This metric provides visibility into future revenue potential and helps you forecast accurately. Monitor how projected revenue changes over time to identify whether your pipeline is growing or shrinking. Compare projected revenue across team members to ensure balanced workload distribution and identify who needs more opportunities to hit their targets.
Track the number of active deals currently in your pipeline, segmented by owner, stage, and age. This metric reveals workload distribution across your team and highlights opportunities that may be stalling. Monitor how open opportunity counts change over time to ensure your team maintains healthy pipeline coverage. Identify team members with too many or too few active deals to rebalance territories and prevent rep burnout or underutilization.
Calculate the percentage of opportunities that result in any closed status (won or lost) compared to total opportunities, showing how efficiently your team moves deals to resolution. This metric differs from win rate by measuring decisiveness rather than success. A low close rate indicates deals lingering in pipeline limbo, consuming resources without producing outcomes. Compare close rates across owners to identify who needs help pushing prospects toward decisions and who effectively drives deals to conclusion.
Measure the mean monetary value of closed-won opportunities, revealing typical transaction sizes for your business. Track this metric over time to identify whether deal values are growing or shrinking, which affects revenue forecasting and quota planning. Compare average deal size across team members to understand who handles enterprise accounts versus transactional sales. Use this insight to align rep compensation structures with the deal sizes they typically close and adjust territory assignments based on account values.