Power BI accounting dashboard examples and reporting templates
Track revenue, profitability, and labor hours in one place. These accounting dashboard templates help you spot cost issues and billing mismatches before the monthly close. Coupler.io automates the data load and refresh, so your Power BI reports stay up to date without manual exports or spreadsheet wrangling.
Power BI accounting dashboard examples for every need


about your case. It doesn't cost you a penny 😉
Choose your accounting dashboard template to kick off
What is an accounting dashboard in Power BI?
Coupler.io connects your accounting and time-tracking sources, then refreshes the data on a schedule you set. Instead of exporting CSVs every Monday morning, you open a Power BI accounting dashboard that already reflects the latest invoices, profit and loss figures, and logged hours. The Power BI accounting dashboard examples below combine financial and operational data, so you spend less time assembling numbers and more time acting on them.

What reports should be included in Power BI accounting dashboards?
Accounting reports work best when they show relationships, not just raw totals. The reports below pair financial data with time-tracking data to cover both the money side and the labor side.
Twelve months of revenue plotted alongside expenses reveal patterns that quarterly statements hide. You might notice Q1 revenue dips every year while expenses stay flat, quietly compressing your margin. The profit and loss overview compares income against costs for the last month, month to date, and year to date. A Power BI accounting reporting dashboard built around this report gives finance teams a starting point for budget conversations.
Knowing your total revenue matters less than knowing where it comes from. This report ranks customers by contribution and highlights the products generating the most income. If one client accounts for 40% of your revenue, that concentration is a risk worth surfacing. Small businesses using Power BI accounting dashboards often discover their pricing assumptions are wrong once they see product-level margins.
Billable hours drive revenue for service businesses, but the raw total doesn't tell you whether those hours are distributed well. This report tracks logged hours and billable amounts by client and project from a monthly perspective. When hours climb but the billable amount stays flat, it signals scope creep or rate miscalculations. Power BI accounting reporting dashboards that include time data make these gaps visible before they compound.
Aggregate team data hides individual patterns. The calendar view shows each team member's daily logged hours across the month. Someone averaging five hours on a 40-hour contract stands out immediately. So does someone consistently logging nine-plus hours, signaling burnout risk. Having this view inside your Power BI accounting dashboard templates means you catch staffing issues during the month, not after it closes.
What insights you can get with the accounting dashboard for Power BI
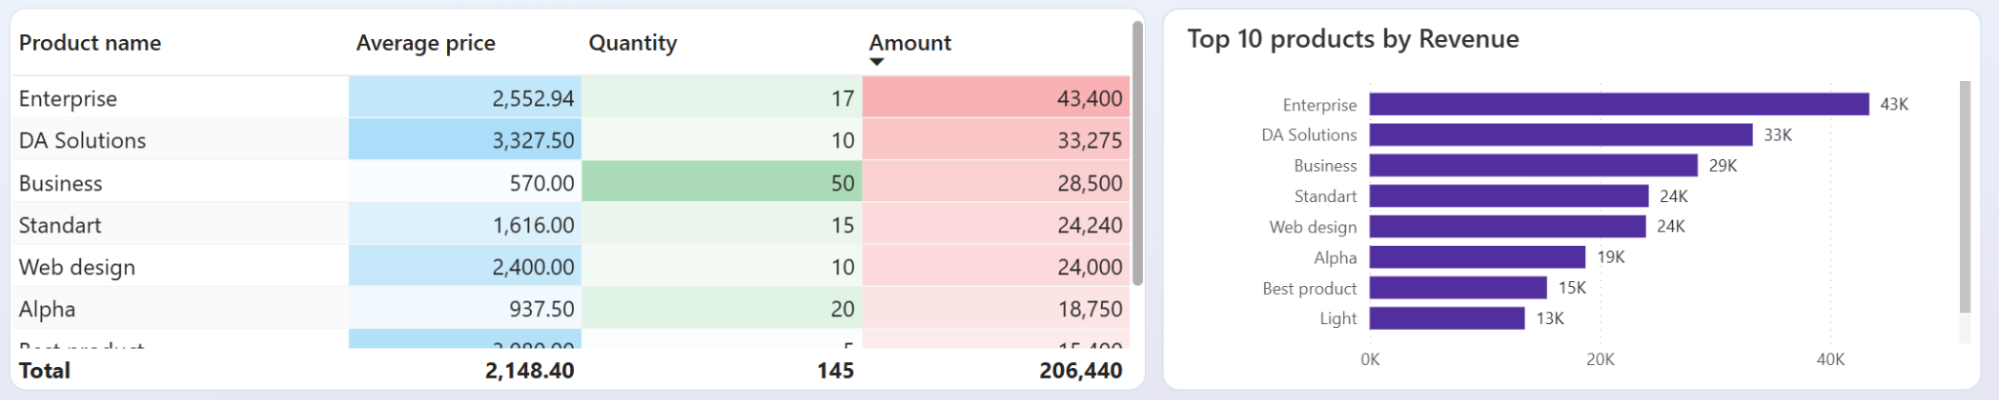
Compare product-level revenue in the product overview to spot items generating volume but not profit. If your top-selling product sits at the bottom of the revenue-per-unit ranking, your pricing may need revisiting. Sort by contribution to see whether your margin depends on a few high-performers or spreads evenly.
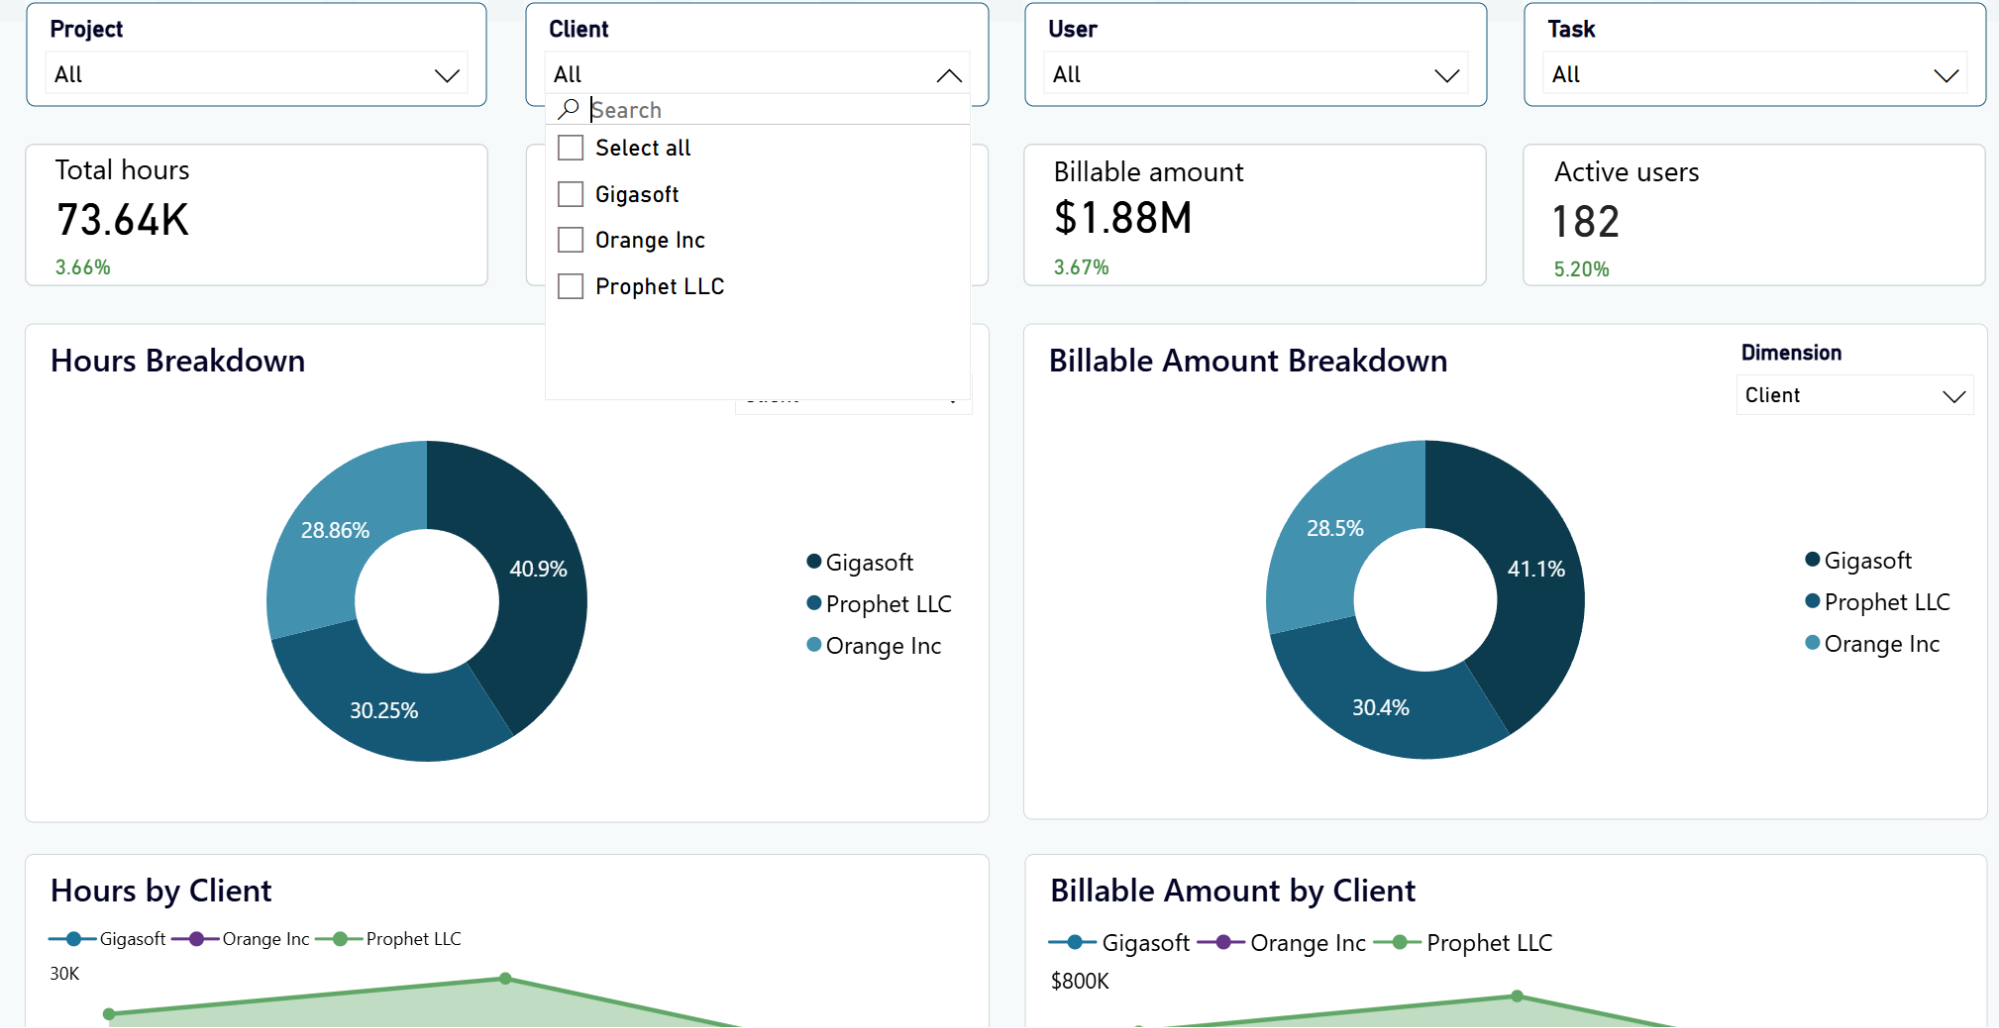
Filter by a specific client or project to compare logged hours per team member. If one person carries 60% of the hours on a project scoped for three, workload rebalancing is overdue. The monthly dynamics chart shows whether this imbalance is a recent spike or a persistent pattern.
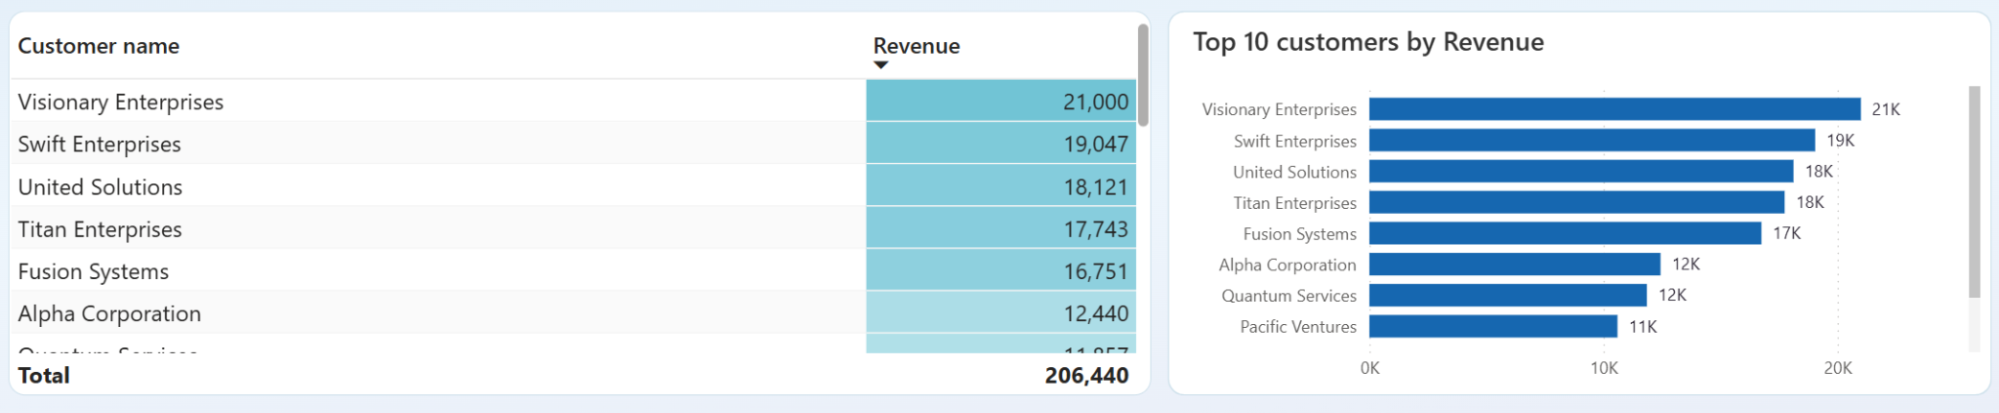
Check the customer overview and top 10 ranking to see how much of your income depends on a handful of accounts. When three clients represent over half your revenue, losing one creates an immediate cash gap. Reviewing this distribution monthly helps you set diversification targets.
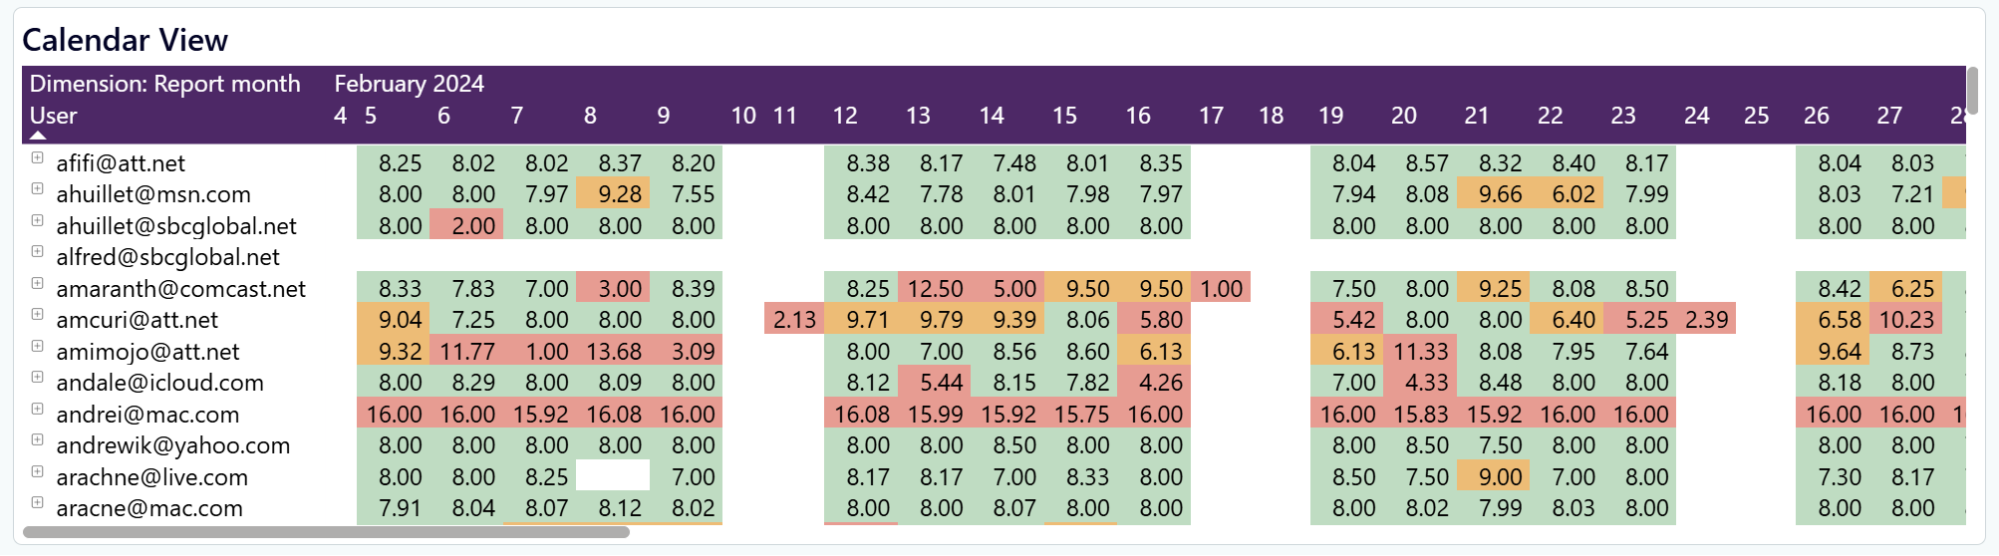
Scan the calendar view for anomalies like 47 hours logged on a single Monday or someone dropping to two hours every Friday. These outliers often point to data entry mistakes rather than actual work patterns. Correcting them before the month-end prevents billing errors.
How to create an accounting dashboard?

Metrics you can track with a Power BI accounting dashboard template
Revenue minus all expenses for the selected period. When this number trends downward while revenue stays flat, the problem is on the cost side. The profit and loss overview shows net income across three time windows, so you can tell whether a decline is recent or months in the making.
The sum of all income recorded in your accounting platform for the period. Tracking it monthly reveals seasonal patterns that annual totals obscure. A services business might see a January dip every year but never notice it until 12 months of data sit on one chart.
Each customer's share of total income, ranked from highest to lowest. This metric answers a question most businesses avoid: how much damage would losing your biggest client actually do? The customer overview makes concentration risk visible at a glance.
Income broken down by product or service line. Useful for spotting items that sell in high volume but contribute little profit. It also highlights products with declining revenue that may need promotion or retirement.
Total hours logged by all team members across all projects during the period. Comparing this number to the previous month reveals whether your team's capacity is growing, shrinking, or being redistributed to different work.
The dollar value of billable work logged in your time-tracking tool. When tracked hours increase but the billable amount stays flat, your team is spending more time on non-billable work. That gap between effort and revenue is one of the first things a Power BI accounting reporting dashboard should surface.
Hours specifically marked as billable. The ratio of billable to total hours is a proxy for utilization. A team running at 55% billable hours has room to take on more client work without hiring. A team at 90% likely has no slack for internal projects or professional development.
The number of team members who logged time during the period. Pair this with tracked hours to calculate average hours per person. If the average drops while total hours stay steady, fewer people are carrying a heavier load.