Performance marketing dashboard examples and reporting templates
Revolutionize your marketing strategy with intelligent, automated performance marketing dashboards that transform complex advertising data into actionable insights. Consolidate metrics across multiple platforms, uncover hidden opportunities, and drive strategic decision-making with precision and speed.
Performance marketing dashboard examples for every need


 +2
+2


 +3
+3
 +3
+3


 +2
+2


 +4
+4


 +2
+2


about your case. It doesn't cost you a penny 😉
Choose your white label performance marketing dashboard to kick off
What is a performance marketing dashboard?
By leveraging automated data integration through Coupler.io, the dashboard transforms raw advertising data into meaningful insights. It tracks critical metrics in real-time, enabling marketers to make swift, informed decisions. From identifying high-performing campaigns to understanding audience engagement nuances, a performance marketing dashboard serves as your strategic command center for maximizing marketing effectiveness.

What reports should be included on a performance marketing dashboard?
Performance marketing requires a strategic approach to data analysis that goes beyond surface-level metrics. The most effective performance marketing dashboards integrate comprehensive reports that provide deep insights into campaign dynamics, audience behavior, and marketing efficiency. These reports transform raw data into a strategic narrative, enabling marketers to make informed decisions, optimize resource allocation, and drive meaningful business results across multiple advertising channels.
The campaign performance report is the cornerstone of strategic marketing analysis. It provides a comprehensive overview of advertising efforts across multiple platforms, tracking key metrics like impressions, clicks, conversion rates, and return on ad spend. This report goes beyond surface-level numbers, revealing the intricate relationships between different marketing channels and their collective impact on business objectives.
Budget allocation reports transform financial data into strategic insights. By visualizing spending patterns, cost-per-acquisition, and performance metrics across platforms, marketers can make data-driven decisions about resource distribution. This report highlights which channels deliver the most value, enabling precise budget optimization and minimizing wasteful expenditure.
The audience engagement report delves deep into demographic and behavioral insights. It tracks user interactions across platforms, revealing detailed patterns about audience preferences, engagement levels, and conversion potential. This granular understanding allows marketers to refine targeting strategies, create more personalized campaigns, and improve overall marketing efficiency.
The cross-channel attribution report provides a holistic view of how different marketing touchpoints contribute to final conversions. By mapping the customer journey across multiple platforms and identifying the most influential channels, this report helps marketers understand the complex interactions between various marketing efforts. It reveals which combinations of channels and tactics drive the most valuable outcomes, enabling more sophisticated and nuanced marketing strategies that optimize the entire conversion path.
What insights you can get with the performance marketing dashboard
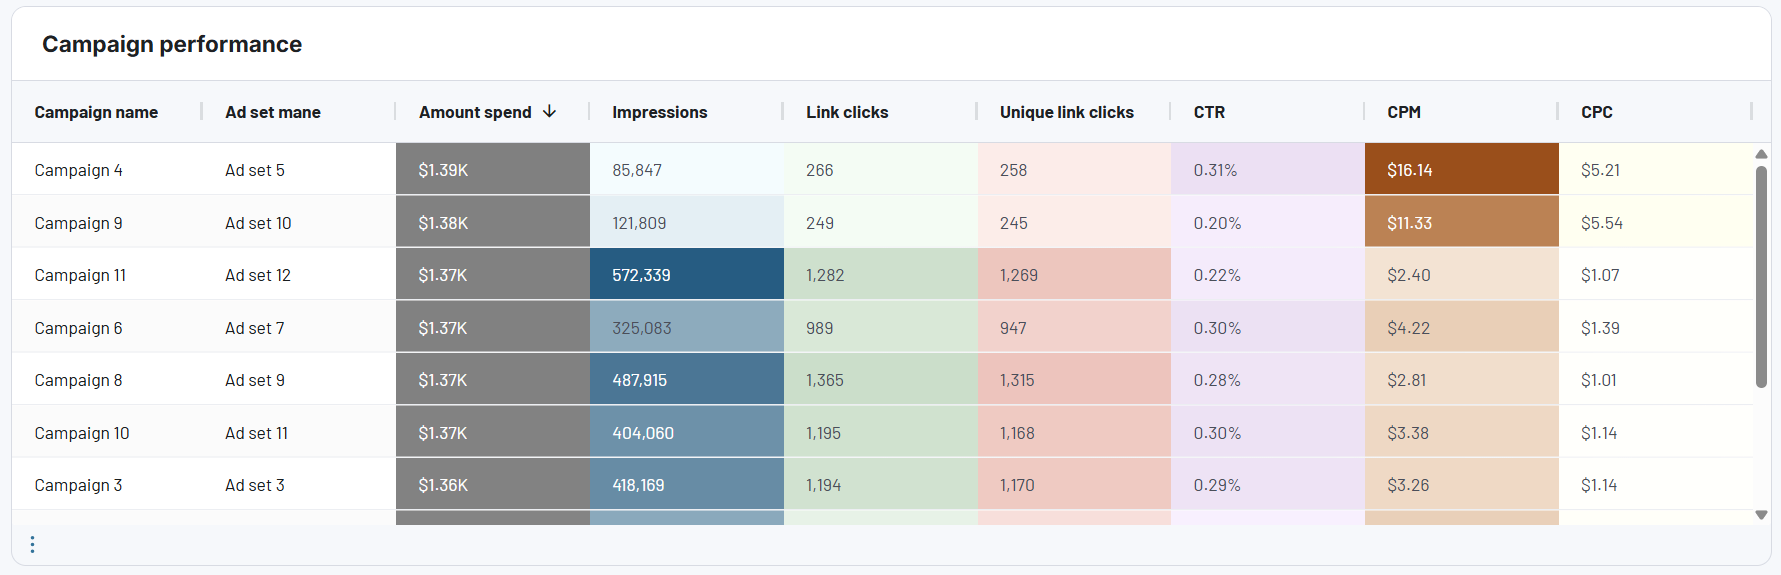
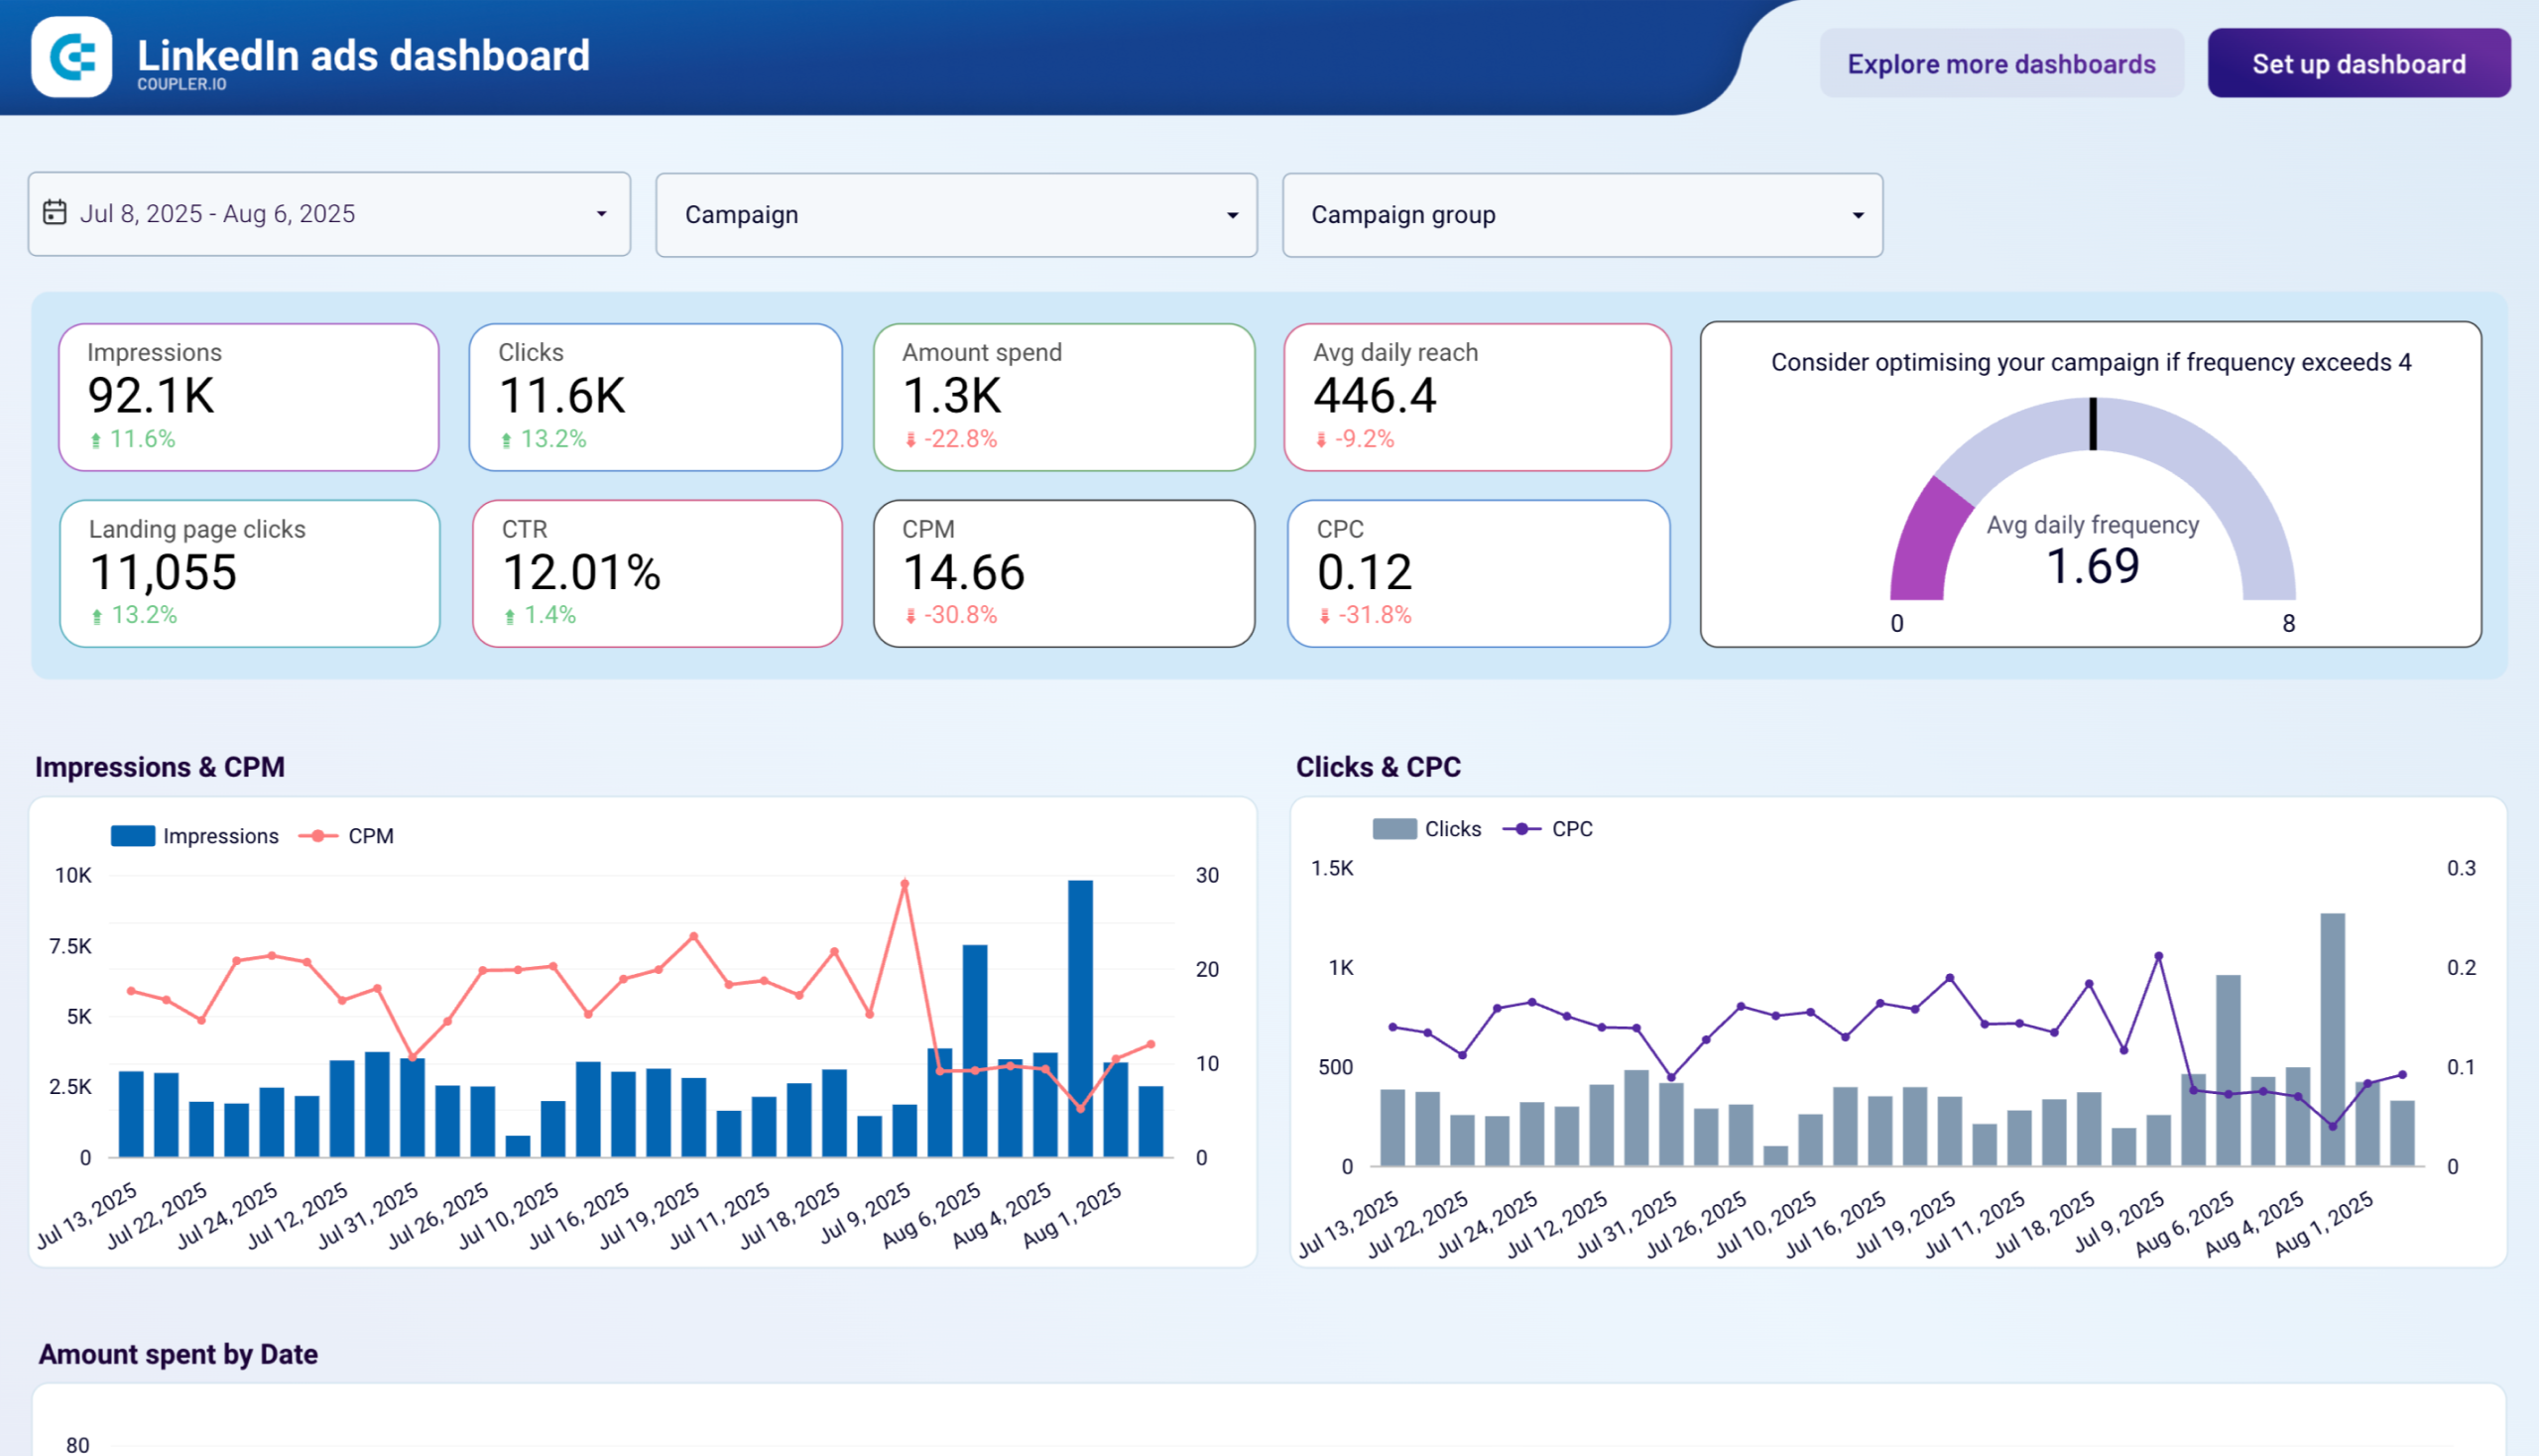
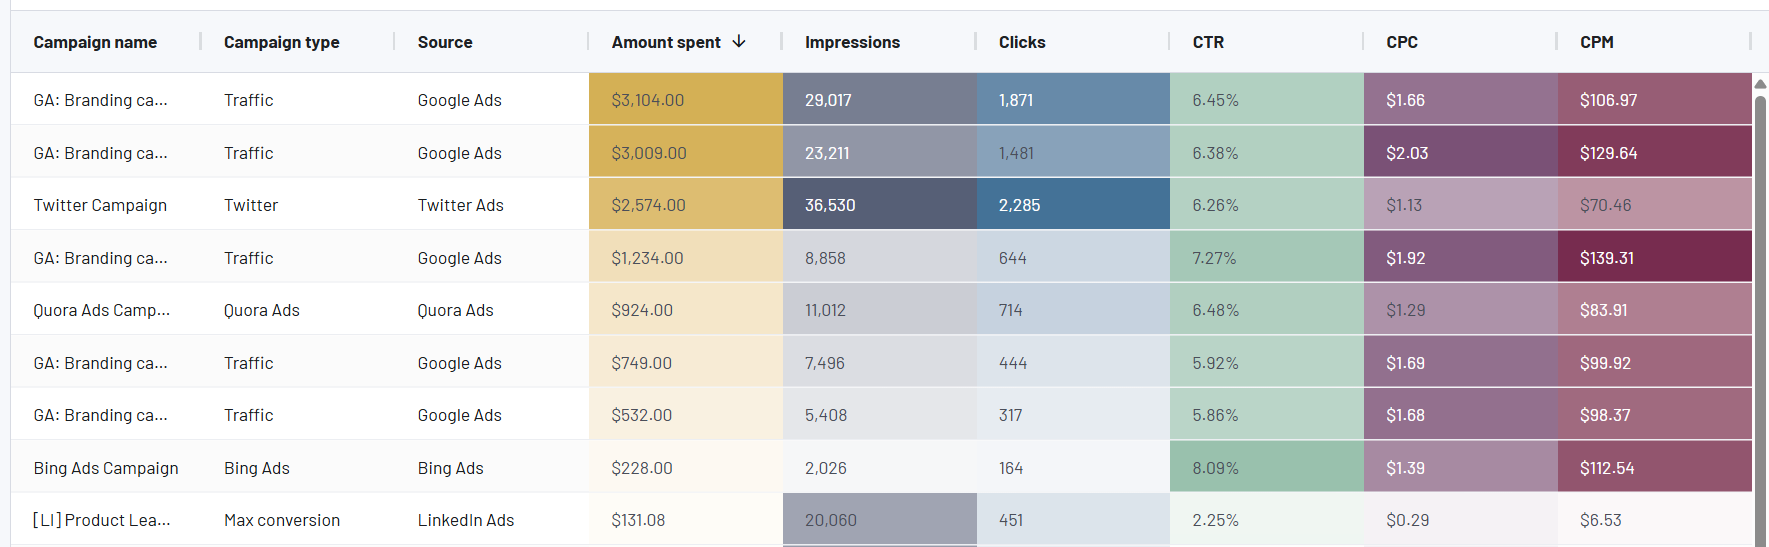
Uncover the true potential of your marketing efforts by comparing performance metrics across different advertising platforms. Track key metrics like impressions, clicks, CTR, and CPC across multiple channels. Identify the most and least effective campaigns, ad creatives, and marketing channels to optimize your strategy.
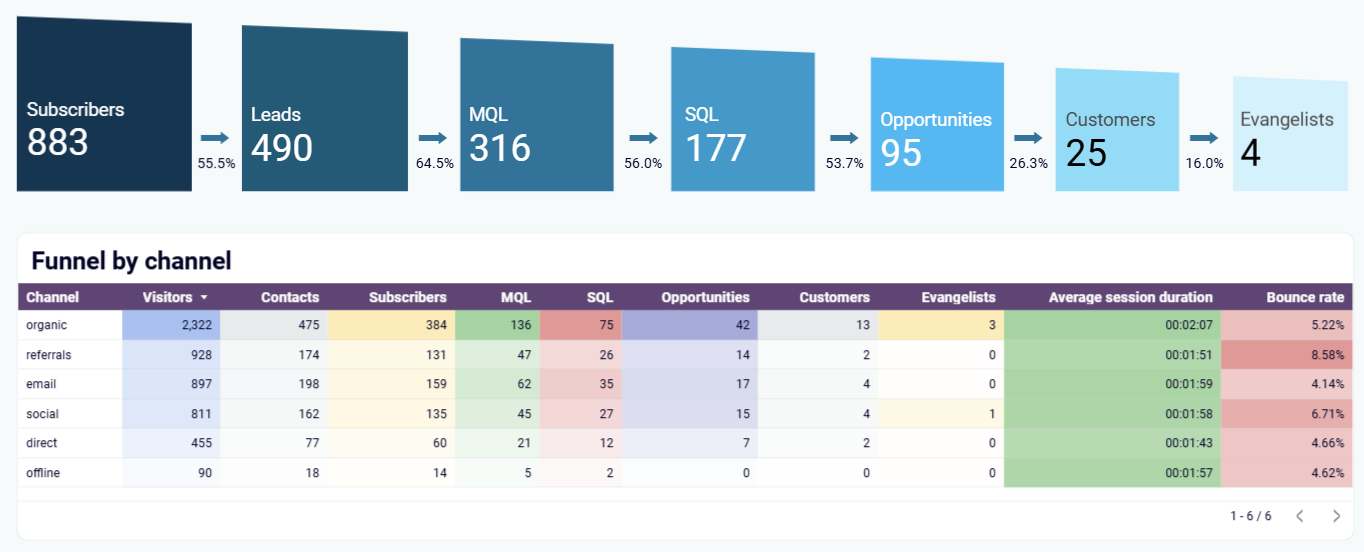
Monitor the user journey from ad impressions to final conversions with precision. Analyze conversion rates at each funnel stage, identifying drop-off points and optimizing the path to purchase. Understand how different marketing channels contribute to your overall conversion process.
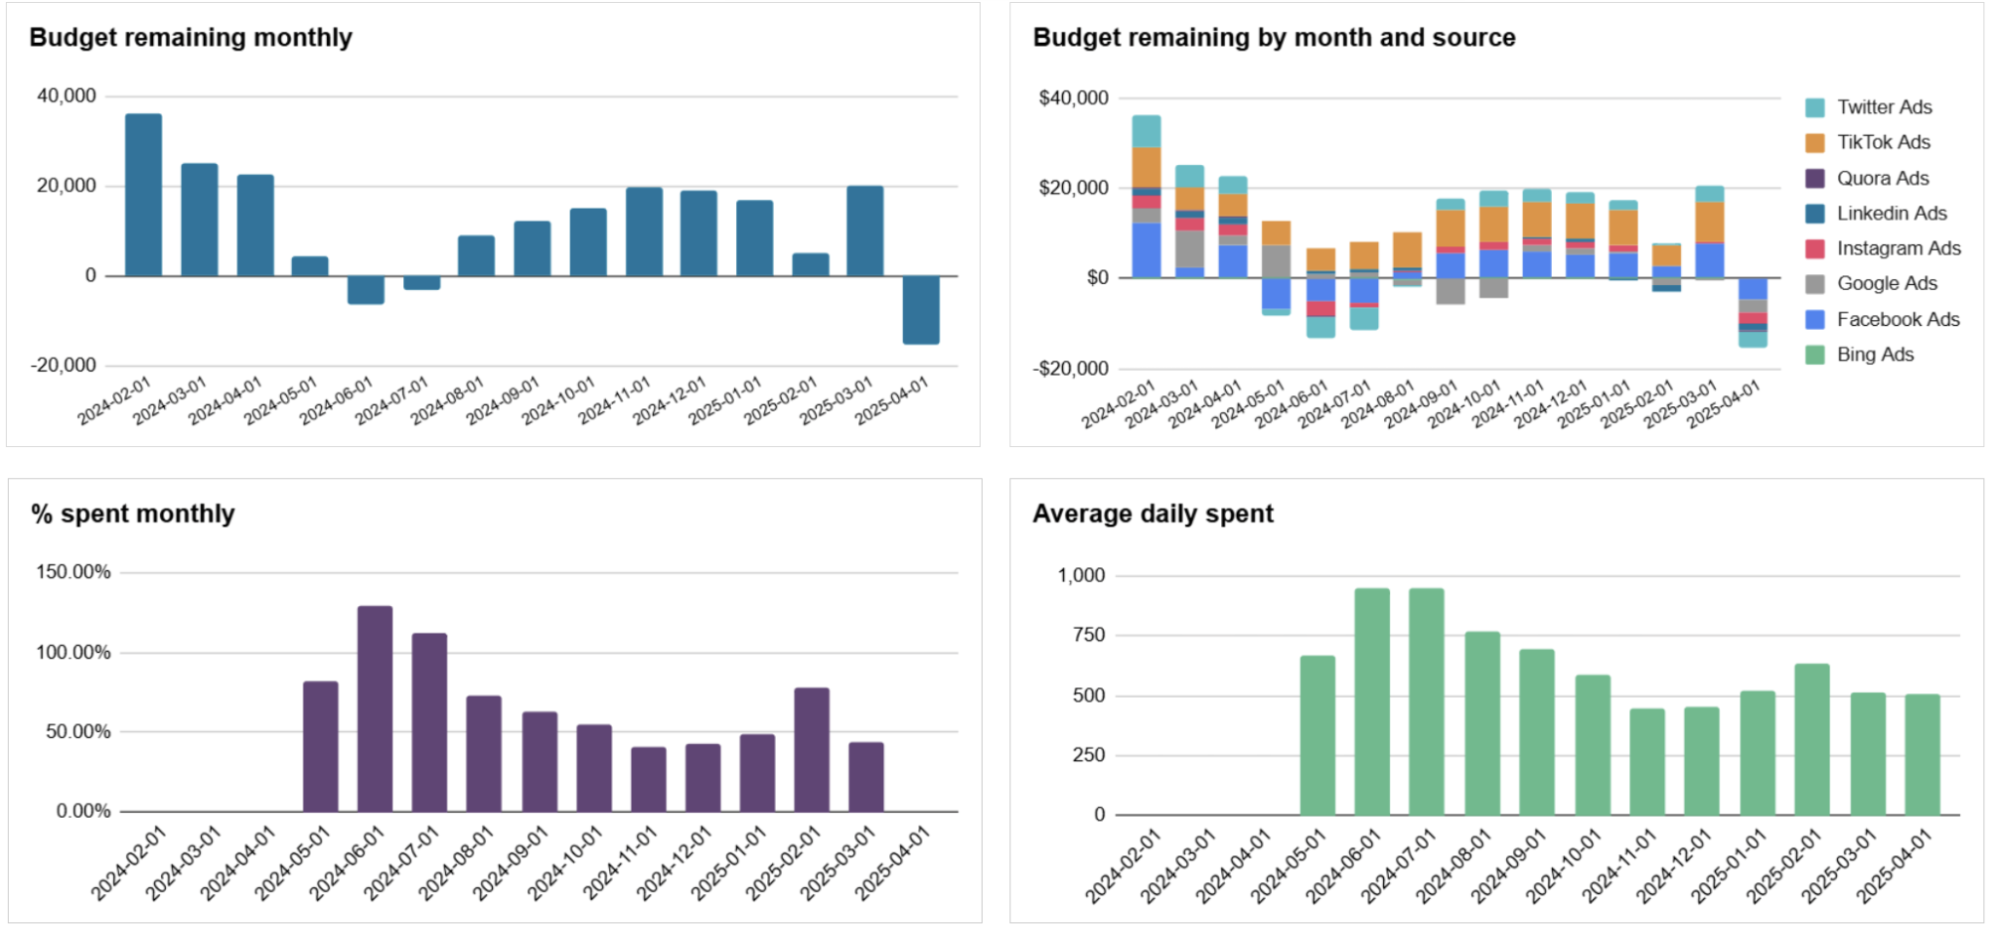
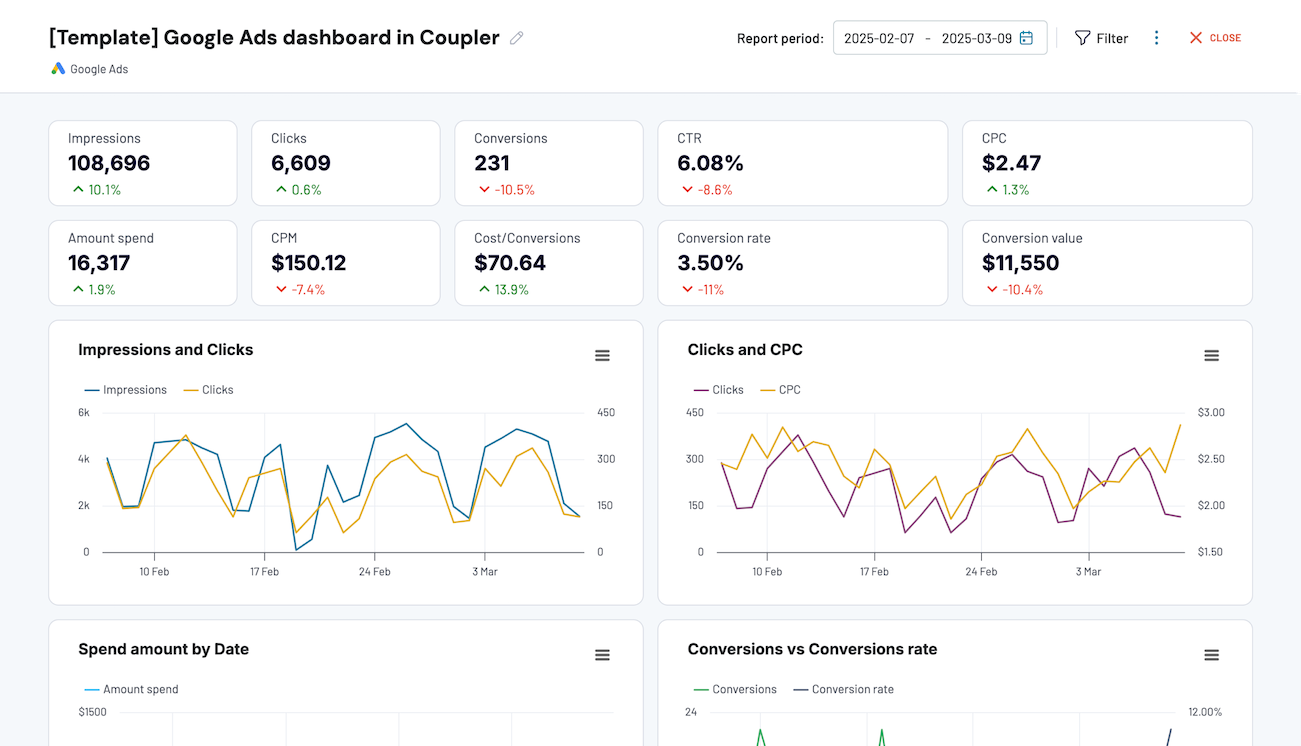
Transform your advertising budget management with detailed spend tracking and predictive analytics. Compare cost efficiency across different marketing channels, forecast future ad performance, and make data-driven decisions about resource allocation.
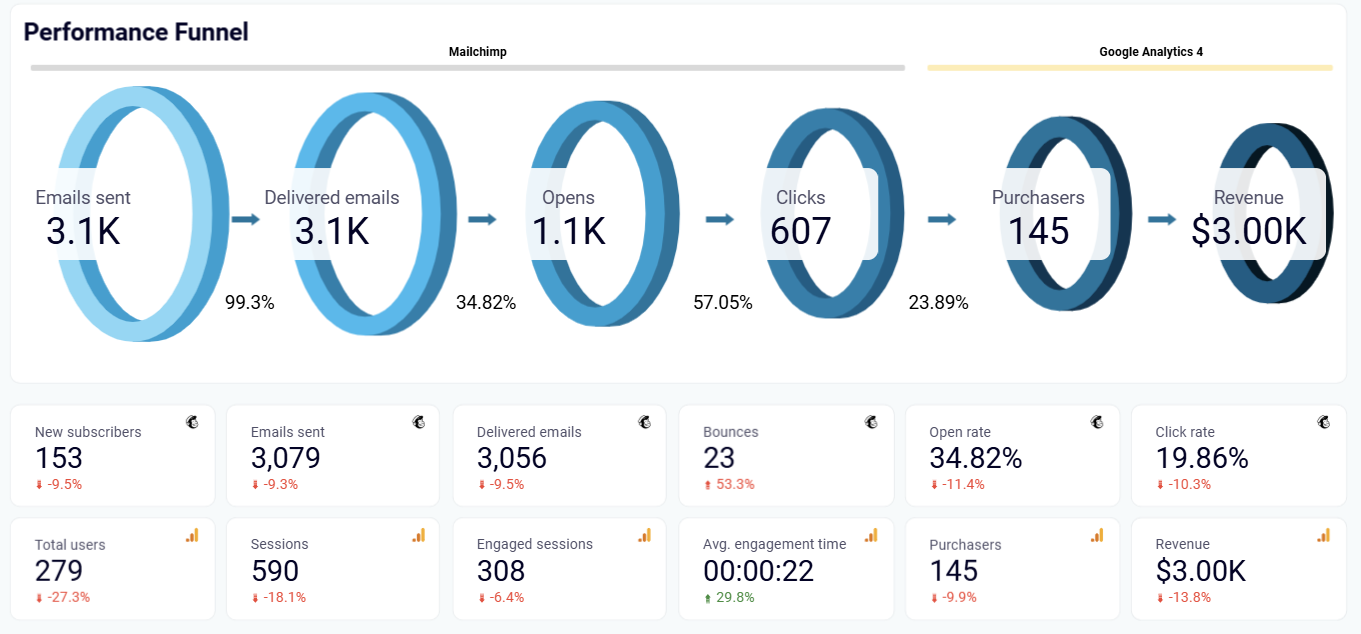
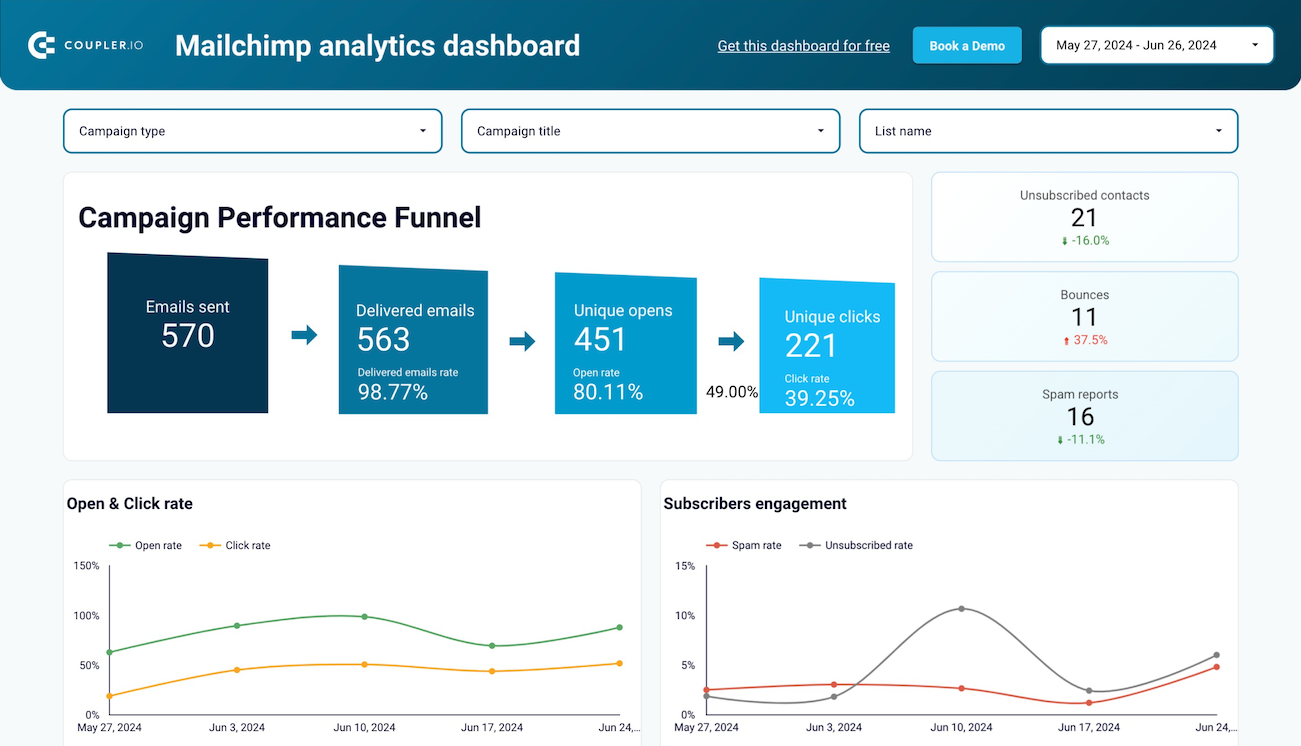
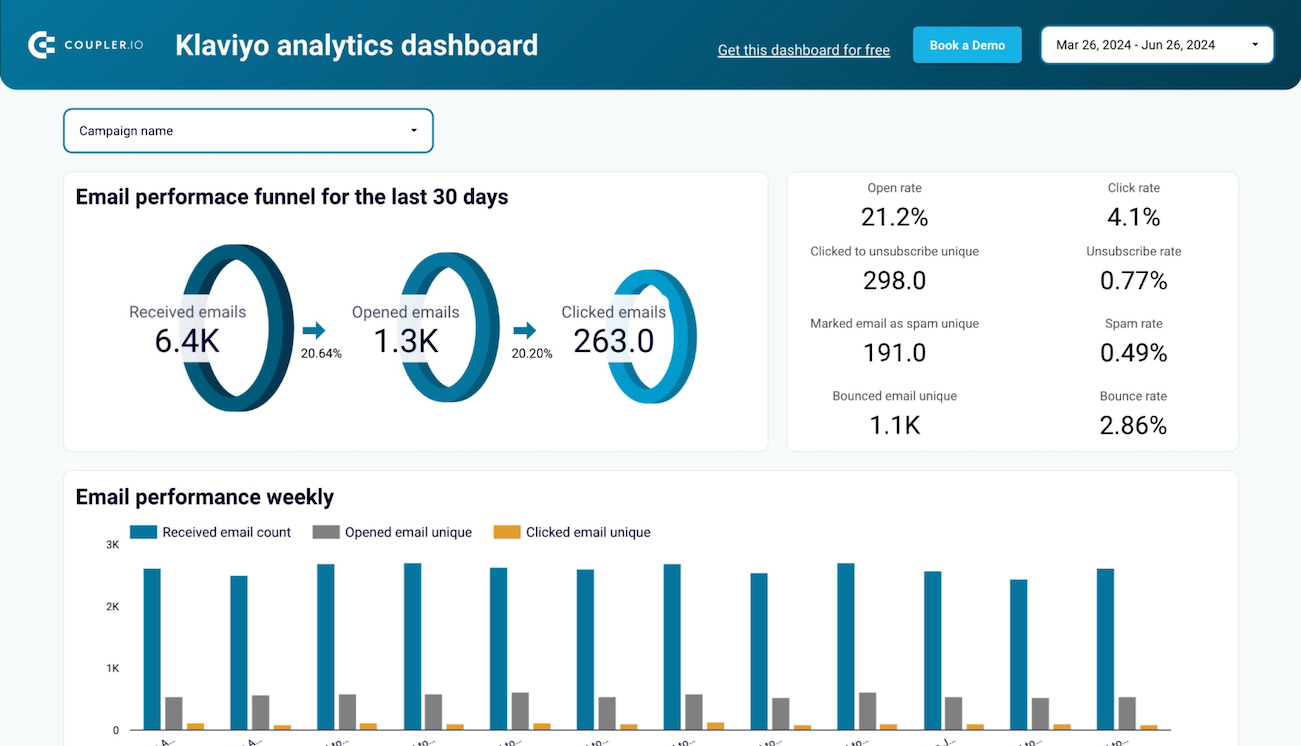
Track the complete journey of email marketing efforts, from sent emails to final conversions. Correlate email campaign performance with overall marketing objectives, identifying high-performing content, optimal sending times, and audience engagement patterns.
Gain a comprehensive view of your marketing efforts by comparing performance metrics across different advertising platforms. Understand which channels drive the most value, identify the most effective marketing strategies, and optimize your cross-platform approach.
How to create a performance marketing dashboard?

Metrics you can track with a performance marketing dashboard template
Measure the total number of desired actions completed by users across your marketing channels. This critical metric tracks how effectively your advertising efforts translate into tangible business outcomes, whether it's sales, sign-ups, downloads, or other key business goals. By analyzing conversions, you can understand which marketing strategies truly drive meaningful user actions.
Calculate the precise financial investment required to generate a single click across your marketing campaigns. This metric provides crucial insights into the efficiency of your advertising spend, helping you understand the economic value of each user interaction. Lower CPC indicates more cost-effective marketing strategies, enabling you to optimize your budget allocation and maximize marketing performance.
Evaluate the effectiveness of your marketing messages by measuring the percentage of impressions that result in actual clicks. This metric reveals how well your ad copy, creative design, and targeting resonate with your target audience. A high CTR suggests that your marketing content is compelling and relevant, while a low CTR indicates a need for strategic refinement.
Track the percentage of users who complete a desired action after clicking on your marketing content. This powerful metric goes beyond simple click tracking, demonstrating the true effectiveness of your marketing funnel. By analyzing conversion rates across different channels and campaigns, you can identify the most impactful marketing strategies and optimize your approach to drive more meaningful user actions.
Quantify the total number of times your marketing content is displayed to potential users across various platforms. This metric provides a fundamental understanding of your marketing reach, helping you assess the visibility and potential impact of your advertising efforts. By tracking impressions, you can evaluate the breadth of your marketing campaigns and identify opportunities to expand your audience.
Monitor the total financial investment across your marketing channels, providing a comprehensive view of your advertising expenditure. This metric is crucial for budget management, allowing you to track spending patterns, compare cost-effectiveness across different platforms, and ensure your marketing resources are allocated strategically. Understanding your total spend helps in making informed decisions about future marketing investments.
Directly measure the financial return produced by your marketing efforts, connecting your advertising activities to bottom-line business results. This metric transforms marketing from a cost center to a revenue driver, allowing you to quantify the true value of your marketing strategies. By tracking revenue generation across different channels and campaigns, you can identify the most lucrative marketing approaches.
Count the total number of user interactions with your marketing content, providing a fundamental measure of audience engagement. This metric offers insights into how compelling your marketing messages are and how effectively they attract user attention. By analyzing clicks across different platforms and campaigns, you can understand which marketing strategies are most successful in driving user interest and interaction.