Operational dashboard examples and reporting templates
Track daily business operations with automated operational dashboard templates that consolidate data from your CRM, accounting, inventory, and marketing platforms. Monitor sales pipeline health, inventory levels, cash flow, and customer acquisition performance to make faster operational decisions based on fresh data from HubSpot, Pipedrive, QuickBooks, Xero, Shopify, and WooCommerce.
Operational dashboard examples for every need










 +6
+6

















about your case. It doesn't cost you a penny 😉
Choose your white label operational dashboard template to kick off
What is an operational dashboard?
Unlike strategic dashboards focused on long-term goals, an operational dashboard tracks immediate business activities such as deal progression, stock levels, cash position, and customer acquisition costs. By automating data collection through Coupler.io, our operational dashboard templates eliminate manual reporting tasks and provide operations teams with instant visibility into sales pipeline bottlenecks, inventory shortages, payment obligations, and marketing funnel performance. The result is a centralized command center for managing daily operations and responding to issues before they impact revenue.

What reports should be included in operational dashboards?
Effective operational dashboards require specific reports that provide visibility into different aspects of daily business operations. Based on our analysis of successful operational performance dashboard implementations across CRM, e-commerce, financial, and marketing systems, we recommend incorporating these four report categories.
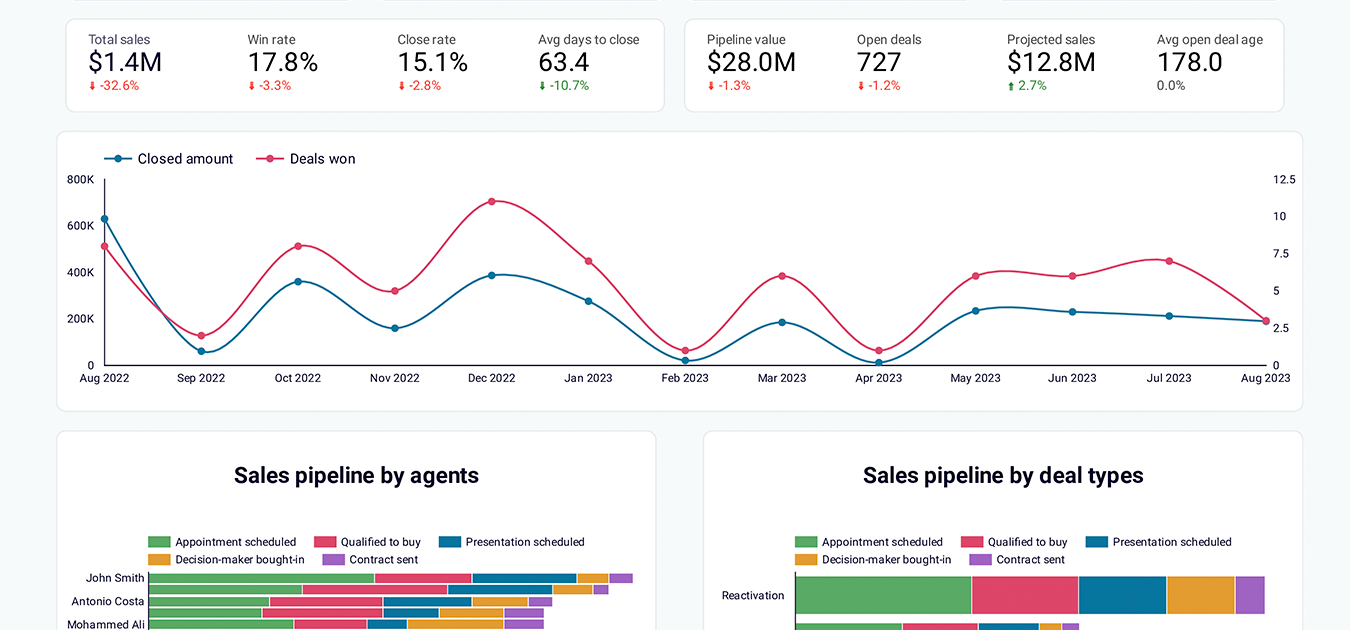
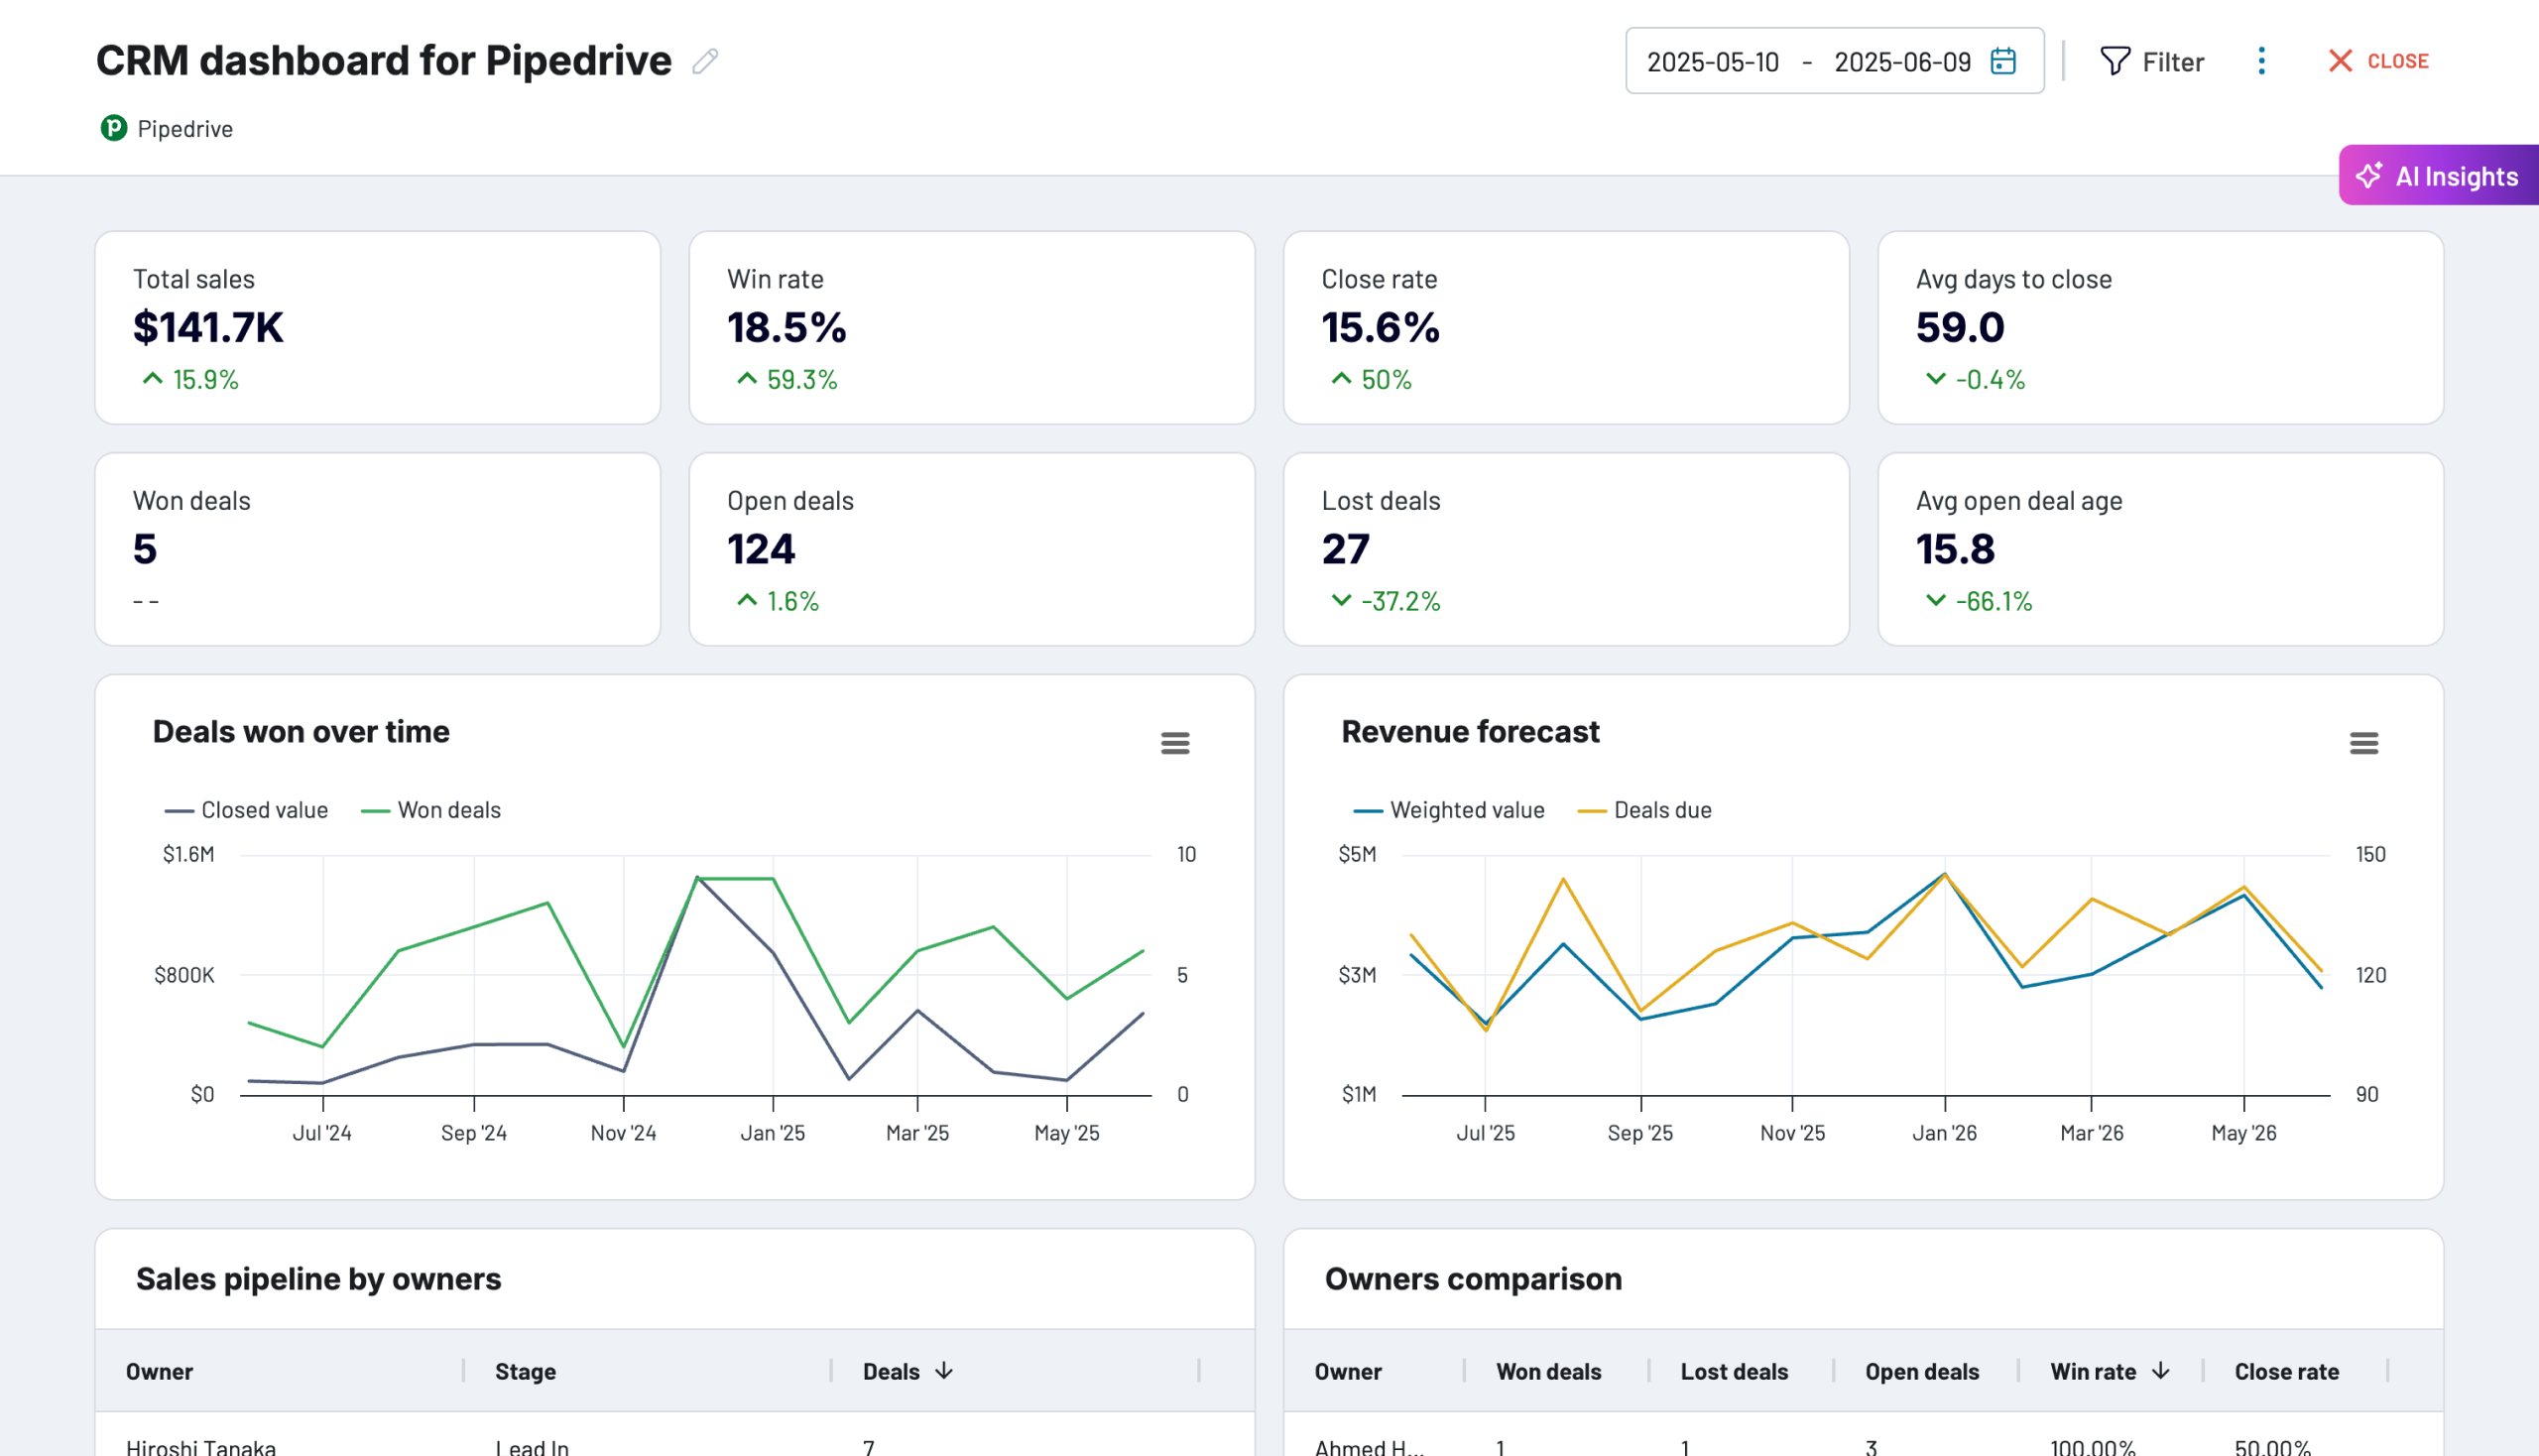
Pipeline operations reports track deals by owner, stage, revenue, and win probability to identify where negotiations stall. The operational KPI dashboard shows critical time thresholds for closing deals, helping managers intervene before opportunities become unrecoverable. Reports analyze best-won deals to understand successful closure patterns, include filtering by deal type and region, and compare team performance to identify coaching needs. This enables sales leaders to address bottlenecks proactively, redistribute high-priority deals, and recover stalled revenue.
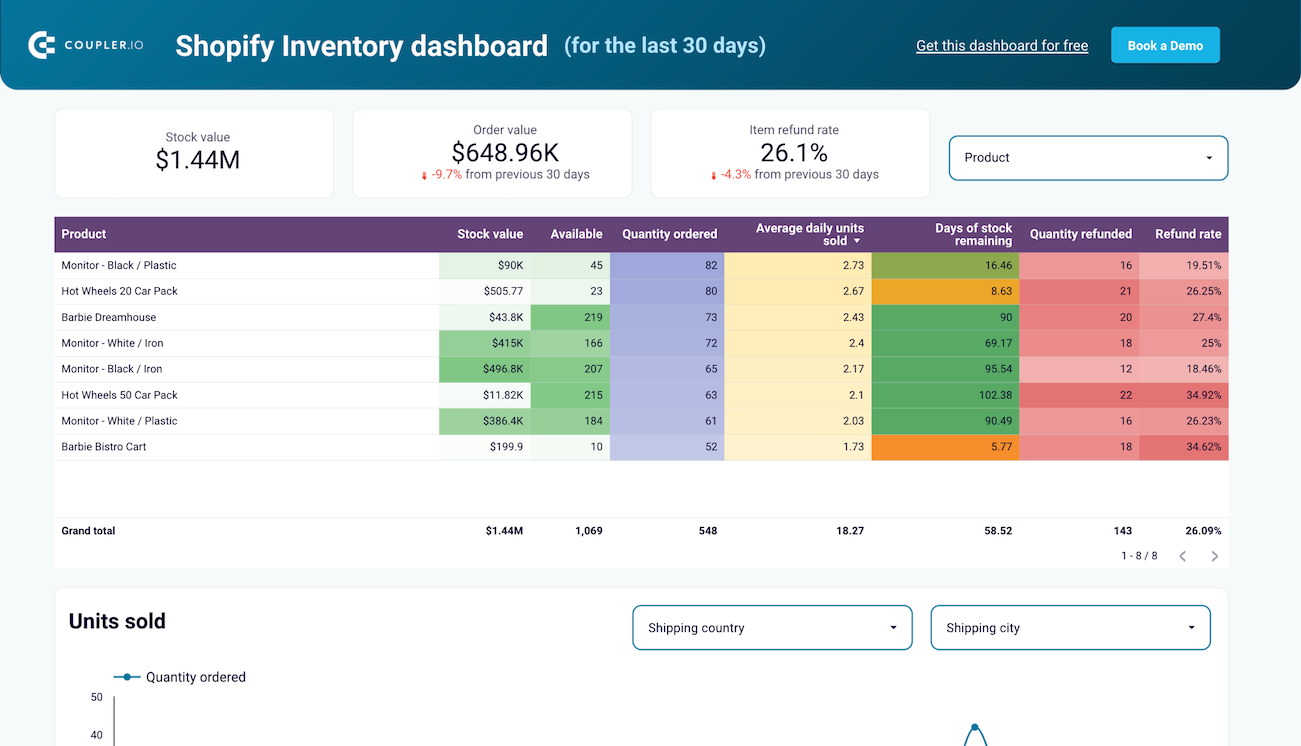
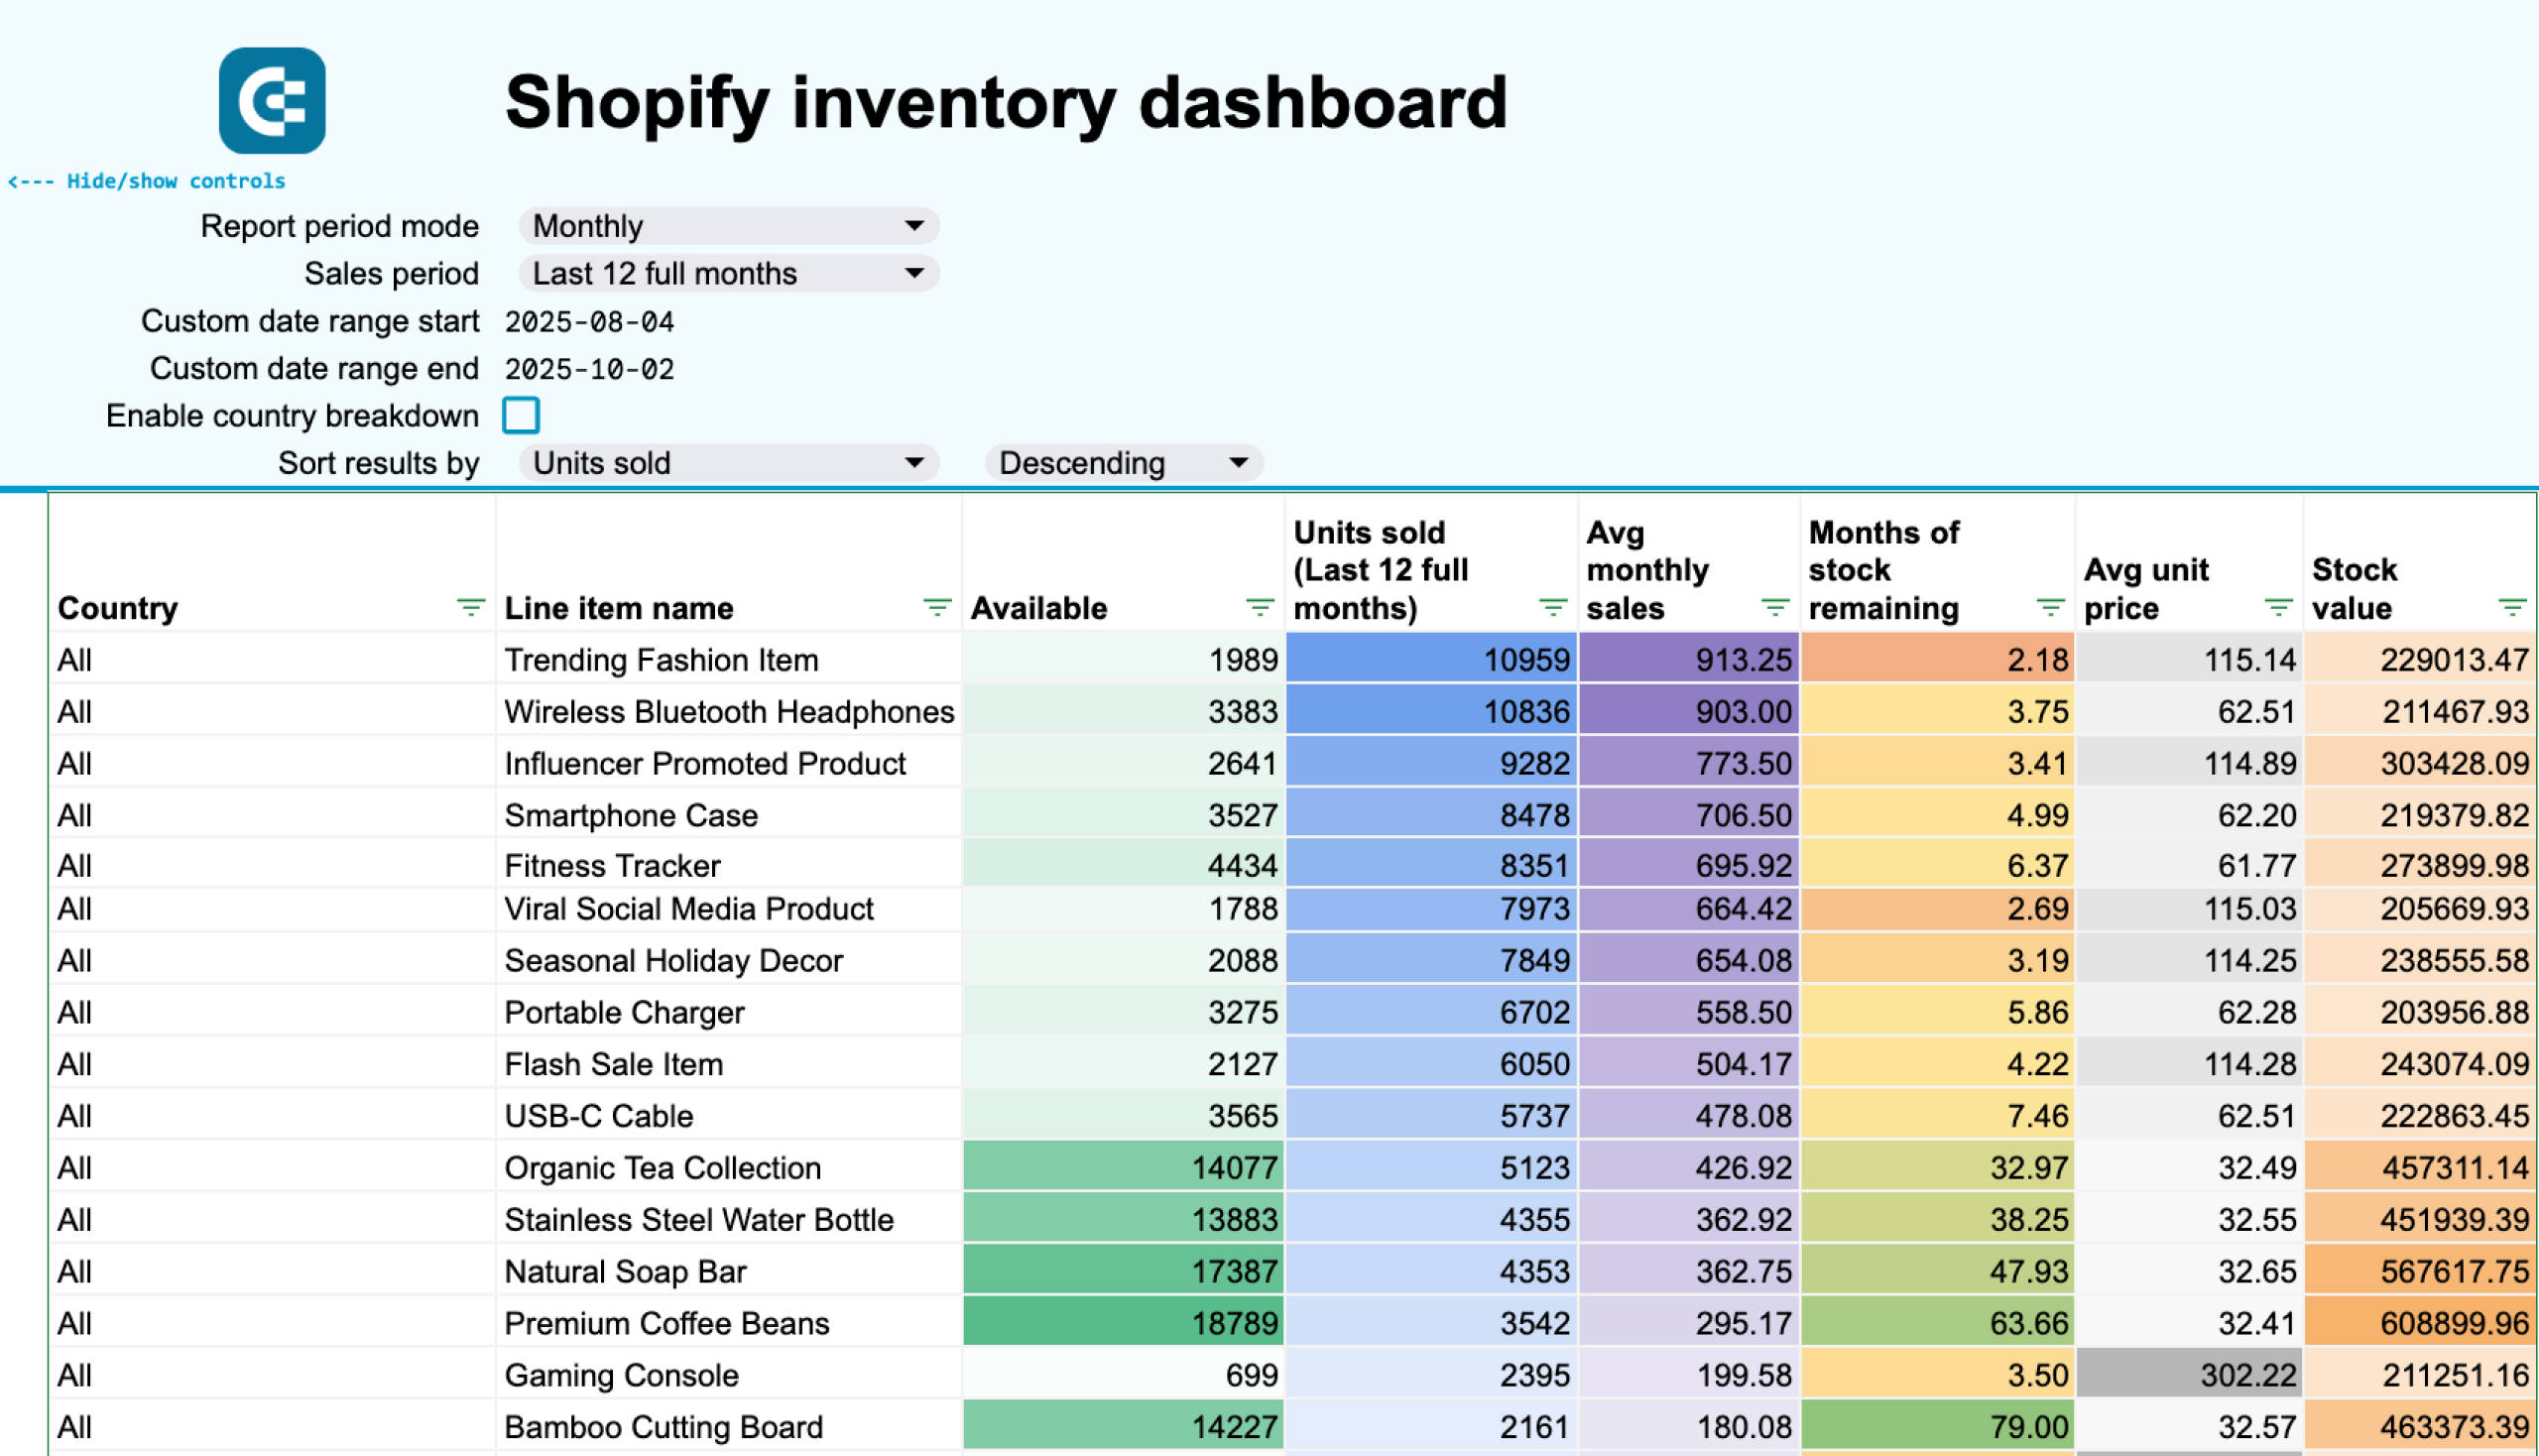
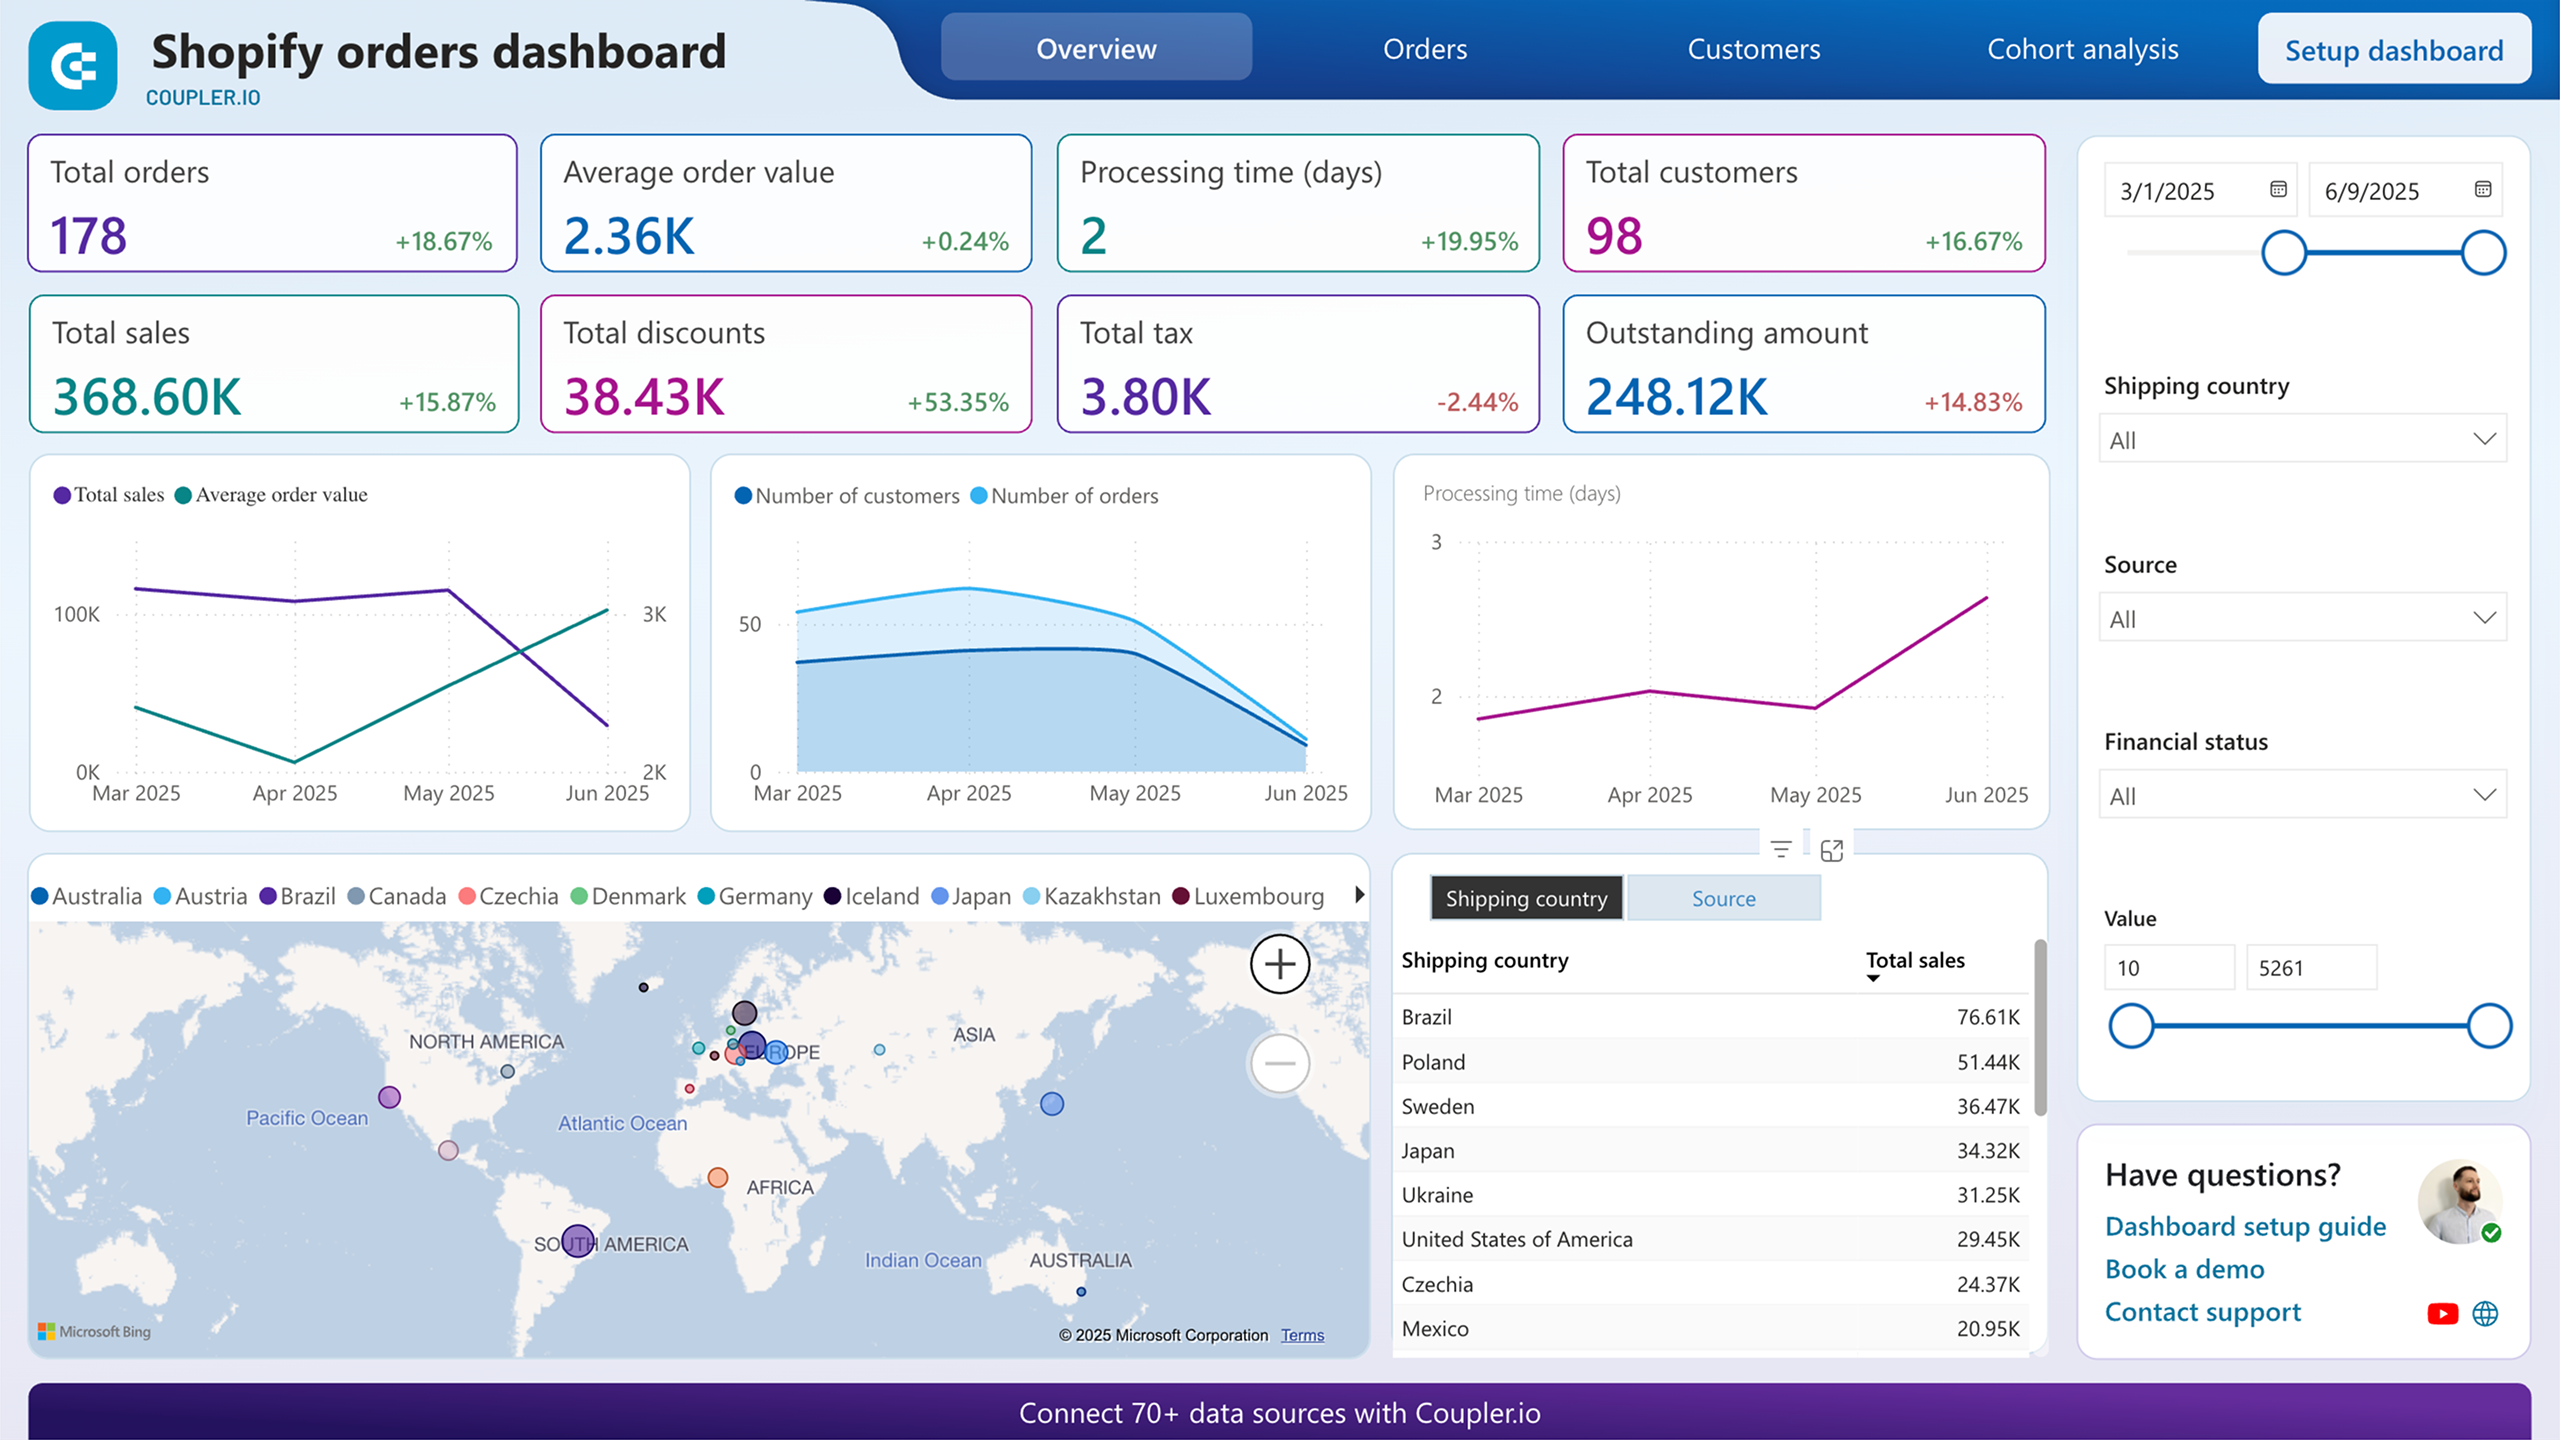
Inventory reports provide product-level visibility into stock availability, turnover rates, and procurement needs across all locations. The operational efficiency dashboard calculates "days of stock remaining" for each SKU, enabling store owners to predict shortages and optimize reordering timelines. Reports track daily sales patterns to evaluate promotion effectiveness, analyze return rates by geography to address region-specific issues, and compare stock levels across warehouses to prevent imbalances. This helps operations teams prevent revenue-losing stockouts, reduce excess inventory, and optimize fulfillment across locations.
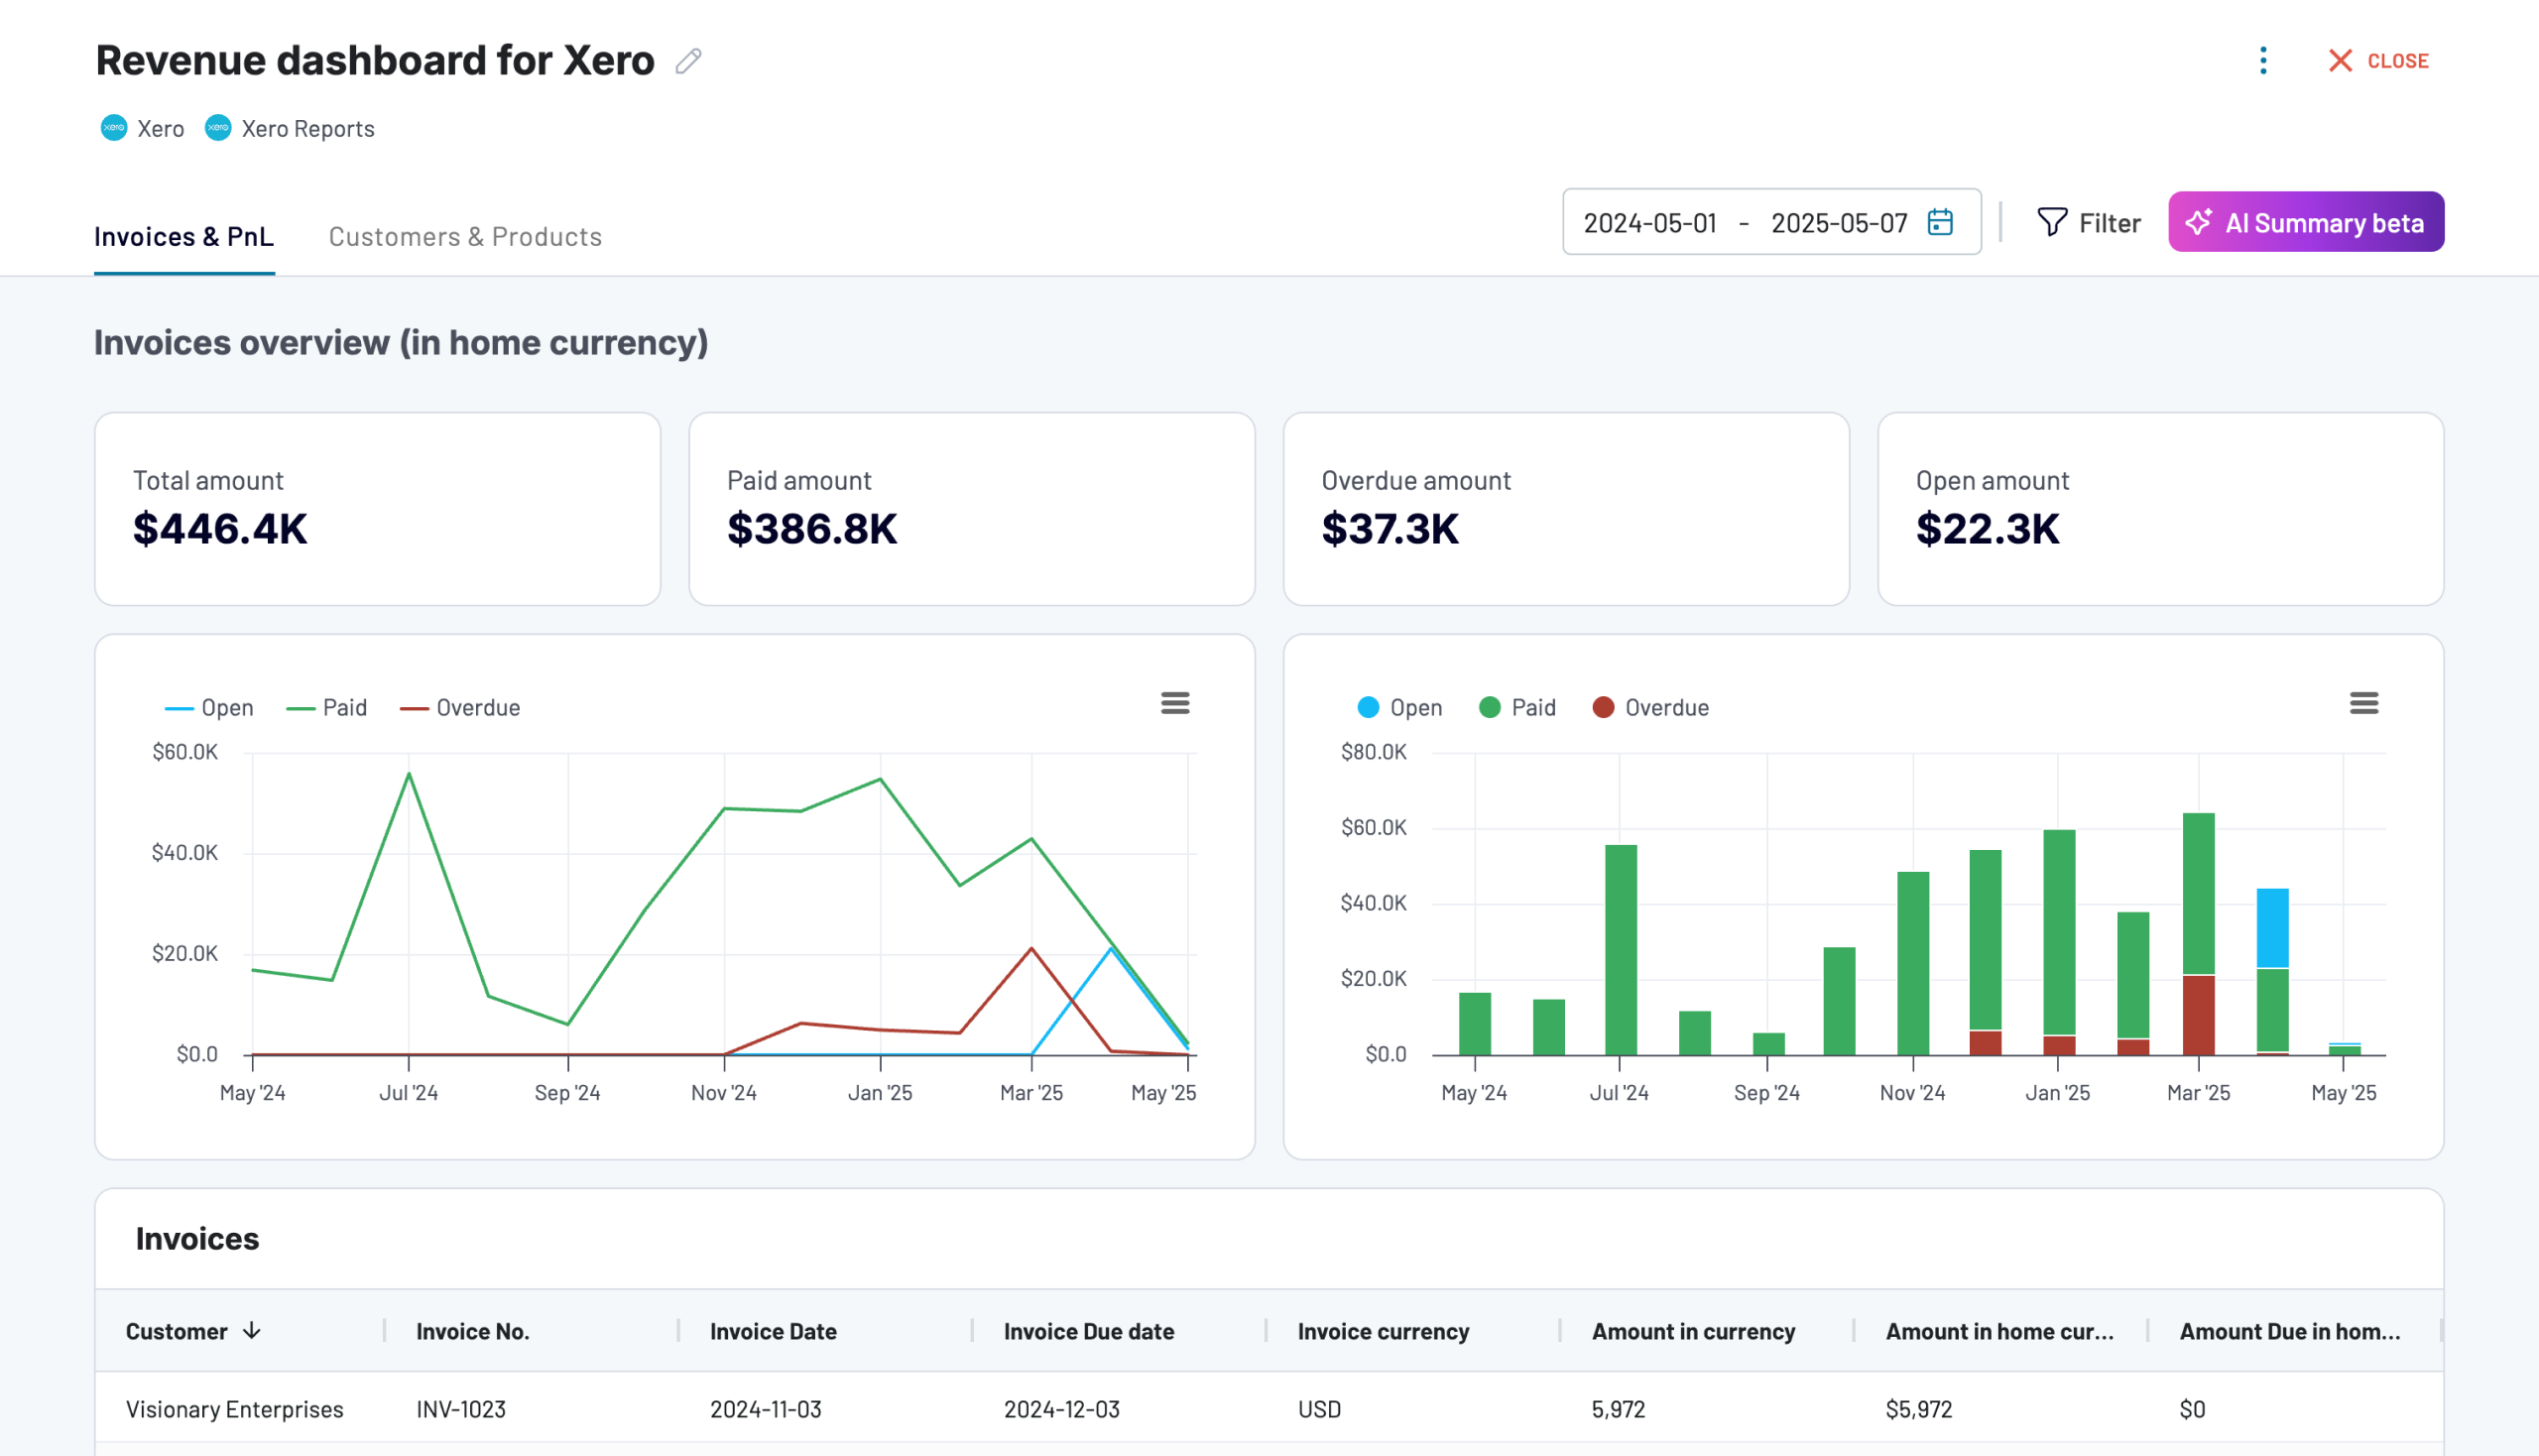
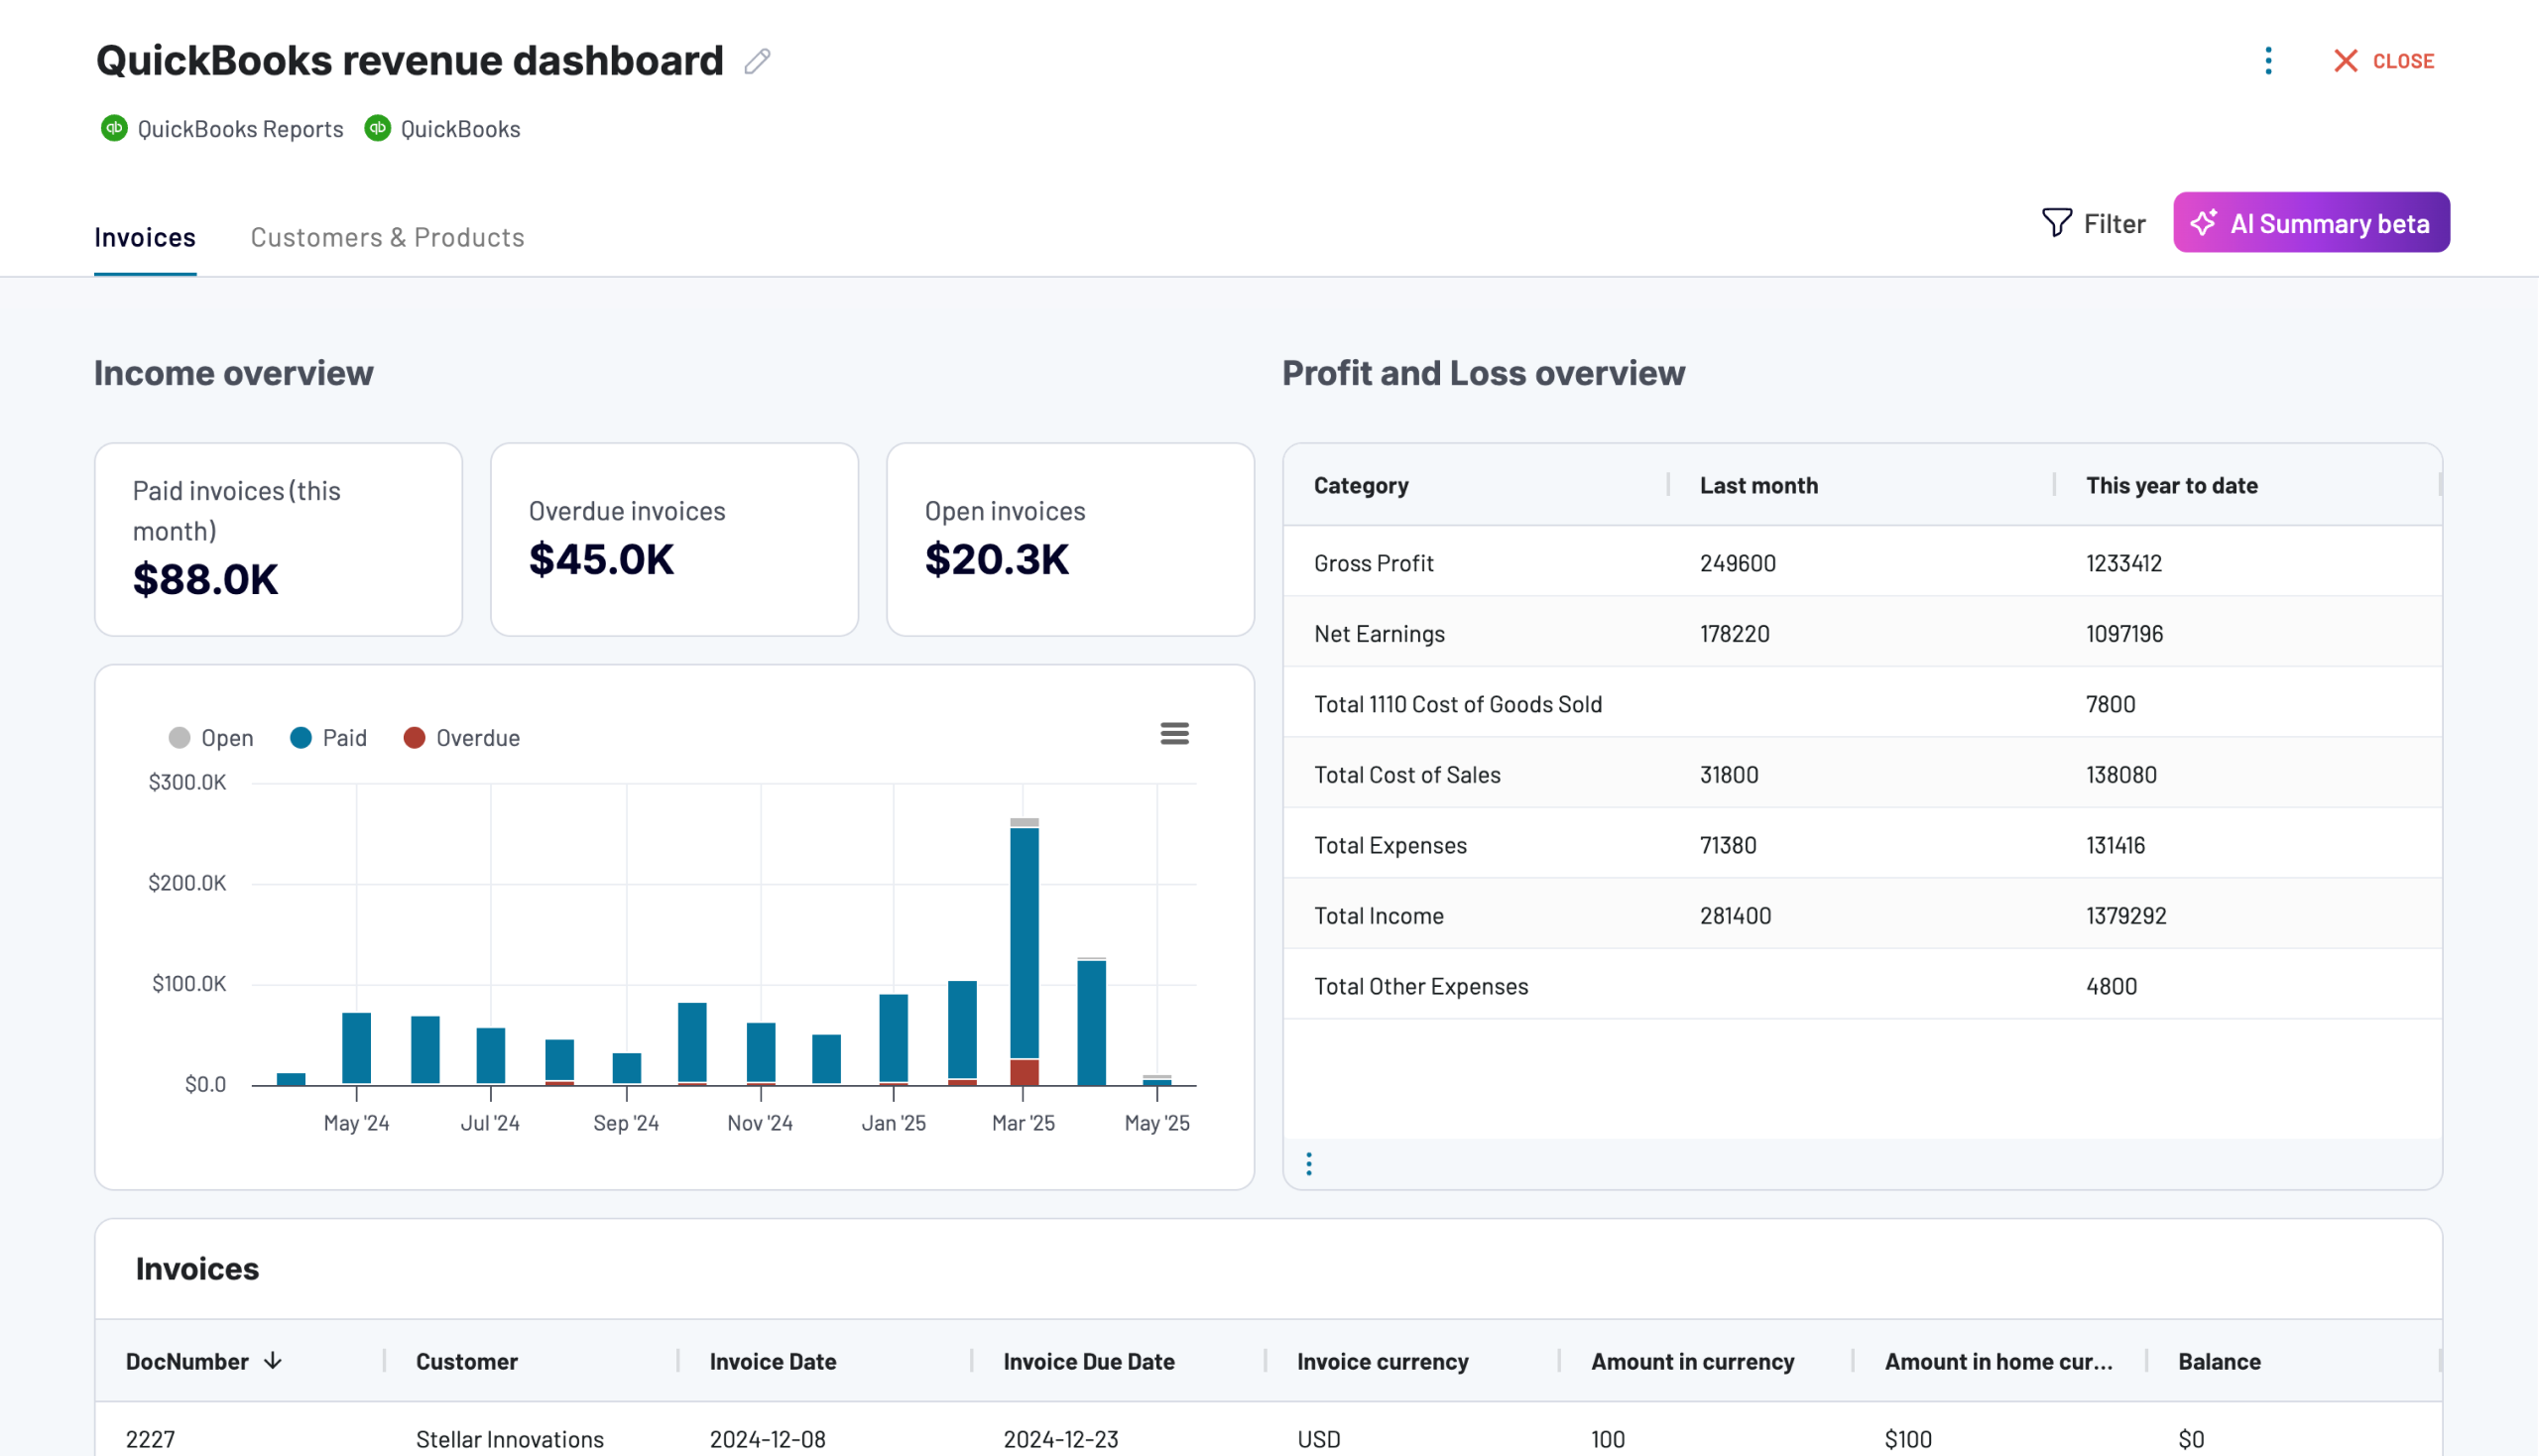
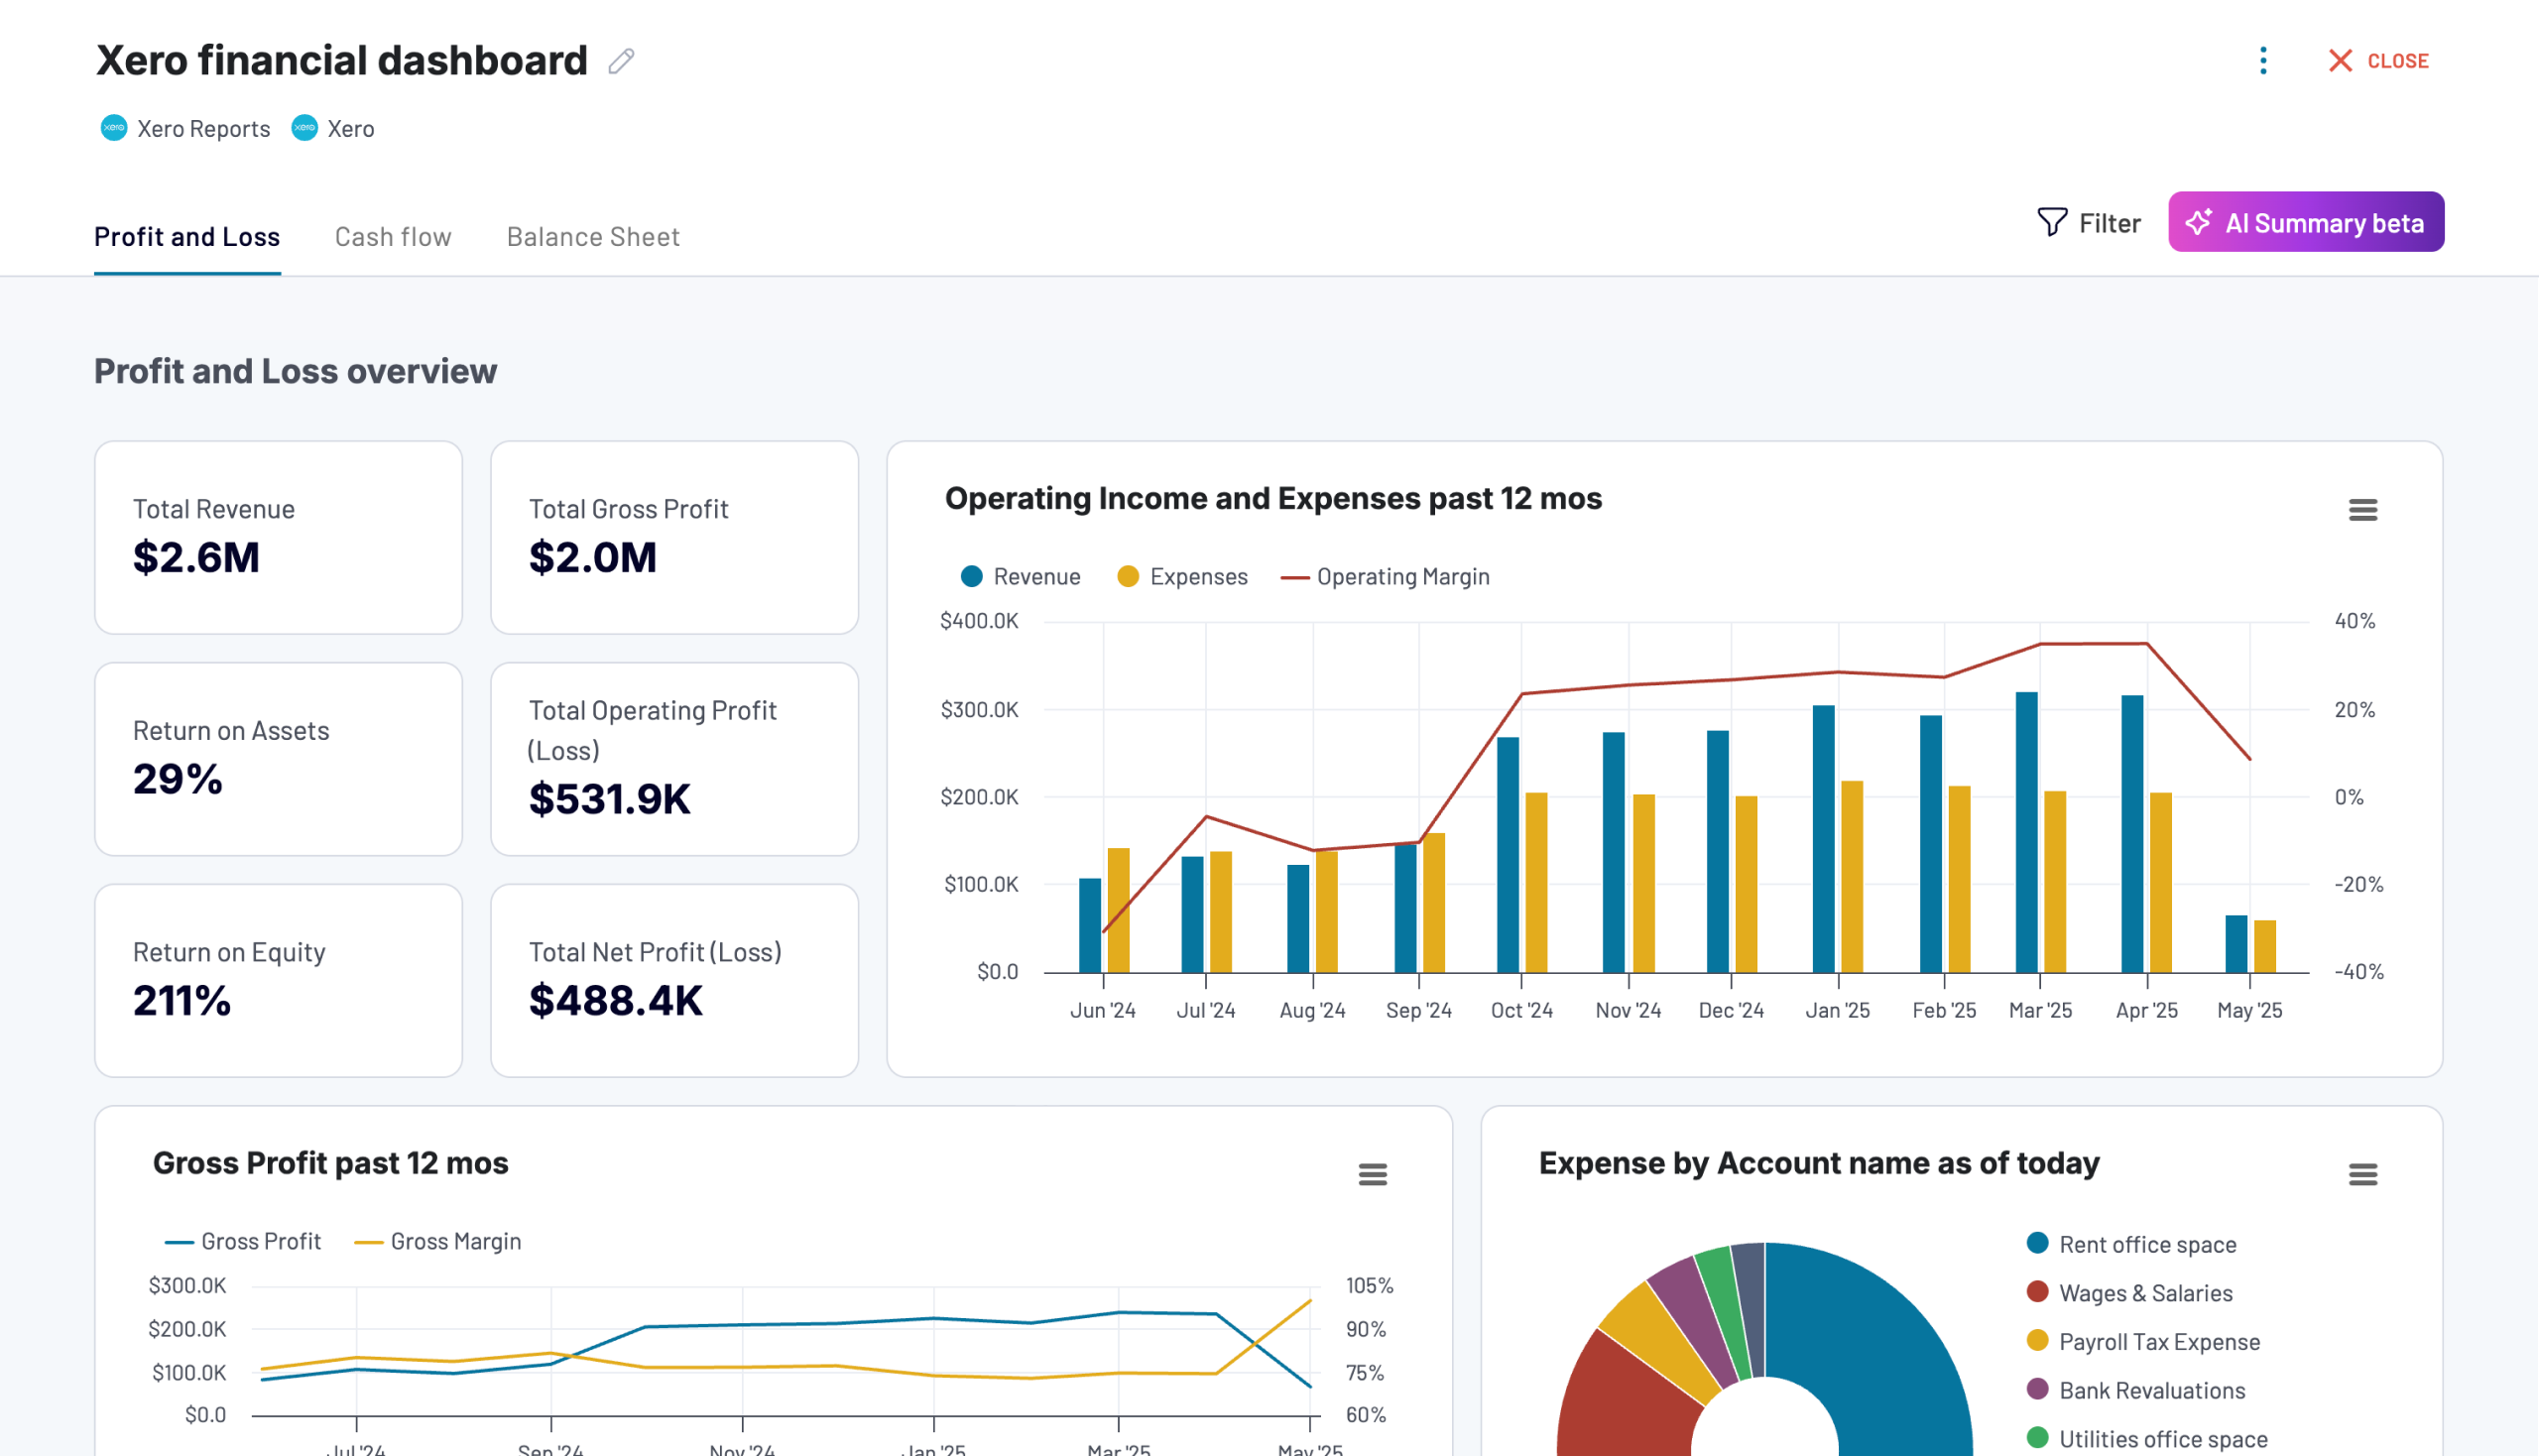
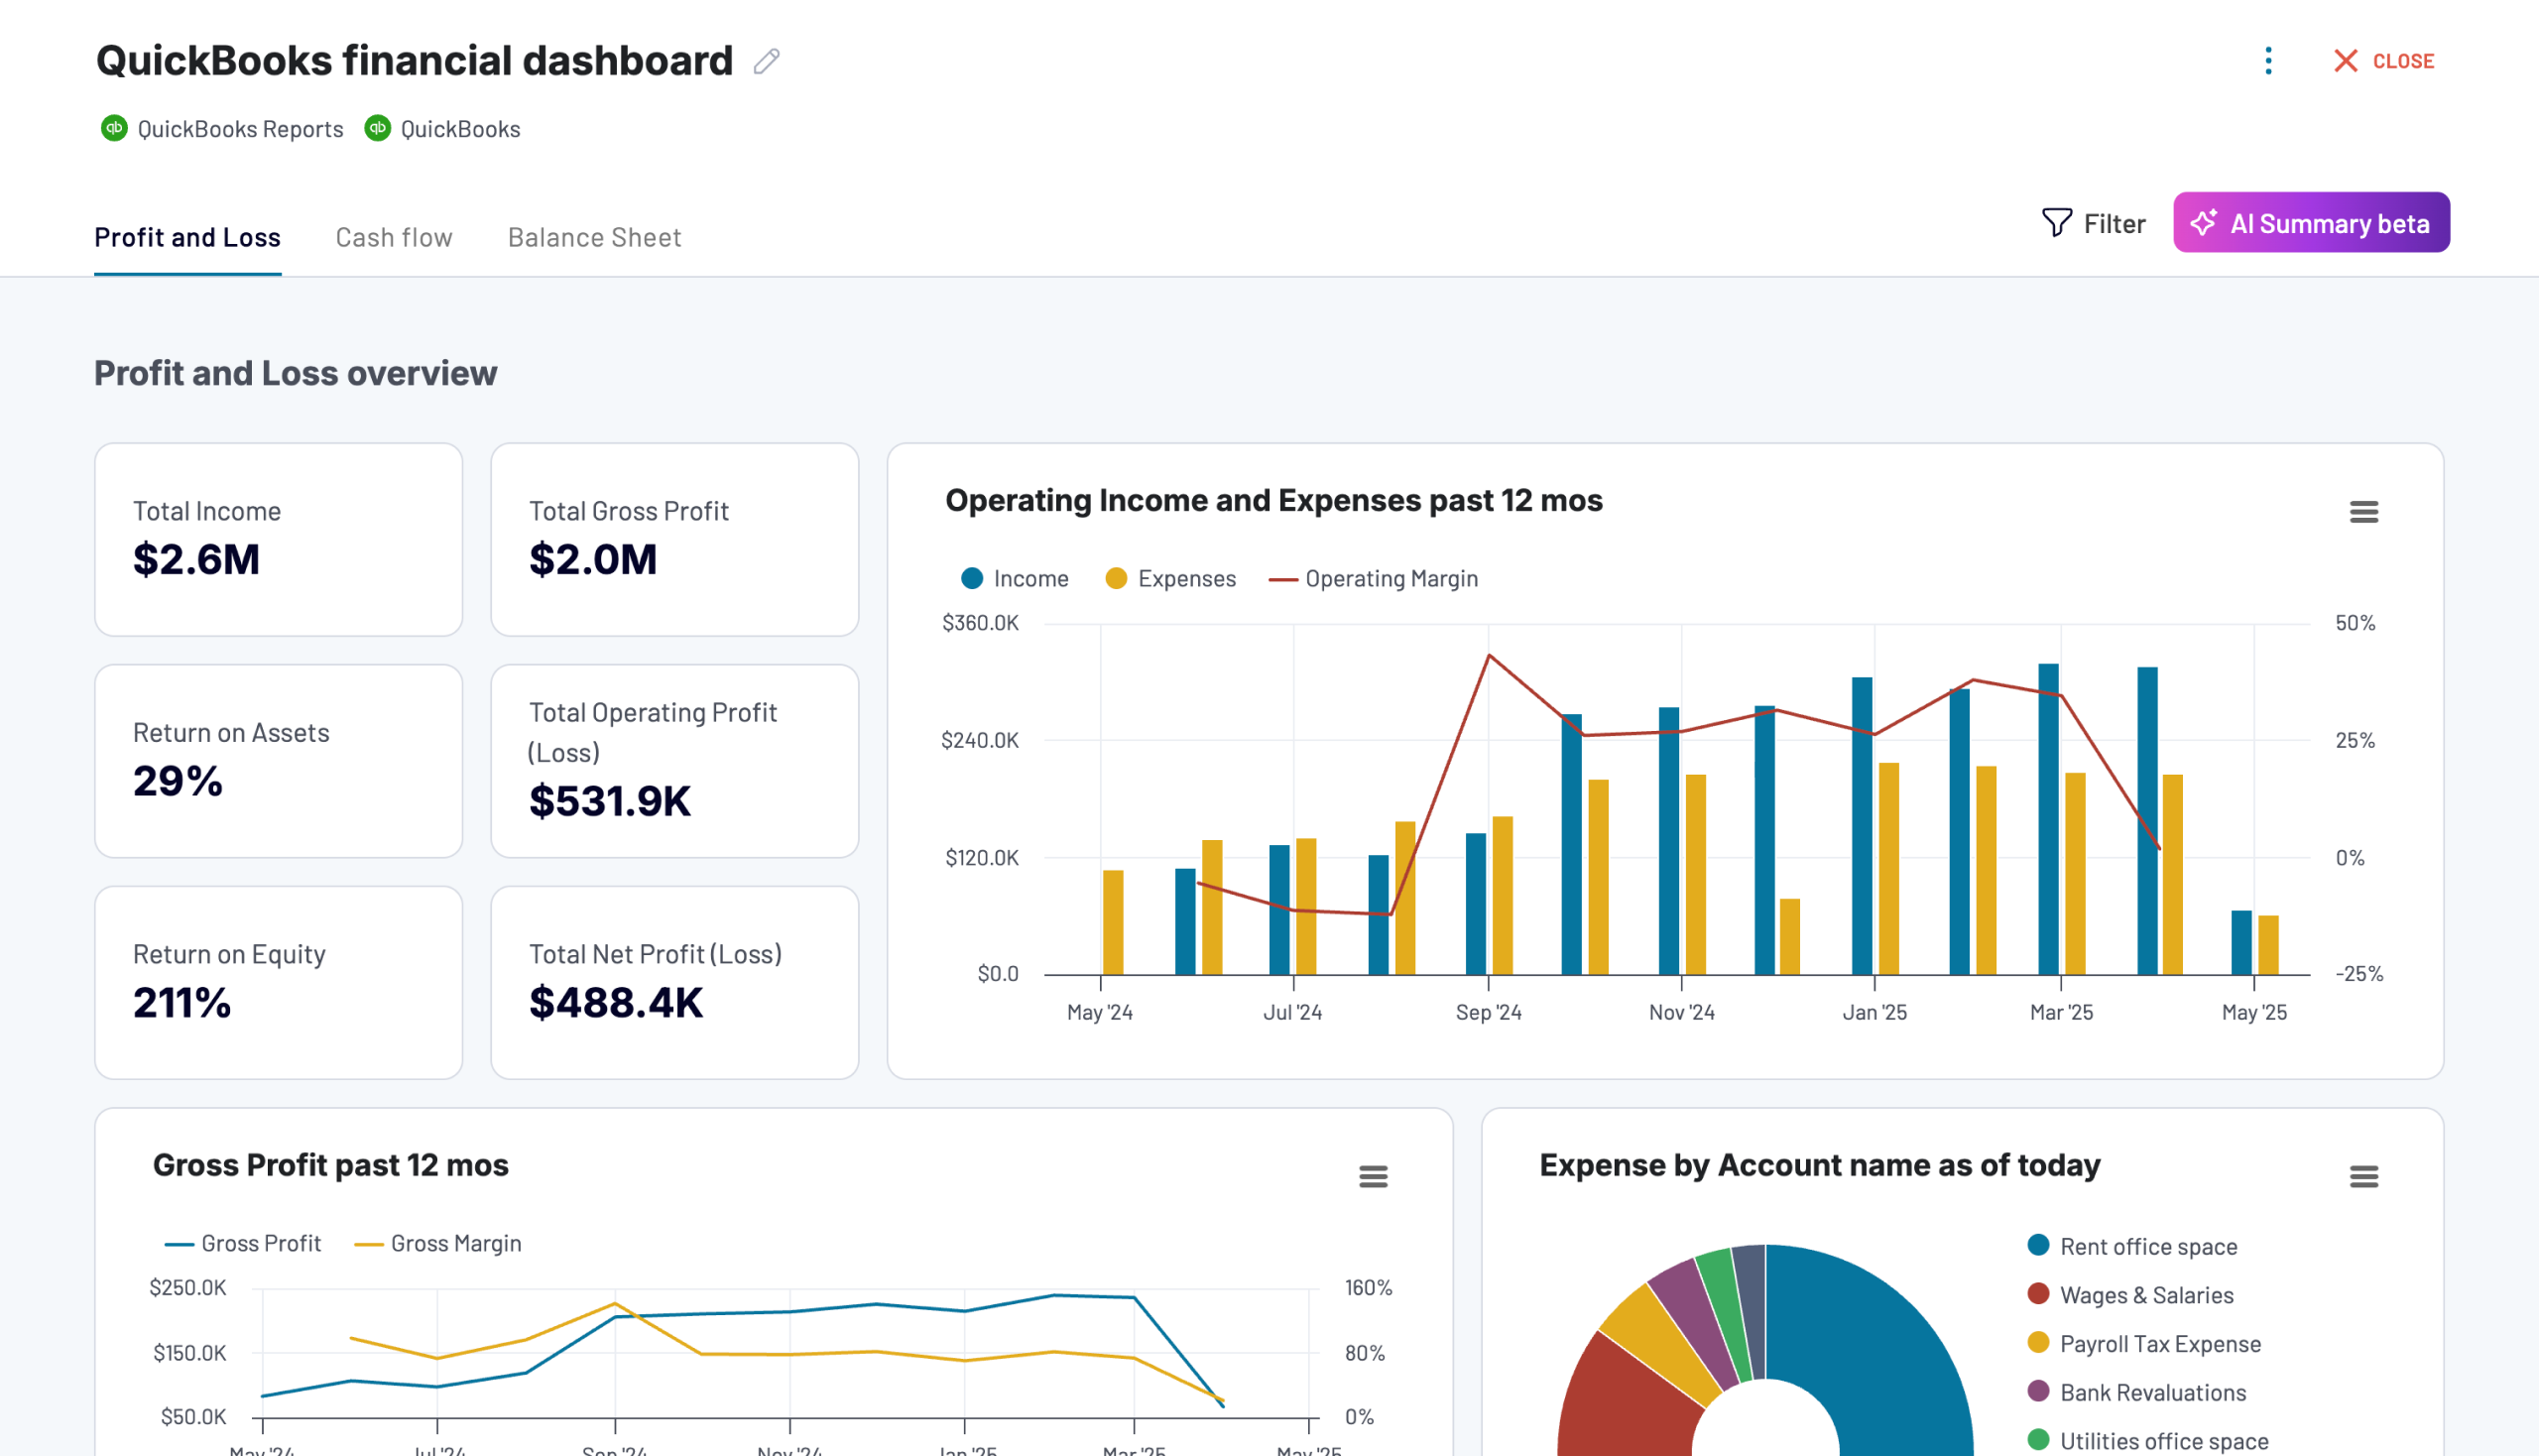
Financial reports track cash position, payment obligations, and revenue collection activities that impact daily operations. Reports monitor accounts receivable aging by customer and time period to prioritize collection efforts, display accounts payable by vendor and due date to optimize payment timing, track bank balances across all accounts and currencies, and show profit and loss trends to control costs. The operational dashboard template includes cash flow monitoring that highlights net cash changes, helping businesses prevent cash gaps. These insights enable finance teams to optimize payment schedules, focus collection efforts, and maintain sufficient liquidity.
Acquisition reports connect marketing investments to sales outcomes by combining data from advertising platforms, Google Analytics 4, and e-commerce or CRM systems. Reports visualize complete customer journeys from ad impressions through website visits to purchases, track weekly performance breakdowns combining ad spend, traffic, sales, and conversion metrics, and monitor daily investment across Google Ads, Facebook Ads, LinkedIn Ads, and other platforms. This integrated view helps marketing operations teams identify which platforms deliver the best ROI, spot conversion bottlenecks, adjust budget allocation based on performance data, and prove marketing effectiveness.
What insights you can get with an operational performance dashboard
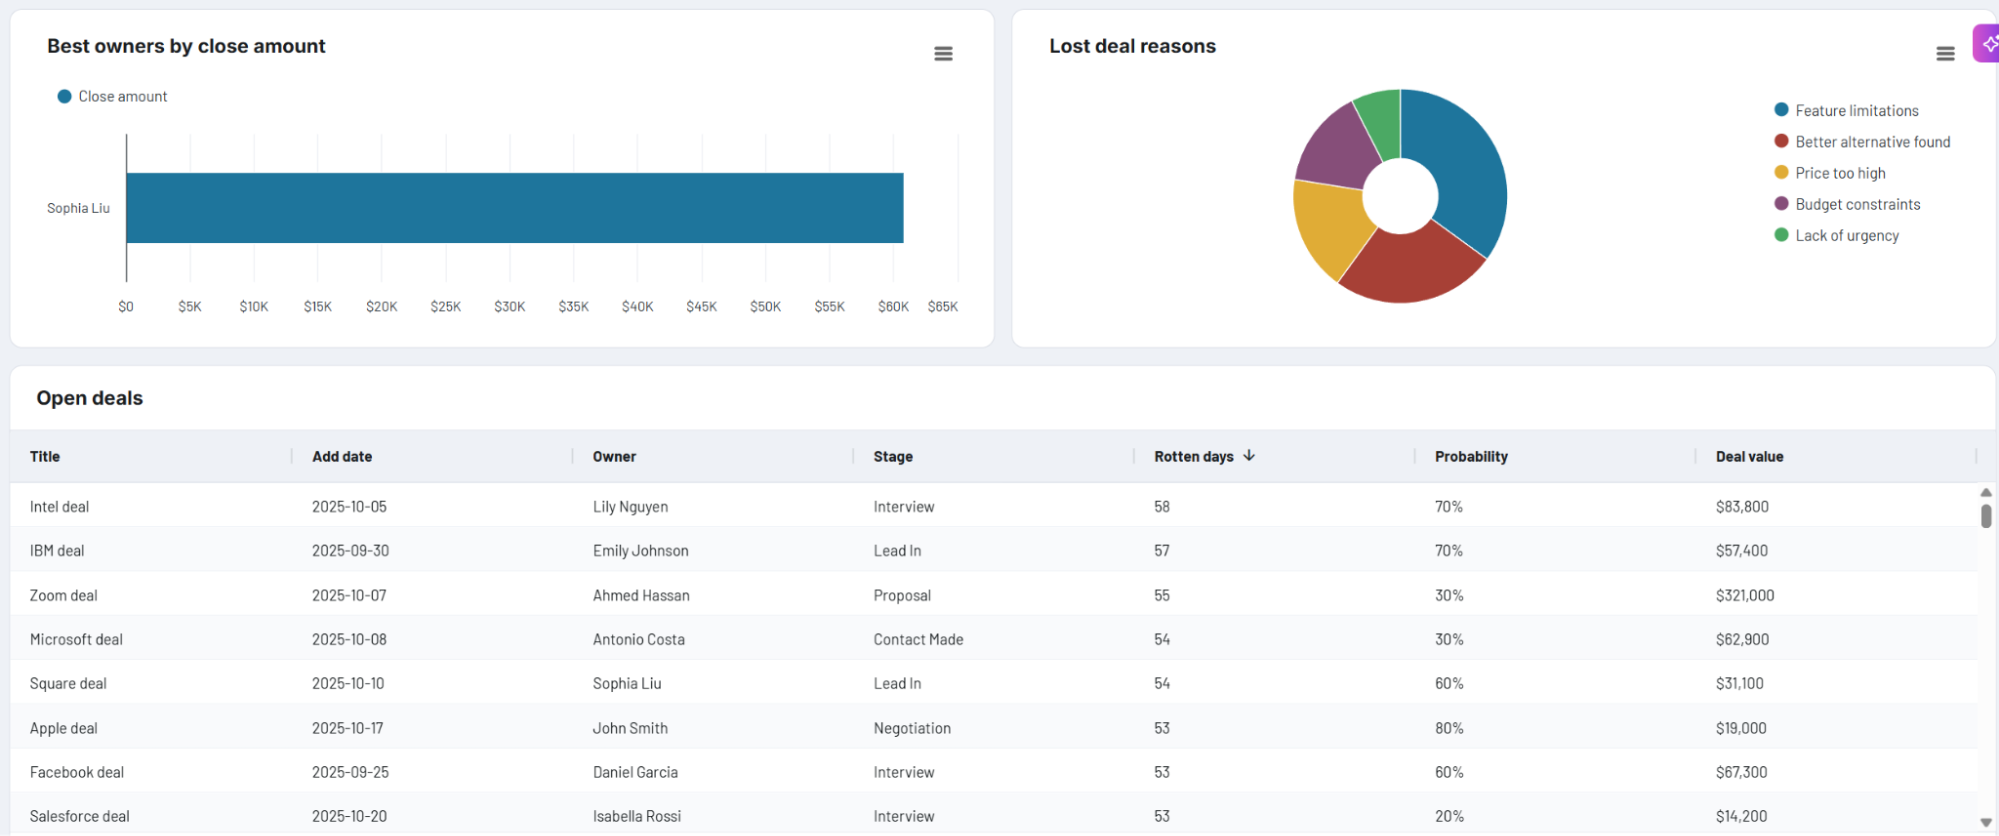
Determine which sales team members struggle with specific deal types and at which pipeline stages negotiations consistently stall. Establish when deals exceed critical time thresholds and require immediate intervention. Recognize patterns showing certain industries or regions need different engagement approaches to prevent revenue loss.
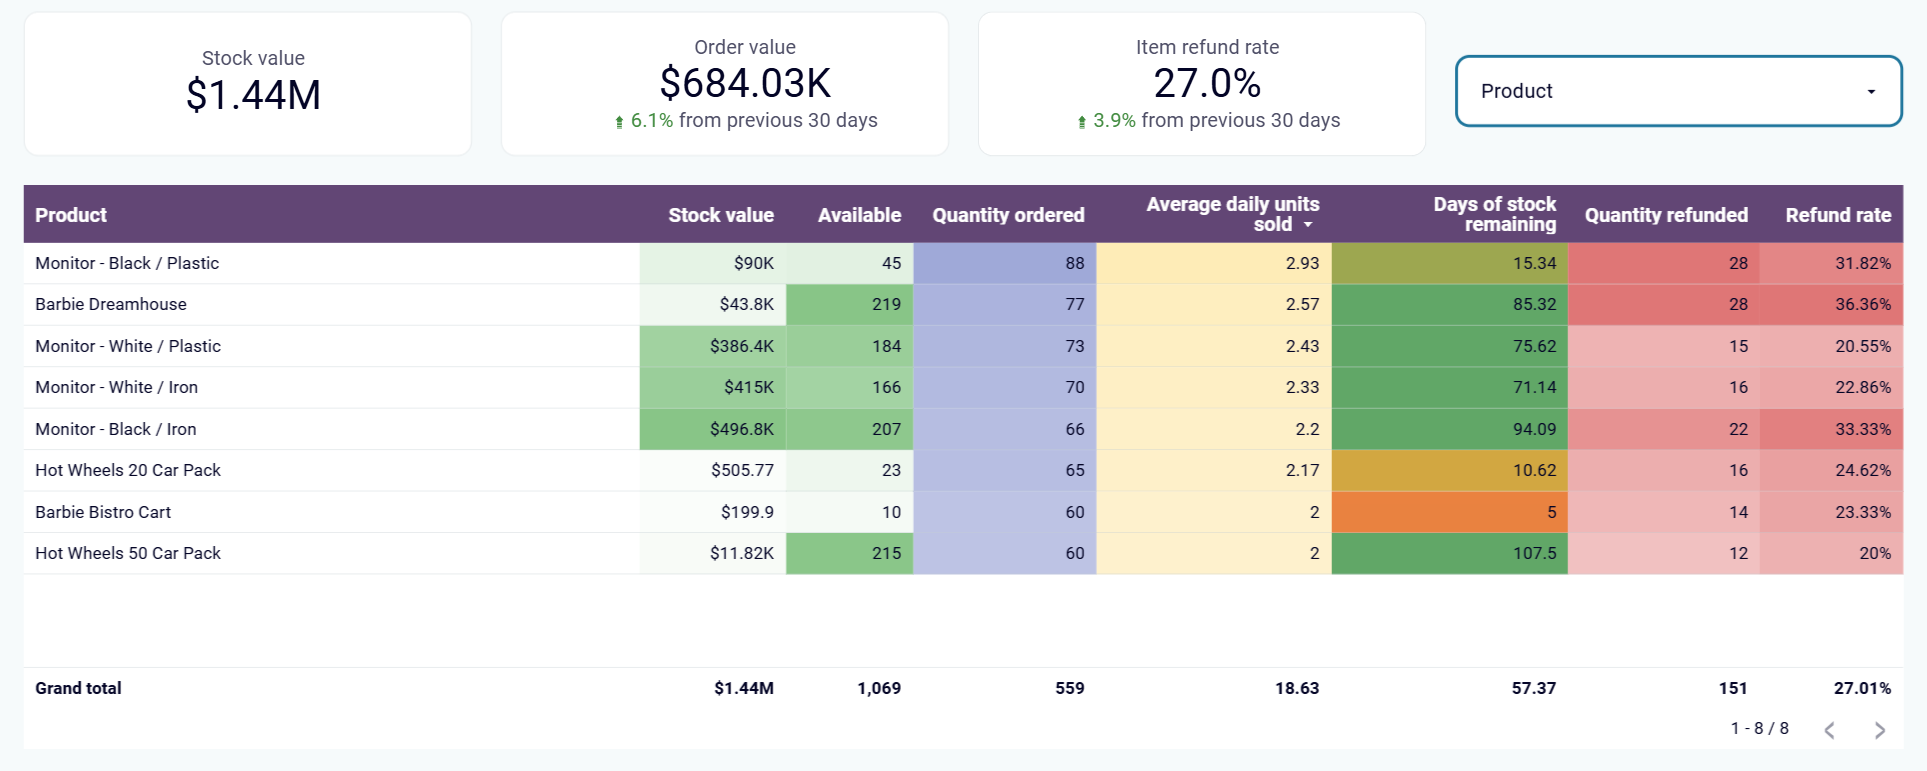
Calculate when each product will run out based on sales velocity to place orders before stockouts occur. Identify fast-moving products requiring immediate reordering versus slow-moving inventory tying up capital. Discover which products sell faster in specific warehouse locations to redistribute stock and prevent regional shortages while other locations have excess.
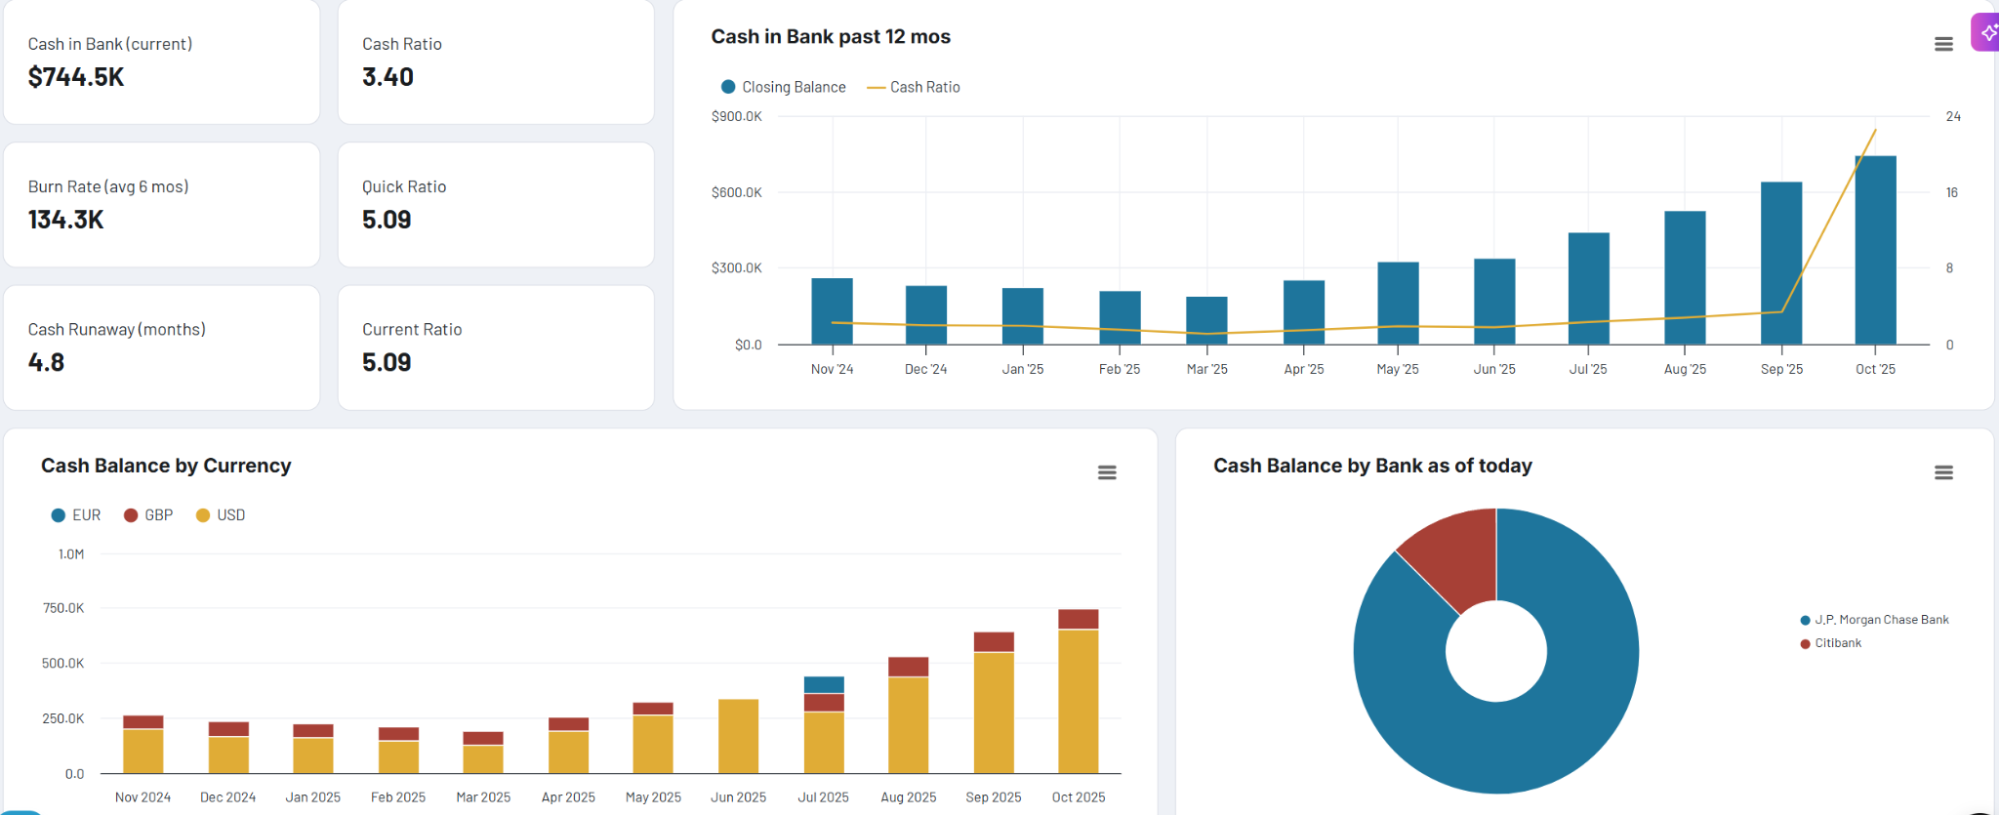
Track how cash moves through your business to ensure adequate reserves for operations and investments. Identify trends in cash accumulation or depletion across accounts to make informed decisions about fund transfers and payment timing. Forecast future cash positions to prevent shortfalls that could disrupt business continuity.
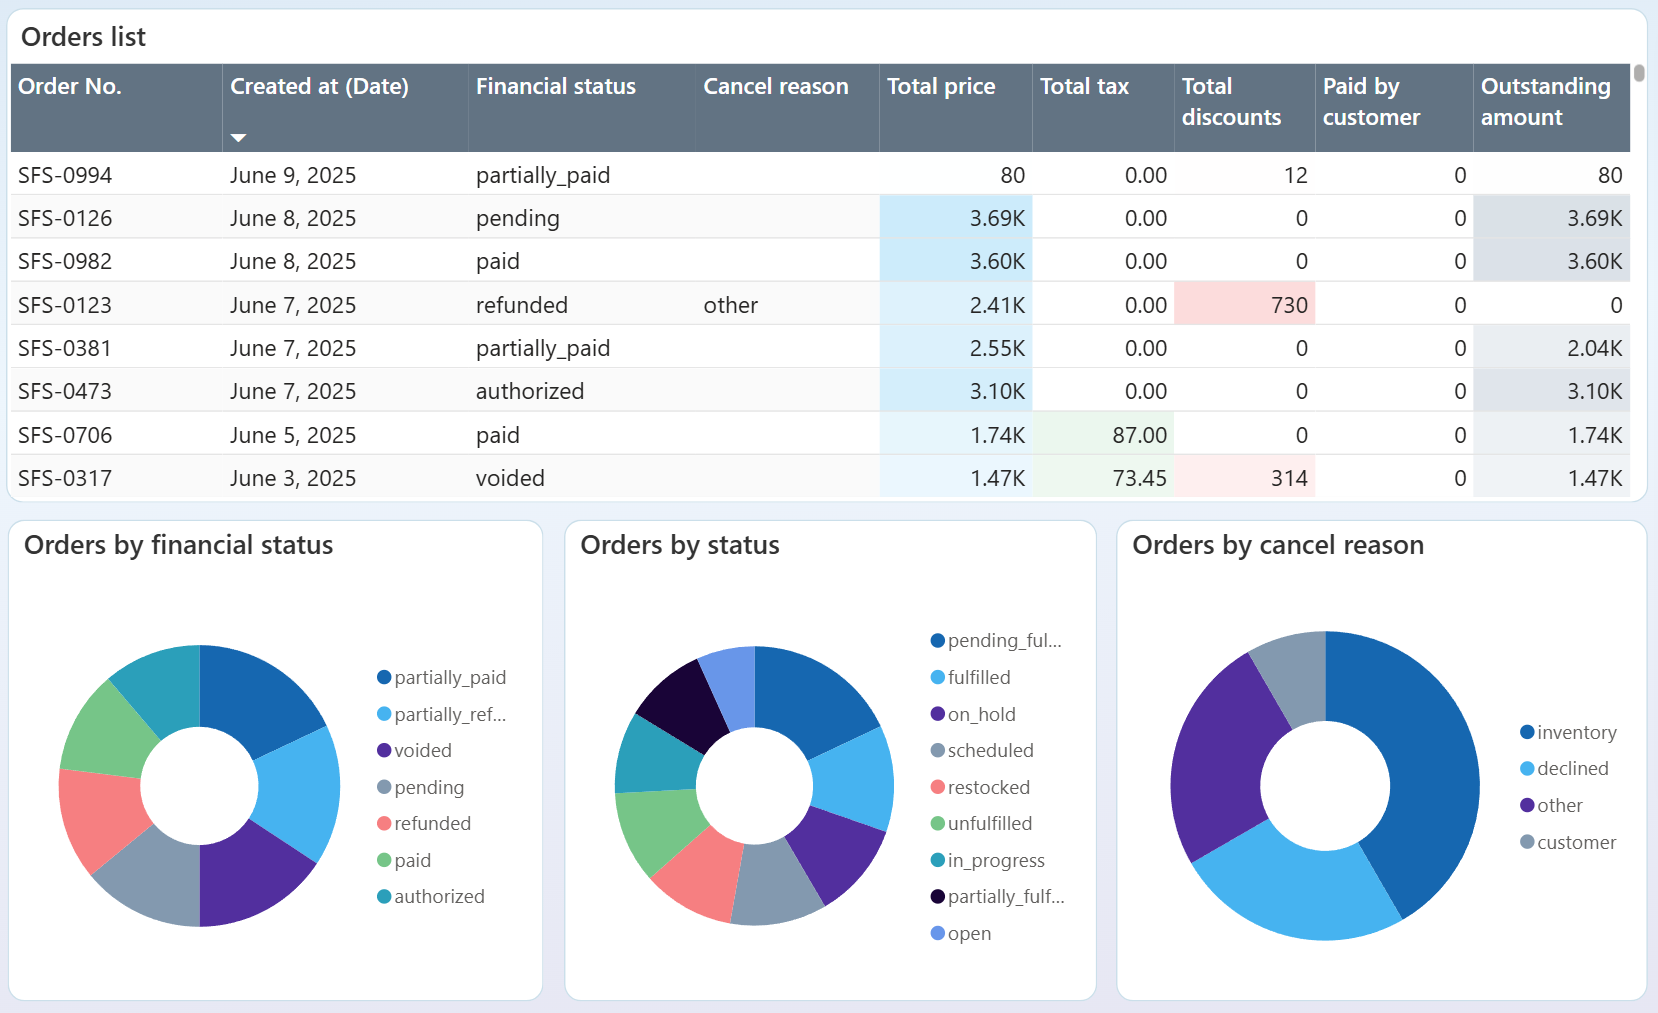
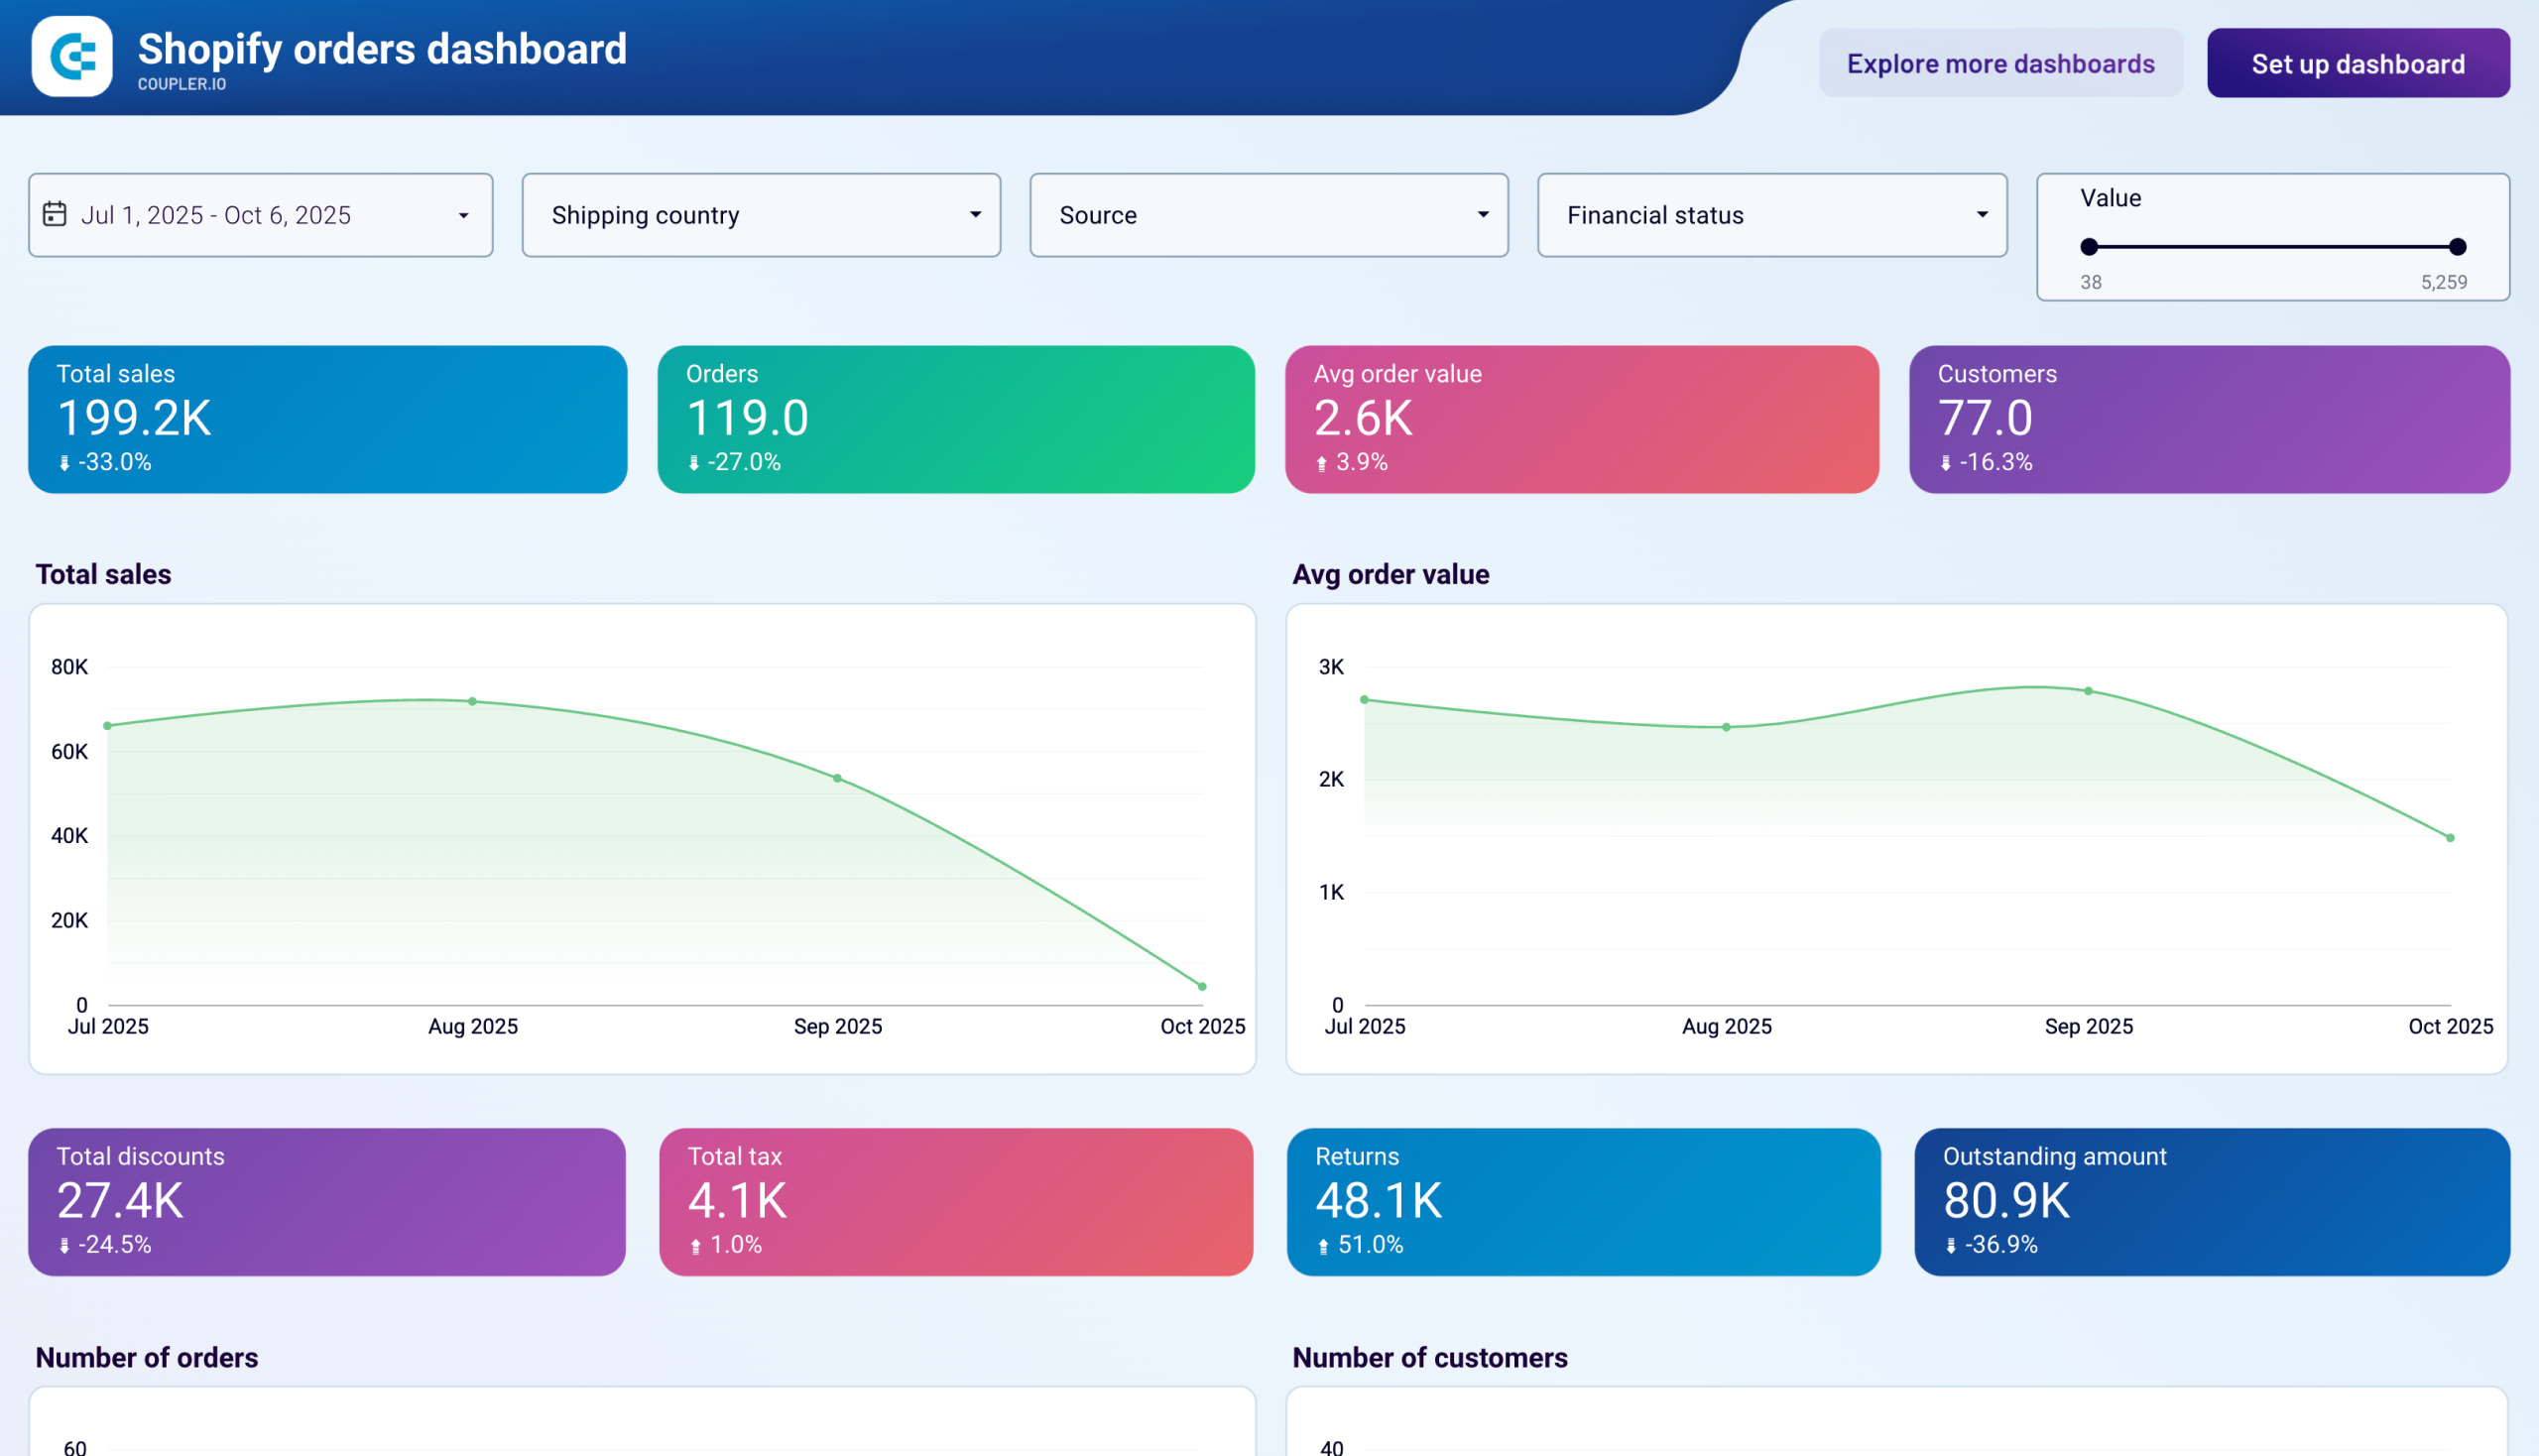
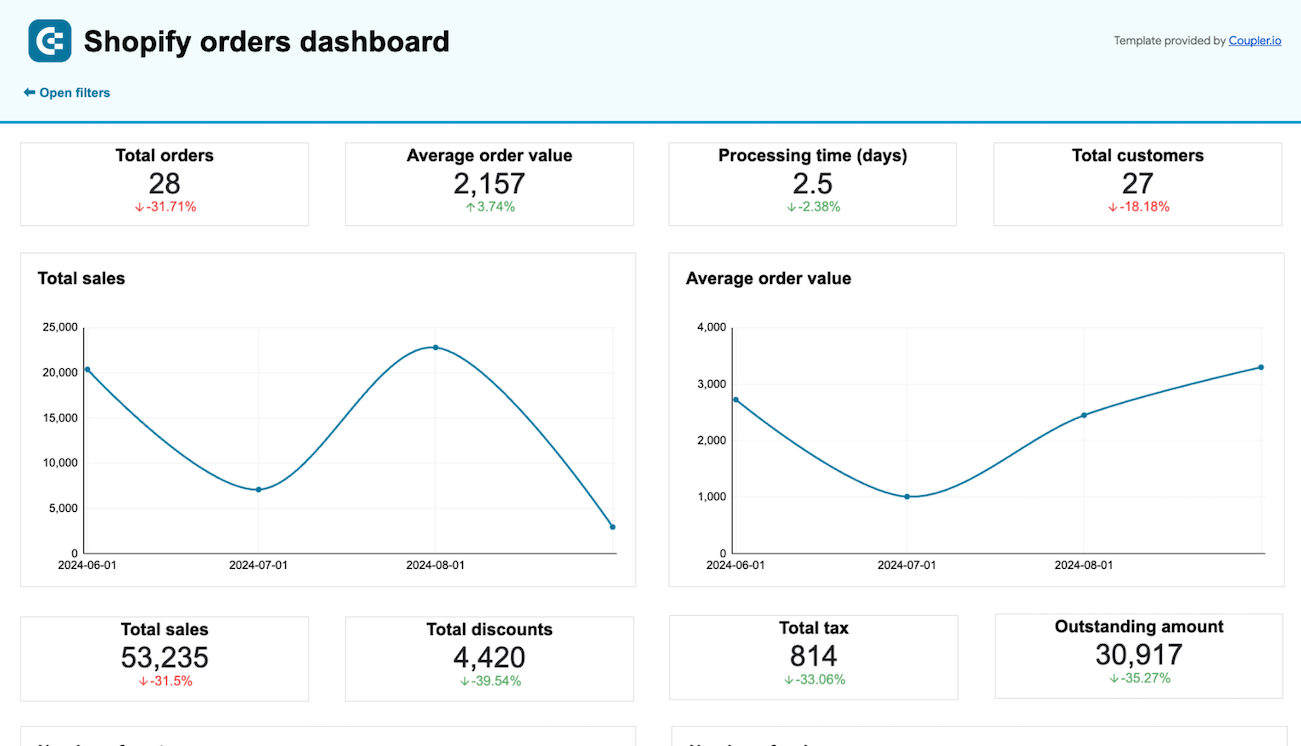
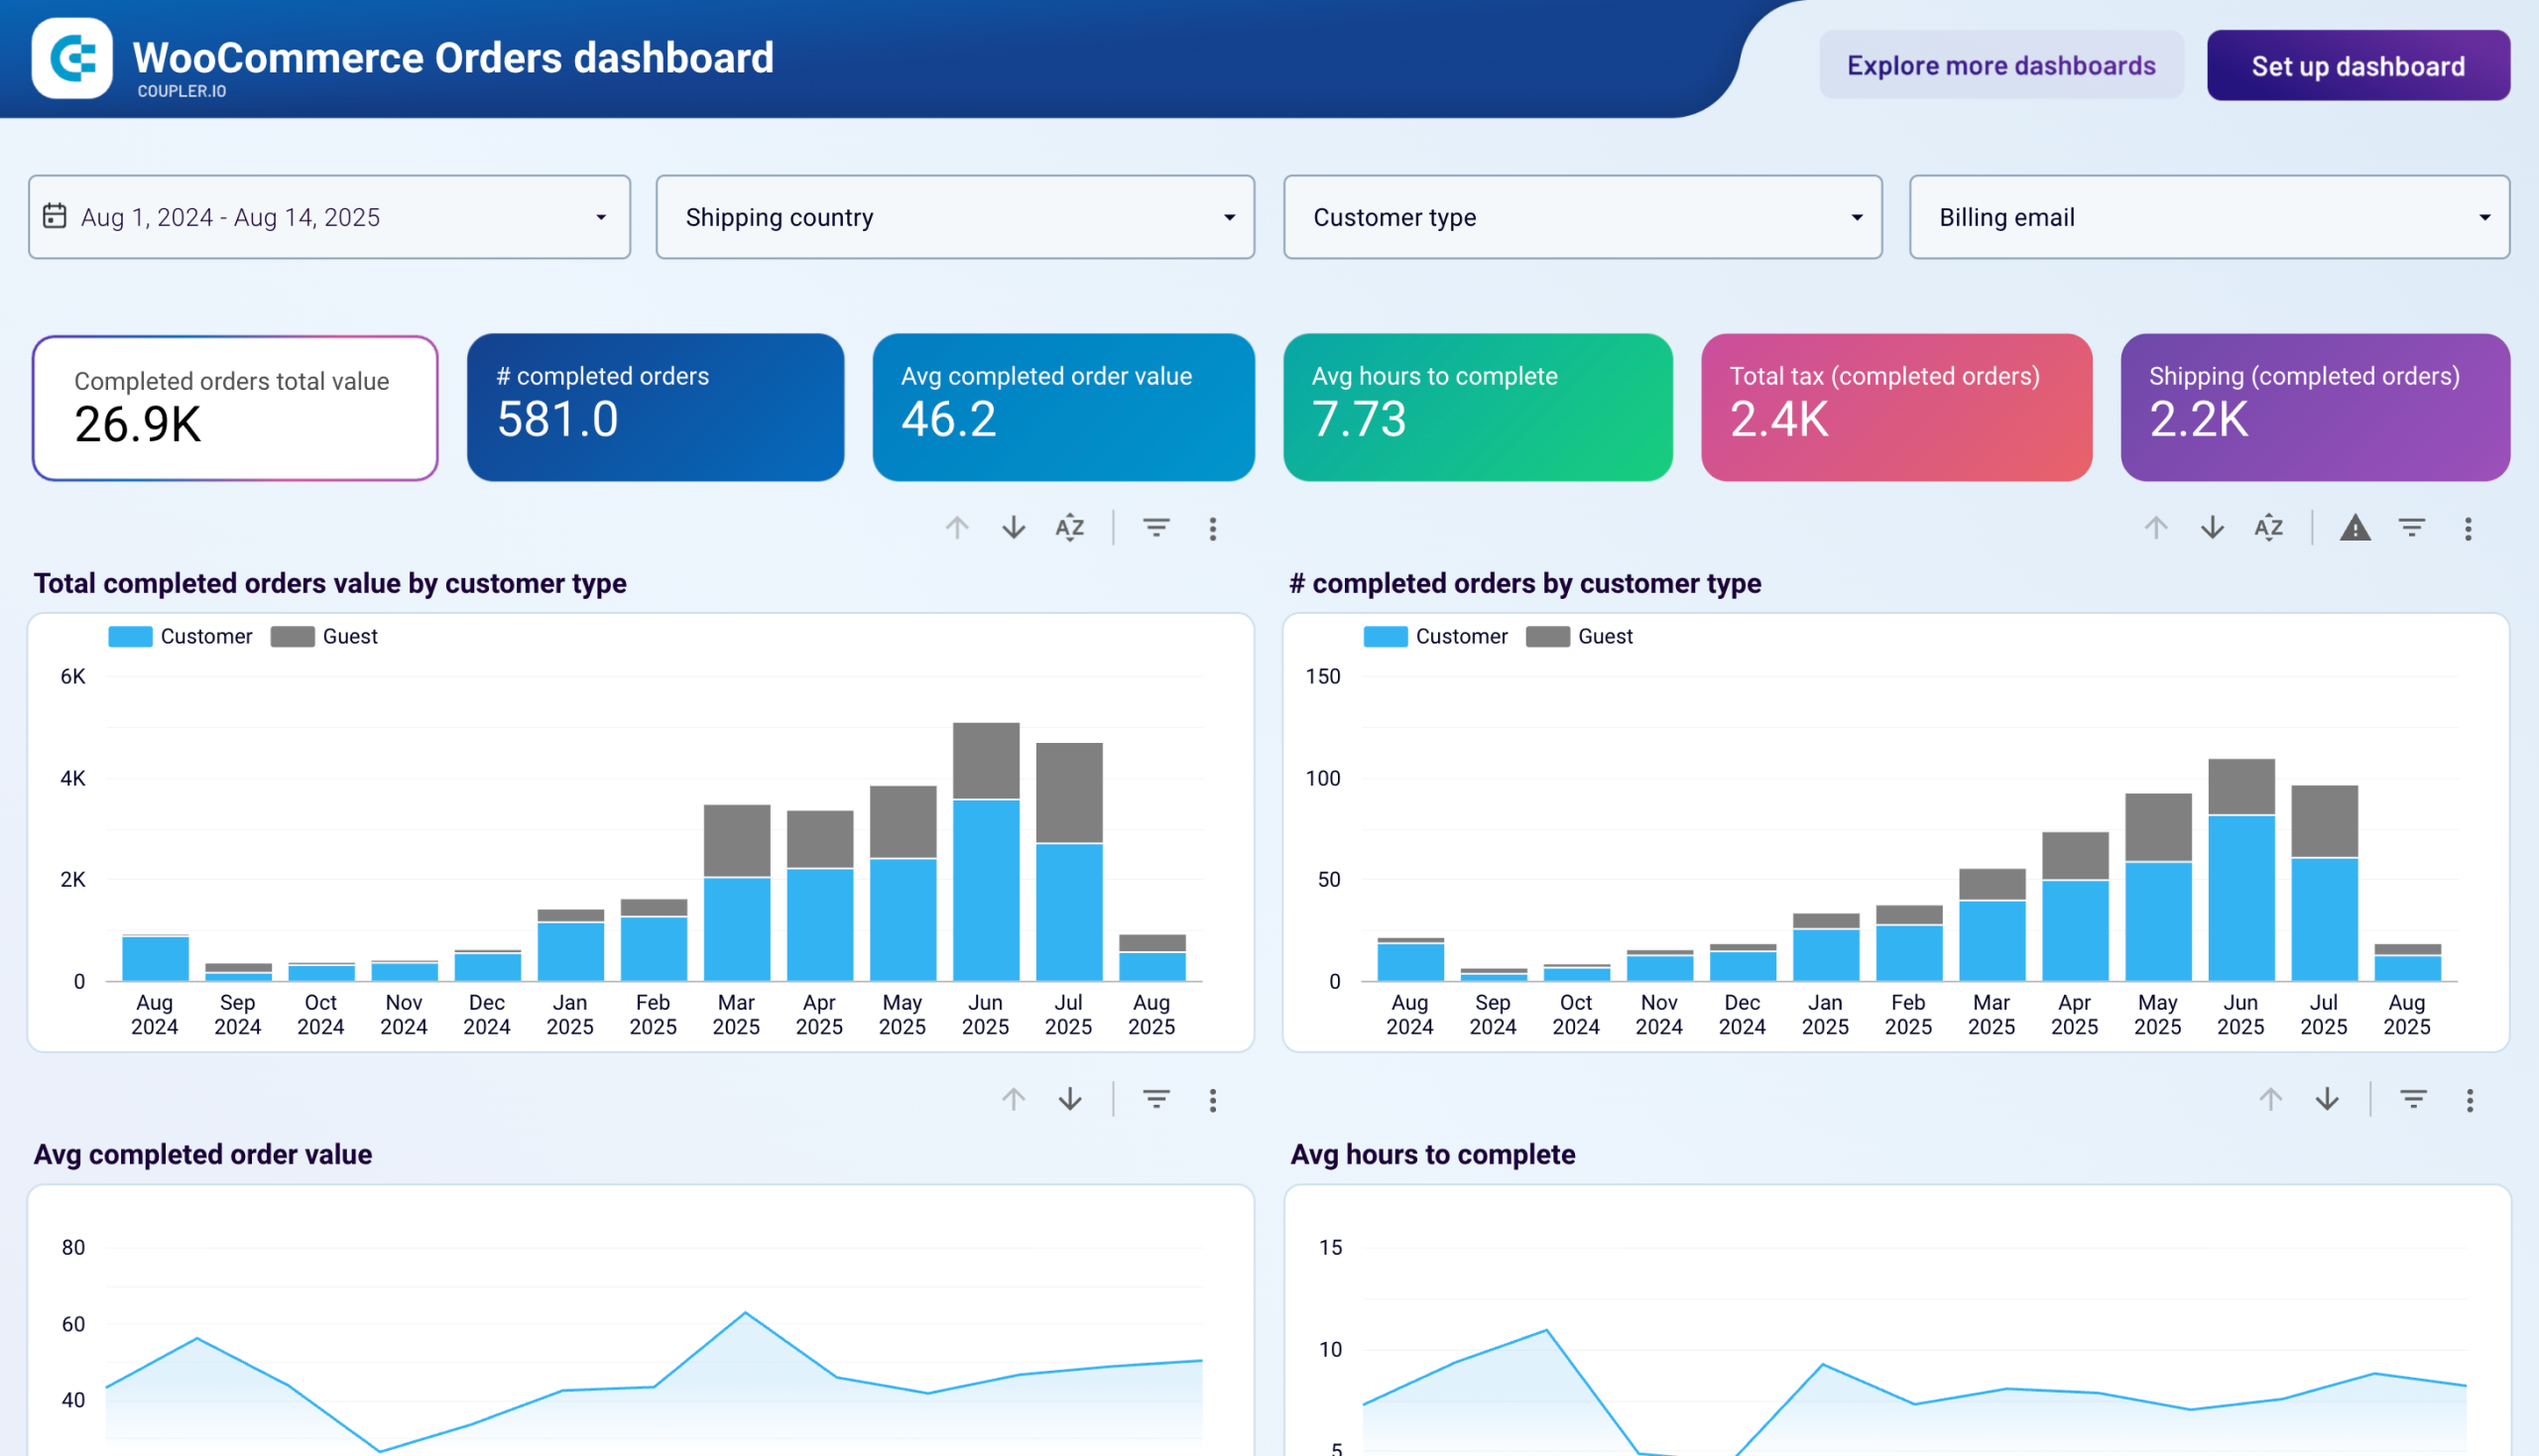
Prioritize resolution of pending and partially paid orders to recover stalled revenue. Understand why orders fail by analyzing cancellation patterns related to inventory issues, payment declines, or customer-initiated cancellations. Address root causes of unfulfilled orders to reduce failure rates and improve customer satisfaction.
How to create an operational dashboard?

Metrics you can track with an operational dashboard template
Calculate how many days current inventory will last based on sales velocity for each SKU. This predictive metric forecasts when stock runs out, enabling proactive procurement planning. Distinguish between products needing immediate reordering and those with sufficient stock, preventing costly stockouts while reducing excess inventory tying up capital.
Track total monetary value of sales opportunities in your pipeline across all stages. Monitor potential revenue at stake to prioritize high-value deals requiring immediate attention. Forecast future income, allocate resources effectively, and identify when pipeline value falls below targets requiring increased lead generation efforts.
Monitor difference between cash inflows and outflows to understand cash position evolution. Track net increase or decrease in available funds across all accounts. Identify concerning trends early, plan for upcoming expenses or investments, and ensure sufficient liquidity for uninterrupted operations without cash gaps.
Measure total value of outstanding customer invoices not yet collected as cash. Provides visibility into earned revenue awaiting payment, with breakdowns by customer and aging period. Essential for cash flow forecasting, identifying customers requiring collection follow-up, and determining whether payment terms need adjustment.
Track total value of vendor bills past due dates, categorized by aging periods. Shows payment obligations requiring immediate attention to avoid late fees and maintain vendor relationships. Monitor alongside available cash to prioritize which vendors to pay first and prevent supply chain disruptions.
Calculate percentage of prospects moving from one funnel stage to the next in sales or marketing processes. Reveals where potential customers drop off between pipeline stages or from visitors to purchasers. Identify specific bottlenecks requiring optimization and measure impact of process improvements over time.
Determine total advertising spend divided by orders generated to measure customer acquisition efficiency. Connects marketing investments directly to sales outcomes, showing whether acquisition costs increase or decrease. Compare platform performance for budget allocation and set realistic targets for profitable acquisition.
Calculate percentage of orders resulting in product returns by geographic region or product category. Reveals region-specific issues like sizing problems, shipping damage, or unmet local expectations. Address root causes through adjusted descriptions, improved packaging, or reconsidered sales strategy in high-return regions.
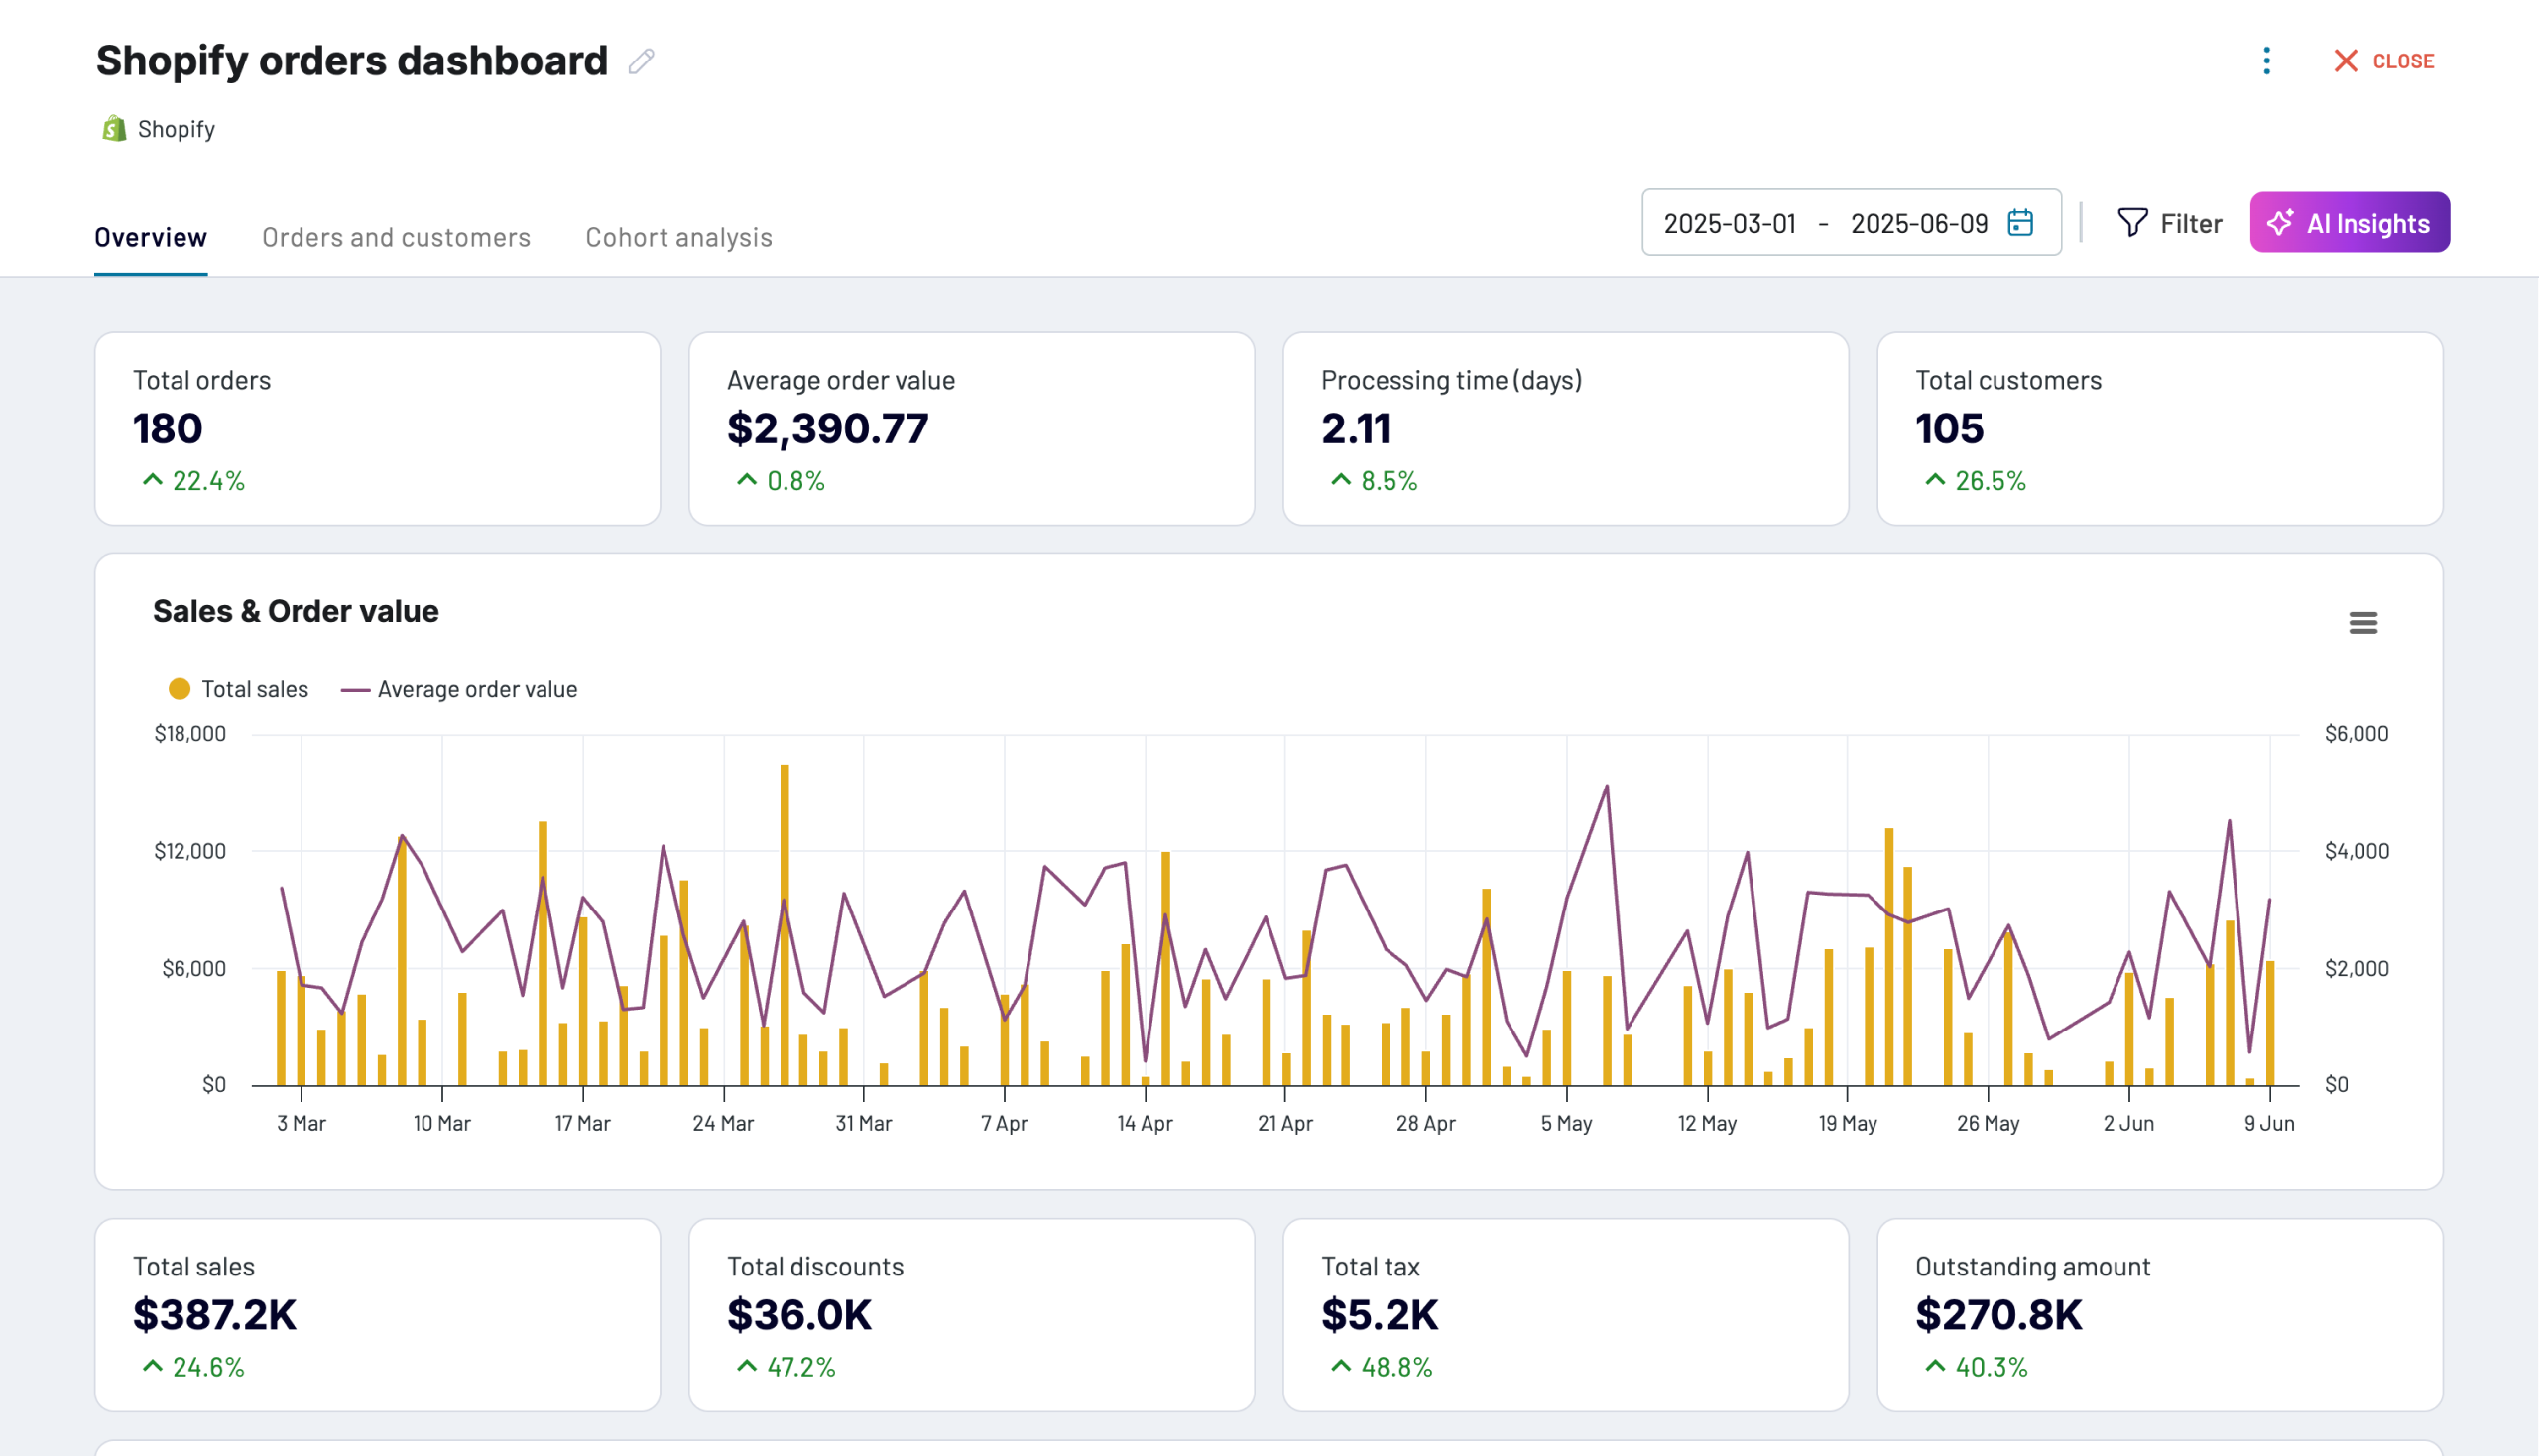
Track total orders placed over daily, weekly, or monthly periods to understand sales activity patterns. Identify seasonality, measure promotional campaign effectiveness, and detect unusual fluctuations indicating problems or opportunities. Determine whether revenue growth comes from more transactions or higher-value purchases.
Assess likelihood of successfully closing each sales opportunity based on deal characteristics, stage, and historical patterns. Prioritize efforts on deals most likely to convert and provide realistic revenue forecasts. Identify which opportunities deserve immediate focus and which require different engagement strategies.