Looker Studio SEO dashboard examples and reporting templates
Get a full picture of your organic search performance with Looker Studio SEO dashboard templates built on Google Search Console data. Analyze traffic dynamics, track keyword positions, diagnose indexing issues, and compare performance across countries. Keep your reports up to date with data refreshed automatically through Coupler.io.
Looker Studio SEO dashboard examples for every need


about your case. It doesn't cost you a penny 😉
Choose your Looker Studio SEO dashboard template to kick off
What is a Looker Studio SEO dashboard?
Our Looker Studio SEO dashboards address different angles of search performance. Some focus on weekly traffic changes and page-level winners and losers. Others help diagnose indexing problems or monitor keyword rankings across countries.
Coupler.io connects your Google Search Console account to Looker Studio and refreshes the data on a schedule, so the reports stay up-to-date without manual exports. The result is a set of ready-to-use Looker Studio SEO dashboard templates that replace repetitive manual reporting with automated, always-up-to-date analytics. Whether you need a single overview or multiple Looker Studio SEO reporting dashboards for different teams, the setup takes just a couple of minutes.

What reports should be included in Looker Studio SEO dashboards?
SEO data becomes useful when it's organized around specific questions: Is organic traffic growing? Are pages indexed correctly? Which keywords drive clicks? Where does your audience come from? The following four reports address these areas and form the backbone of a well-rounded Looker Studio SEO reporting dashboard.
This report tracks how your website performs in Google Search over time. It includes weekly and monthly views of organic clicks, impressions, CTR, and average position. The organic search performance report also compares the best and worst-performing pages by clicks, highlighting which URLs gained or lost traffic compared to the previous month. Device-level breakdowns show how users interact with your search listings across desktop, mobile, and tablet. Use this as your primary Looker Studio SEO reporting dashboard to assess organic health at a glance.
Organic performance depends on whether Google can access and index your pages properly. The technical site health report monitors URL coverage states, fetch issues, and rendering problems pulled from Google Search Console. It identifies pages blocked by robots.txt or robots meta tags, flags submitted-but-not-indexed URLs, and tracks AMP status. Five pie charts break down page states so you can assess the general health of your site in seconds. This report works as a routine SEO audit tool or a quick diagnostic during site migrations and technical changes.
Understanding which search queries drive traffic to each page is a core SEO task. This report organizes pages by clicks and displays up to 10 top-ranking queries per URL, along with impressions, average position, and CTR for each keyword. It helps you check whether queries match each page's intent, detect keyword cannibalization, and find queries with high impressions but low CTR. You can filter by country or URL folder to focus on specific site sections.
For websites that attract visitors from multiple countries, this report tracks traffic dynamics by region. It shows total clicks by country, identifies the top 5 growing and declining regions, and provides daily breakdowns of clicks, impressions, CTR, and position per country. Page-level filters let you check whether localized content sections rank in their target markets. If you launched a French version of your site, for example, you can verify whether traffic from France is growing as expected. This report adds a geographic layer to your Looker Studio SEO dashboard examples and helps prioritize regional optimization efforts.
What insights you can get with a Looker Studio SEO performance dashboard
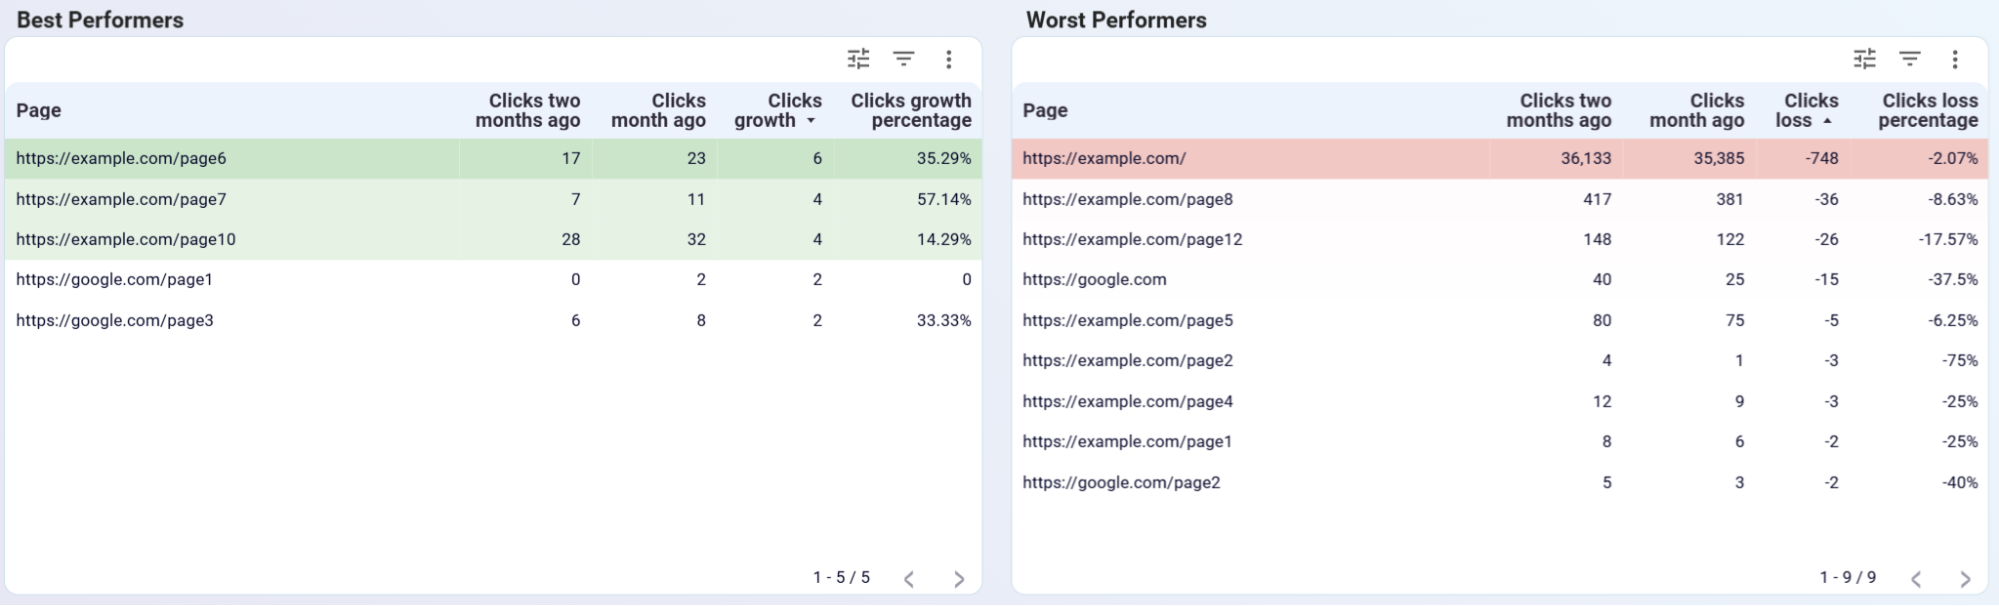
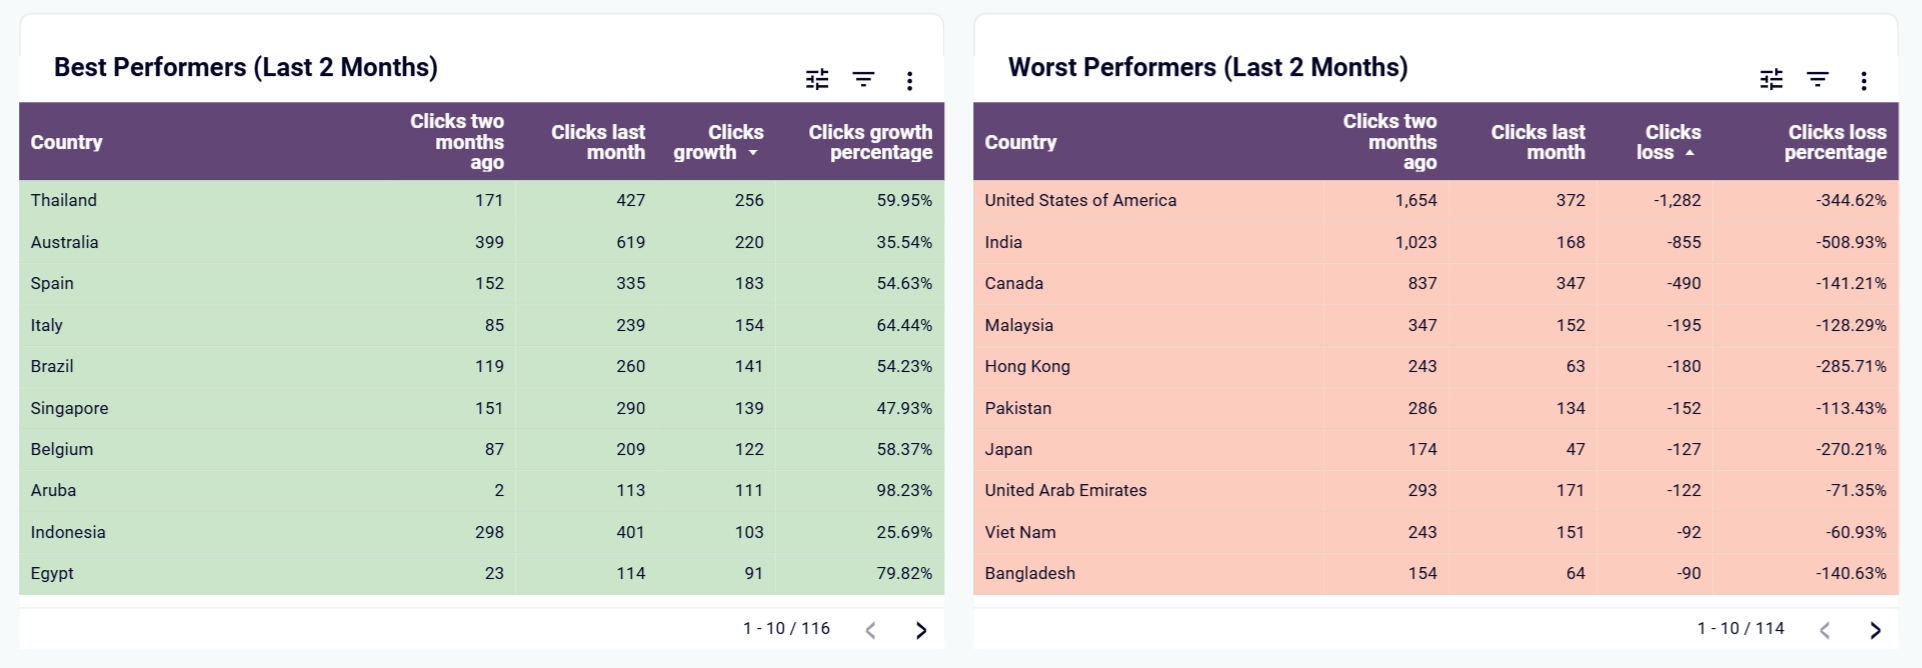
See which URLs gained organic traffic and which lost clicks over the last month — all ranked by click change. Prioritize your next steps: investigate technical issues on declining pages, refresh outdated content, or double down on pages trending upward. Act on page-level data instead of relying on site-wide averages.
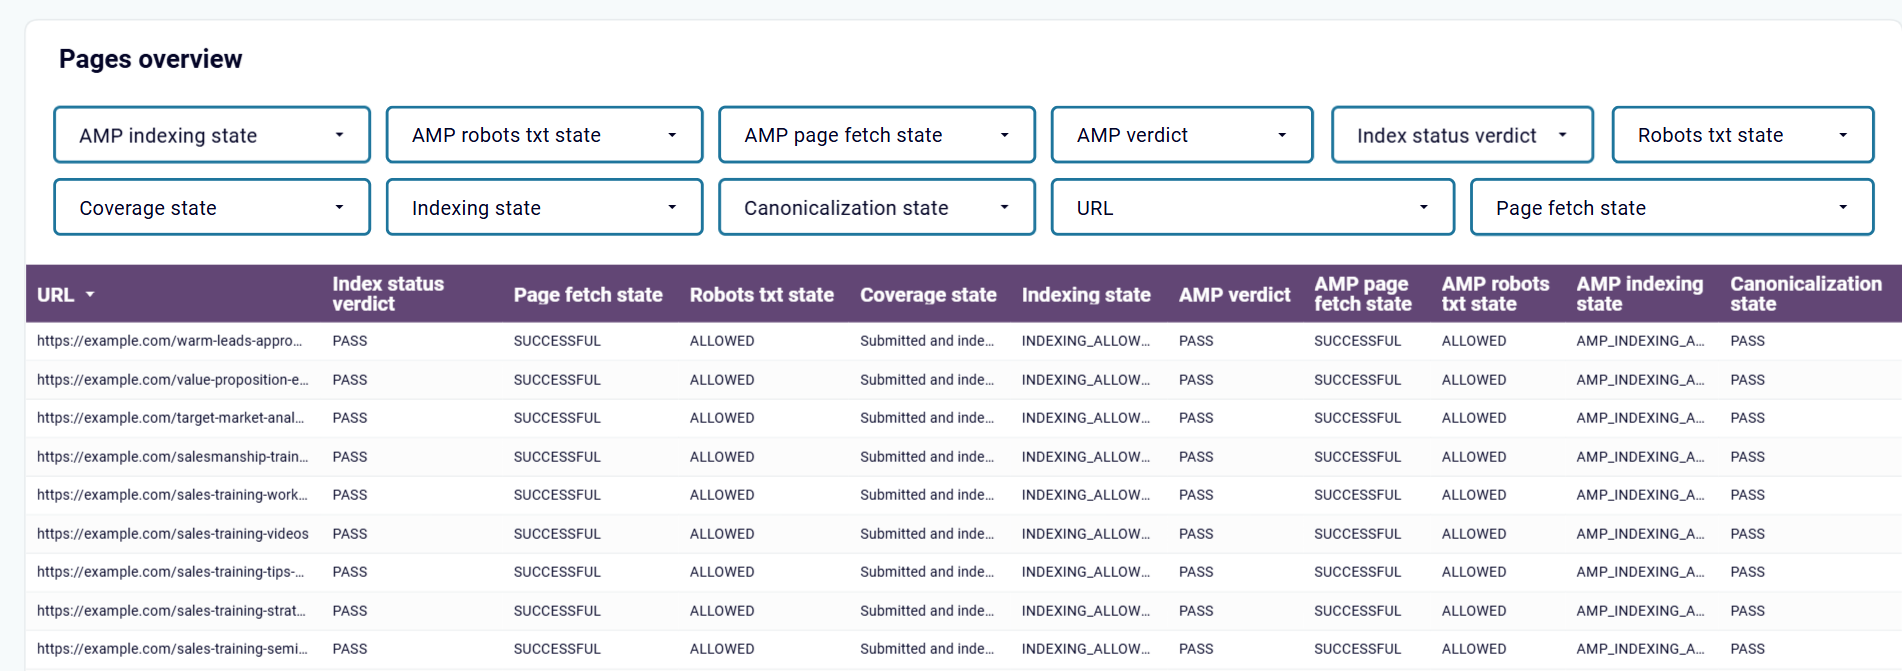
Check which pages Google cannot access or index — whether they're blocked by robots.txt, restricted by robots meta tags, or submitted but not yet indexed. Filter by page state to isolate specific issues and build a prioritized fix list. Catch crawling and rendering problems before they silently cut your pages out of search results.
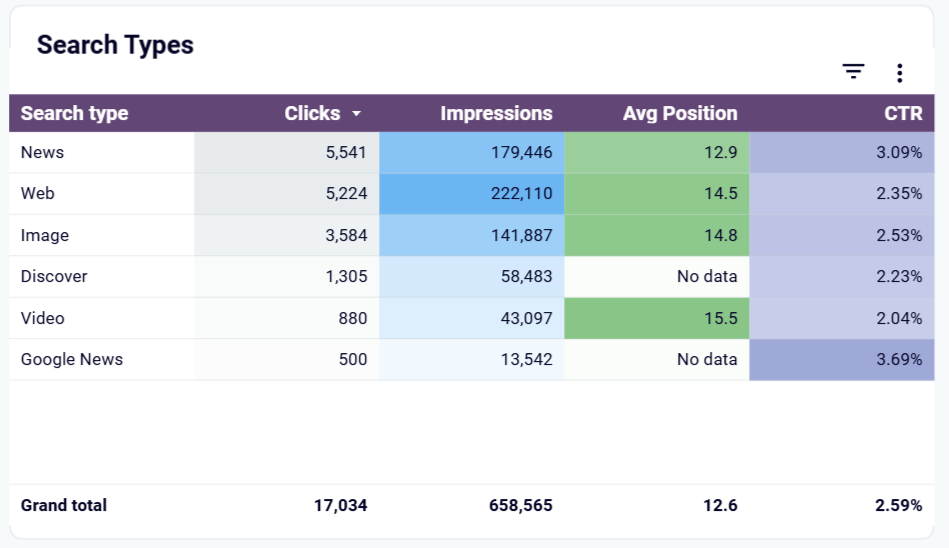
Find out if your site gets clicks from Image, Video, News, or Discover results — not just standard web search. See the full traffic structure on a single page and uncover sources you might be missing. Check whether visual-heavy sections attract Image Search visitors or whether your blog content appears in Google Discover feeds.
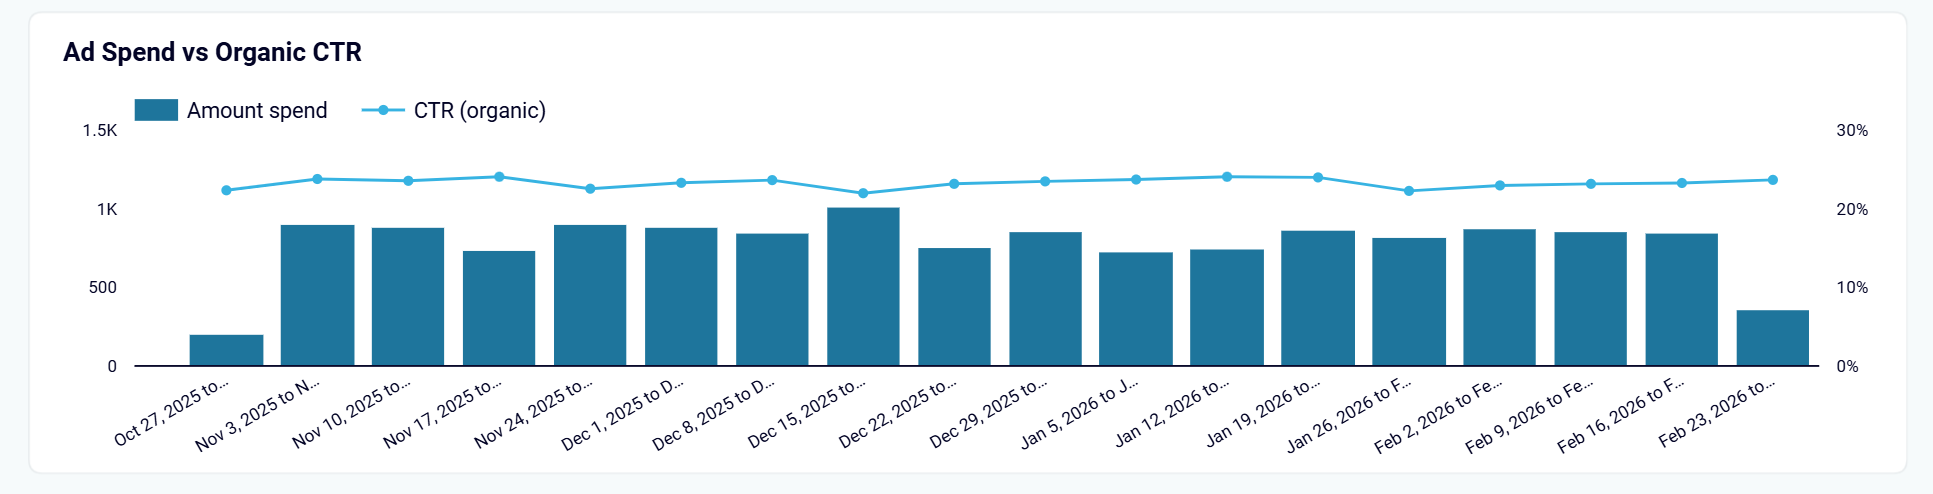
Compare your Google Ads spend against organic CTR trends for branded keywords and see if paid investment lifts organic engagement. Identify periods where both channels reinforce each other and use that data to plan smarter budgets. Stop guessing whether your ad campaigns help or duplicate your organic brand presence.
Compare clicks per country for the last 30 days against the previous period and spot which regions gain momentum and which lose ground. Verify whether your localized content drives expected traffic. Catch unexpected drops in key markets before they become larger problems and redirect your optimization efforts where they matter most.
How to create a Looker Studio SEO dashboard?

Metrics you can track with a Looker Studio SEO dashboard template
The total number of times users clicked through to your site from Google Search results. This metric reflects actual traffic driven by your organic listings and serves as the primary indicator of SEO effectiveness. Track clicks weekly or monthly to spot trends and measure the impact of optimization efforts.
The number of times your pages appeared in Google Search results, regardless of whether users clicked. Impressions measure your content's visibility and reach in search. A high impression count paired with low clicks signals an opportunity to improve meta titles, descriptions, or search snippets.
The percentage of impressions that converted into clicks. CTR indicates how compelling your search listings are to users. Low CTR on high-impression queries suggests that your page titles or descriptions need revision to better match search intent and encourage clicks.
Your average ranking in Google Search results for tracked queries. This metric shows where your pages typically appear and helps assess whether optimization efforts move you closer to top positions. Monitor position changes over time to evaluate the effectiveness of content updates and link building.
The indexing state of your pages as reported by Google Search Console — including indexed, excluded, and error statuses. This metric from the Technical SEO dashboard helps you identify pages blocked by robots.txt, rendering failures, and submitted-but-not-indexed URLs that need fixing.
The difference in clicks each page received compared to the previous month. This metric powers the best and worst performers tables in the SEO dashboard, allowing you to quickly identify which URLs are gaining or losing organic traffic and take action accordingly.
The highest-traffic search queries driving clicks to each URL, ranked by click volume. Available in the Top search query performance dashboard, this metric helps you verify keyword relevancy, detect cannibalization, and find queries with ranking potential that haven't yet reached top positions.
The number of clicks on search results triggered by branded keyword queries. Tracked across the Branded organic search vs. paid campaign performance dashboard, this metric helps you measure brand strength in organic search and evaluate how paid campaigns influence branded search behavior.