Klaviyo dashboard examples and reporting templates
Unlock the true potential of your email marketing with Klaviyo dashboards that reveal hidden patterns in subscriber behavior and campaign performance. From identifying optimal send times to tracking revenue attribution across customer touchpoints, these analytics tools transform raw email data into strategic advantages for your business growth.
Klaviyo dashboard examples for every need


 +6
+6


 +5
+5

 +6
+6
about your case. It doesn't cost you a penny 😉
Choose your white label Klaviyo dashboard to kick off
What is a Klaviyo dashboard?
These specialized reporting interfaces gather every interaction from your Klaviyo account and weave them into comprehensive visual narratives that explain not just what happened, but why it matters for your business. Automated through Coupler.io's data connector, Klaviyo dashboards eliminate the manual work of data collection and analysis. They free you to focus on strategy refinement and campaign optimization based on real subscriber behavior insights.

What reports should be included in Klaviyo dashboards?
Successful Klaviyo reporting requires four core report types that work together to provide complete visibility into your email marketing performance. Each report addresses different aspects of subscriber behavior and campaign effectiveness, helping you optimize your email strategy from multiple angles.
The email client engagement report tracks how subscribers interact with your campaigns across different email platforms like Gmail, Apple Mail, and Outlook. This report shows which email clients your audience prefers and where you see the highest engagement rates. You can identify platform-specific performance patterns and optimize your email design to work best on the clients your subscribers actually use.
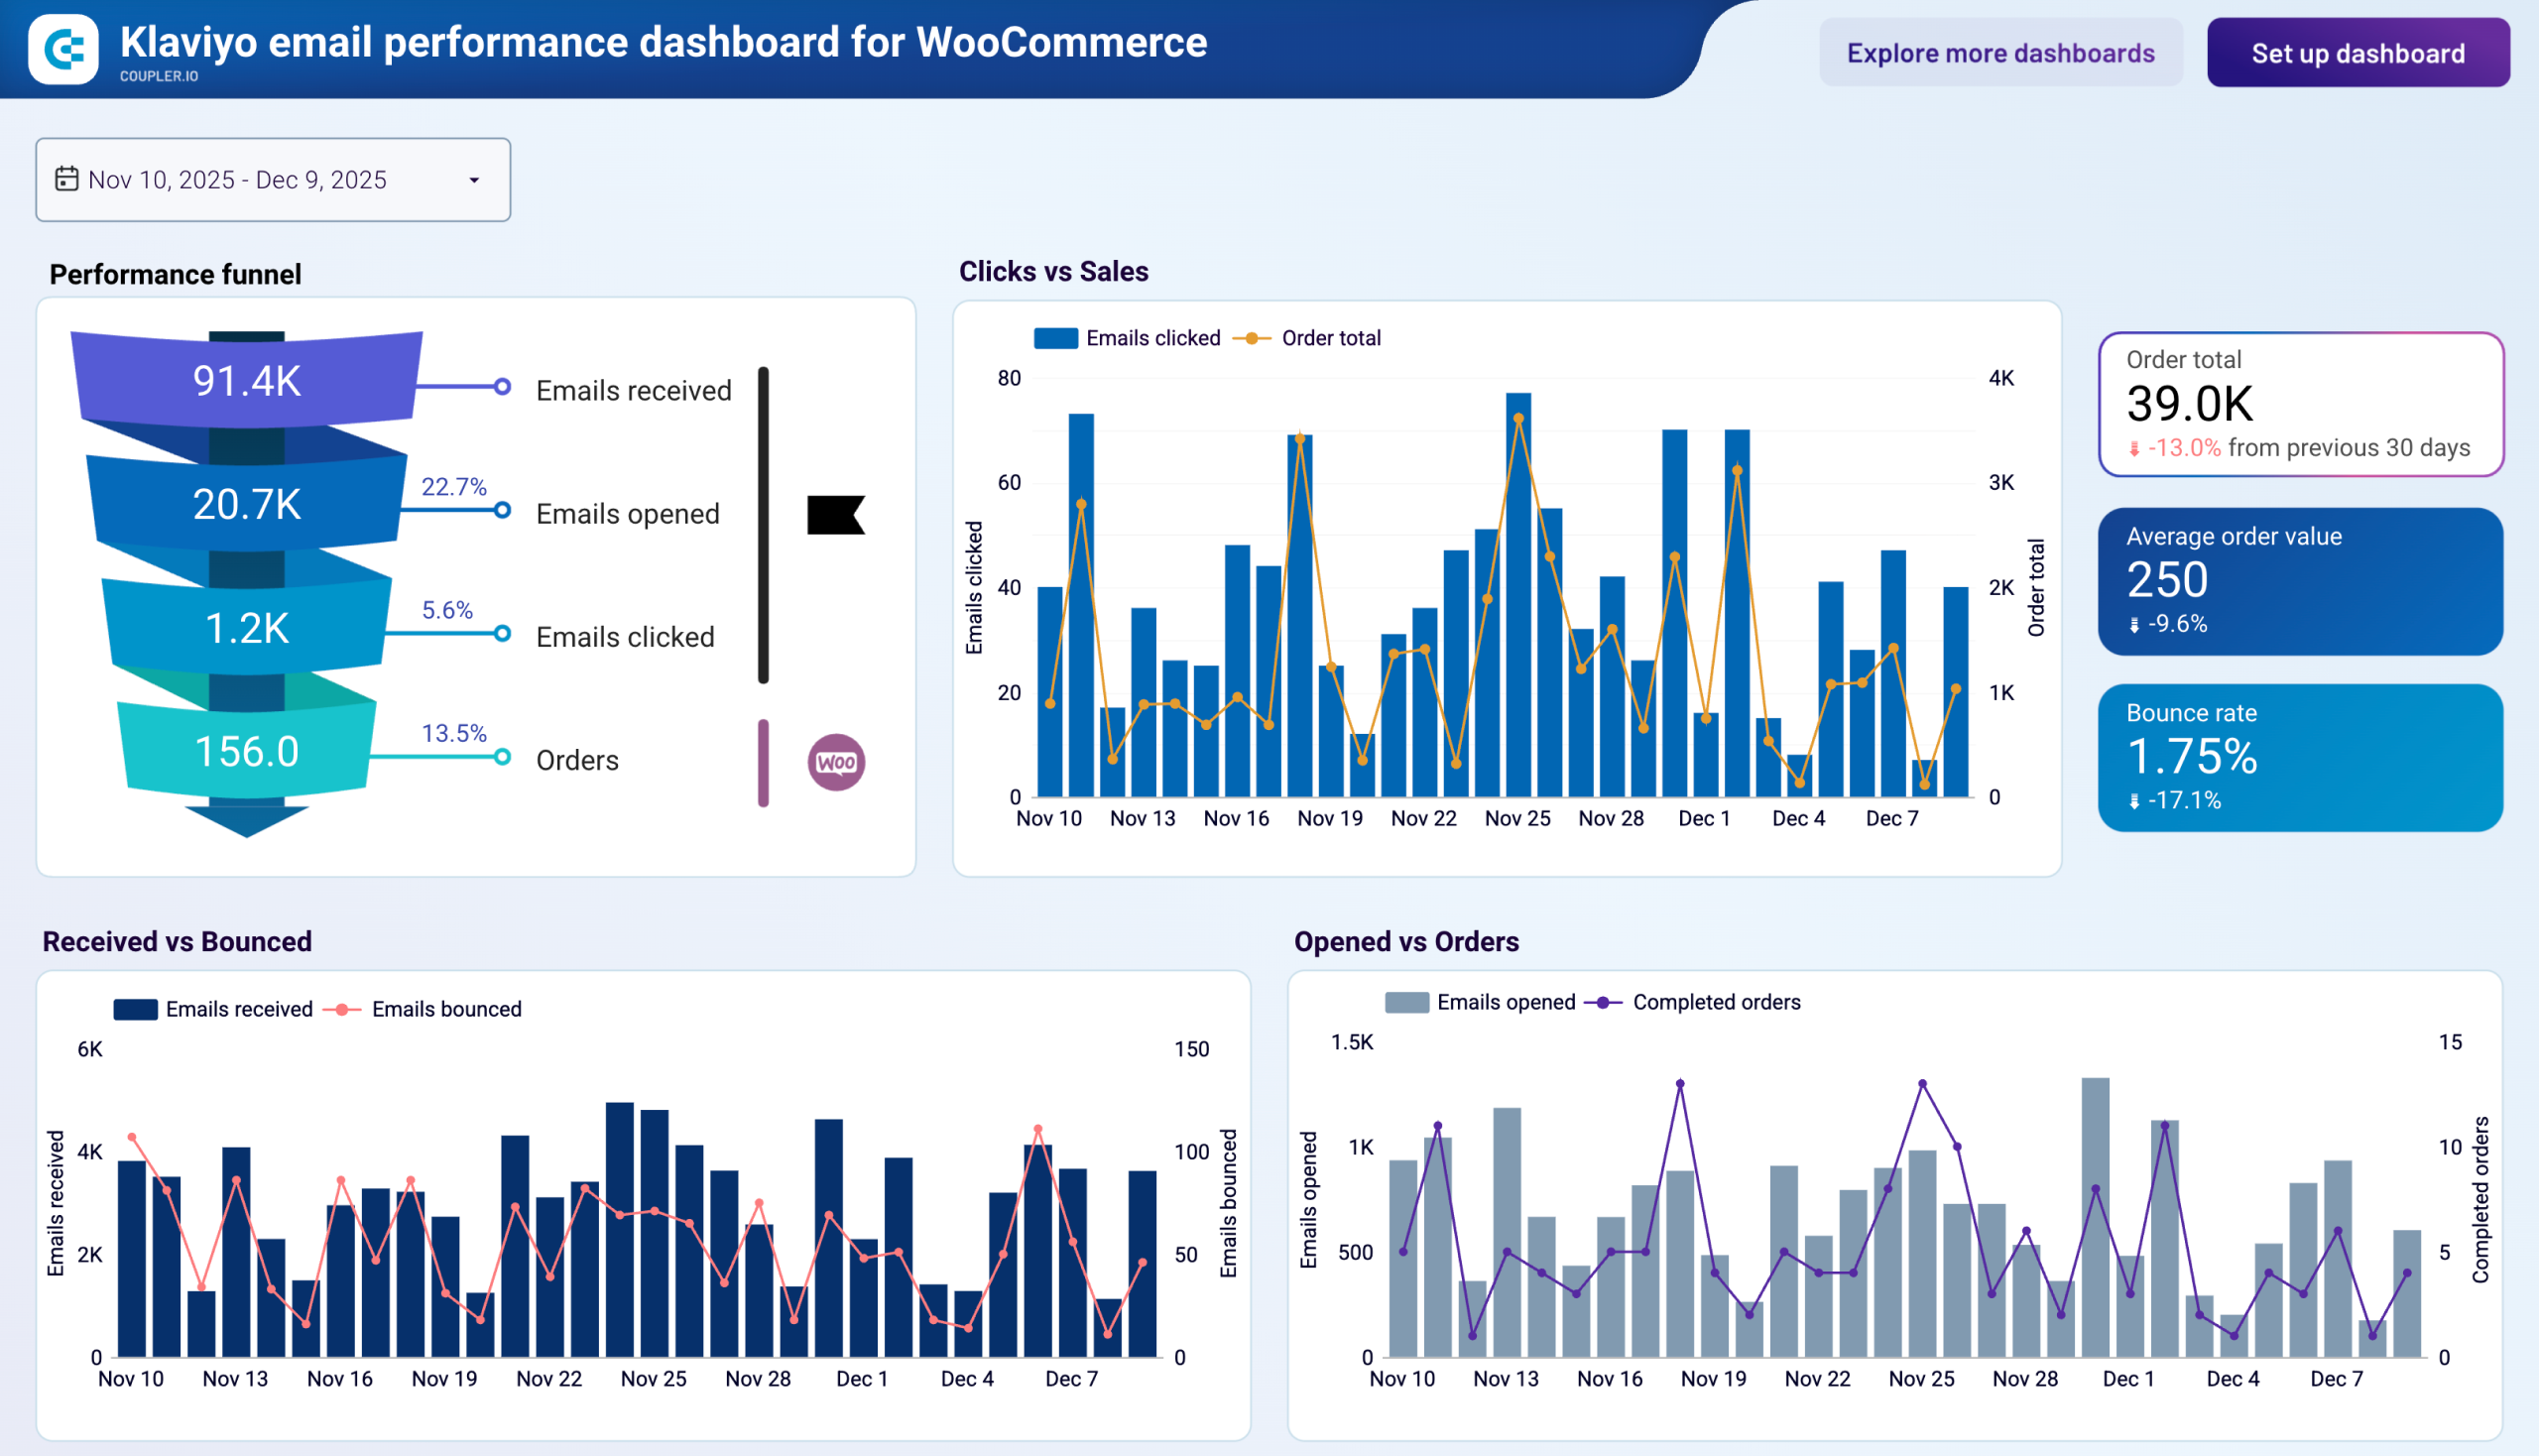
The integrated performance tracking report combines Klaviyo email metrics with website analytics to show the complete customer journey from email click to website conversion. This report connects email engagement data with website behavior metrics, revealing how email campaigns drive on-site actions beyond basic clicks. You can track which email campaigns generate the most valuable website traffic and identify opportunities to improve the email-to-website conversion process.
The subscriber retention monitoring report analyzes patterns in subscriber behavior to identify early warning signs of list attrition and engagement decline. This report tracks unsubscribe trends, engagement frequency changes, and behavioral indicators that predict subscriber churn. You can spot problematic patterns in campaign timing, content themes, or sending frequency before they lead to significant list losses.
The geographic targeting optimization report analyzes subscriber engagement patterns across different countries and regions to identify location-specific opportunities for campaign customization. This report shows which geographic markets respond best to your email campaigns and reveals regional differences in engagement timing and content preferences. You can identify high-performing regions that warrant increased focus and underperforming areas that may need localized content or timing adjustments.
What insights you can get with the Klaviyo dashboard
Decode how your audience actually consumes email content across Gmail, Apple Mail, Outlook, and other platforms to fine-tune your design and messaging approach. This granular analysis exposes which email environments generate your strongest responses. As a result, you can craft experiences that work seamlessly within your subscribers' preferred digital habits.
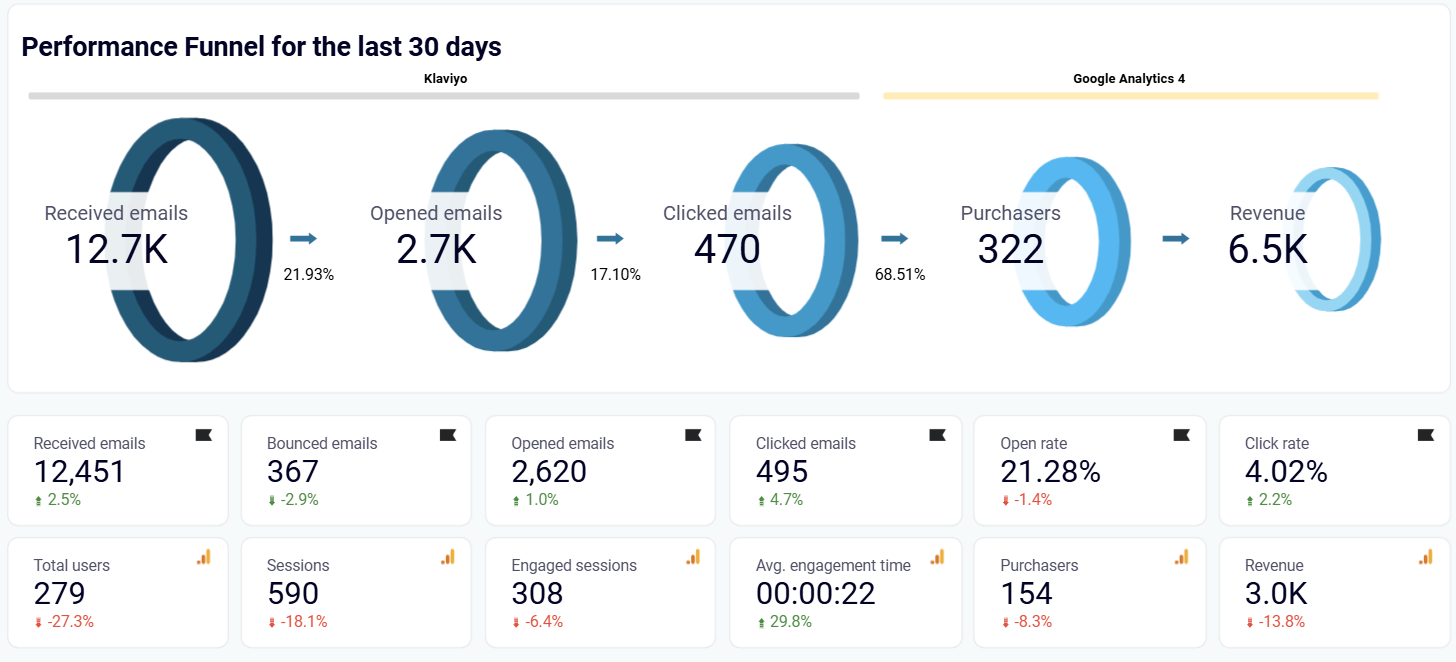
Bridge the gap between email clicks and website conversions by connecting Klaviyo engagement data with Google Analytics behavioral insights. This unified perspective shows exactly how email traffic behaves once it reaches your website, revealing which campaigns drive the most valuable visitor actions beyond simple click metrics.
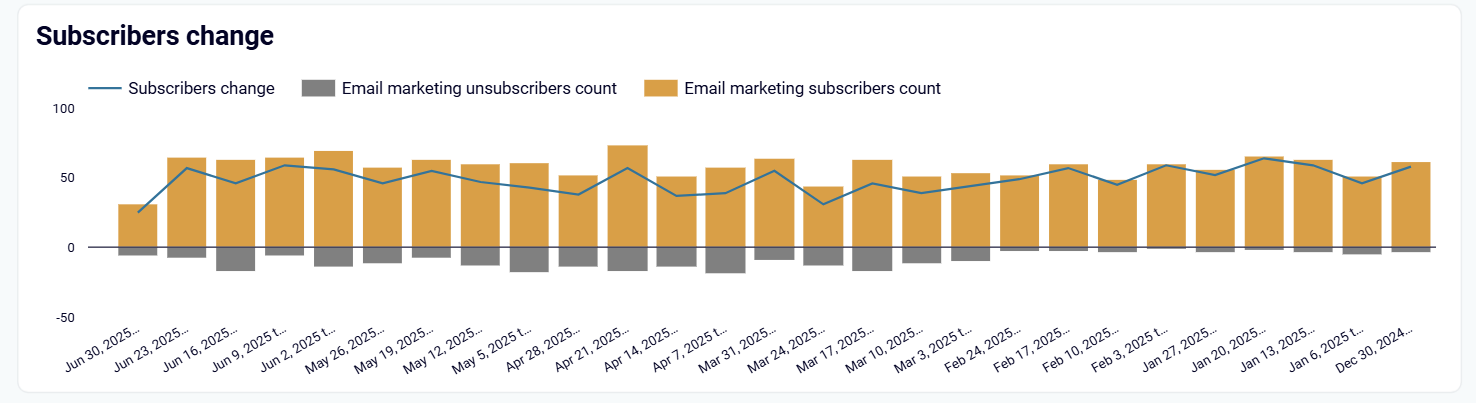
Stay ahead of list attrition by identifying the specific triggers that prompt subscribers to opt out of your communications. This early warning system helps you recognize problematic patterns in content, frequency, or timing before they escalate into significant churn events.
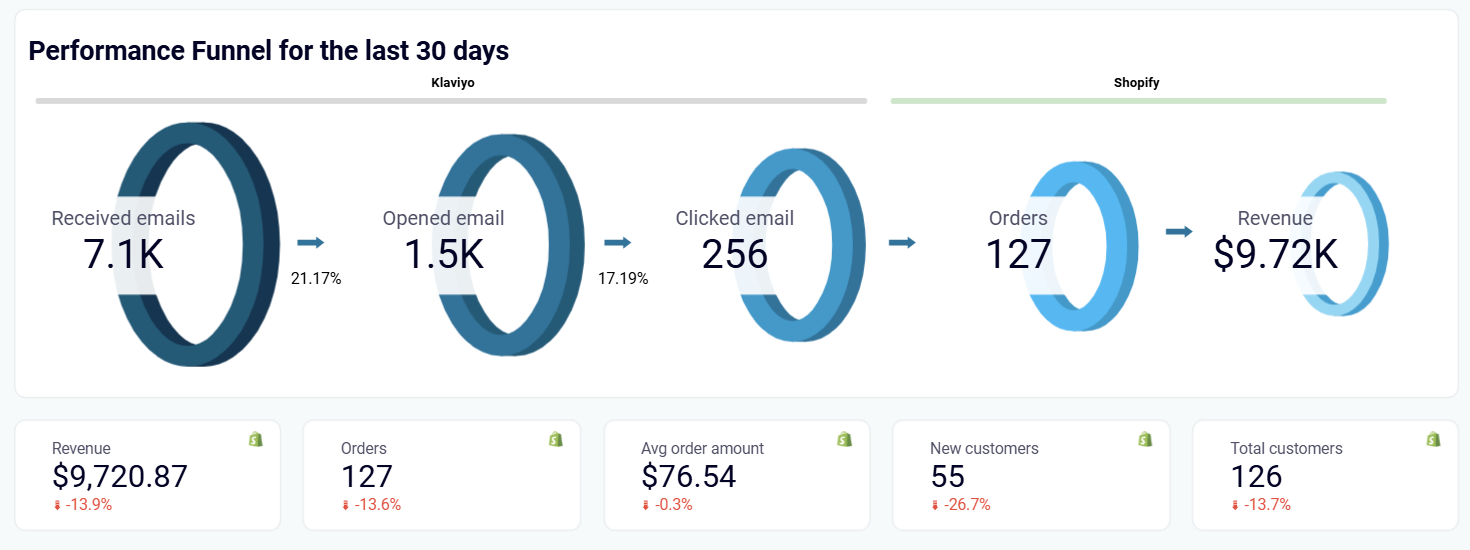
Map the complete financial journey from email delivery to purchase completion, quantifying exactly how your campaigns contribute to bottom-line business results. This end-to-end revenue visibility enables data-driven decisions about campaign investment and strategy optimization based on actual profit generation.
How to create a Klaviyo dashboard?

Metrics you can track with Klaviyo dashboard templates
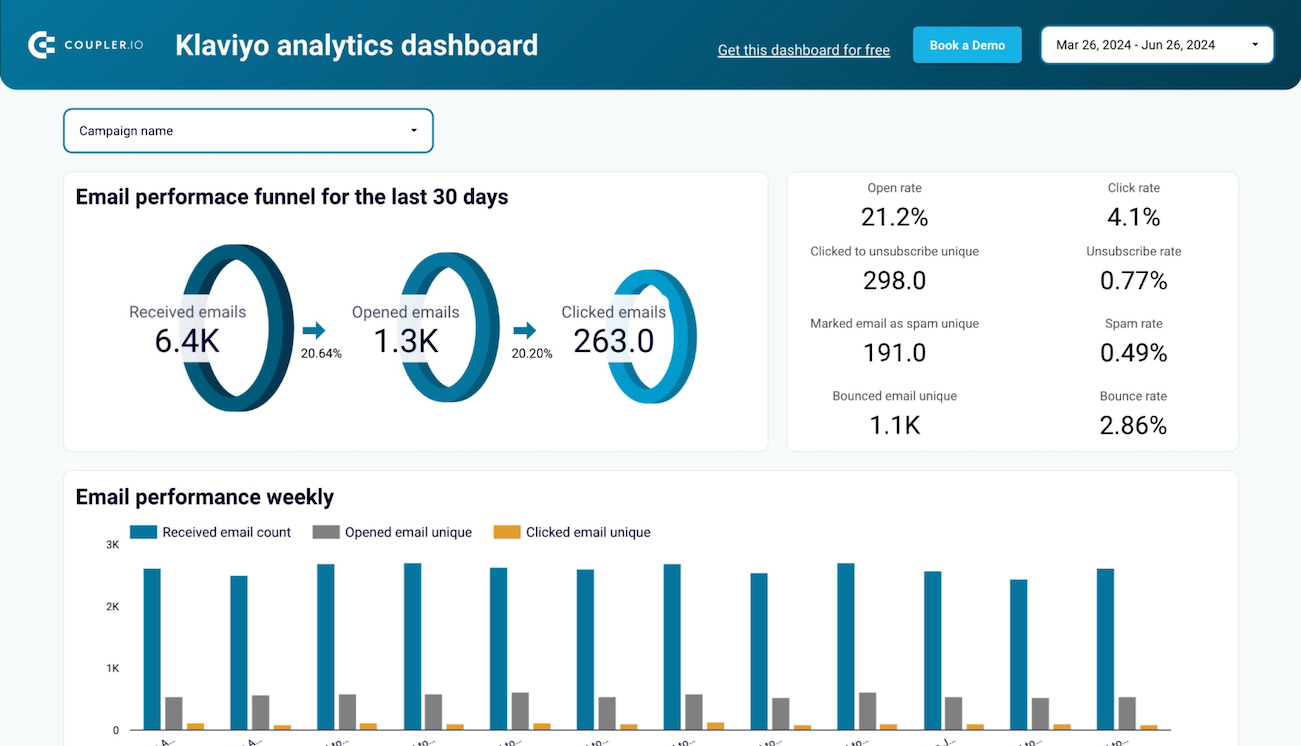
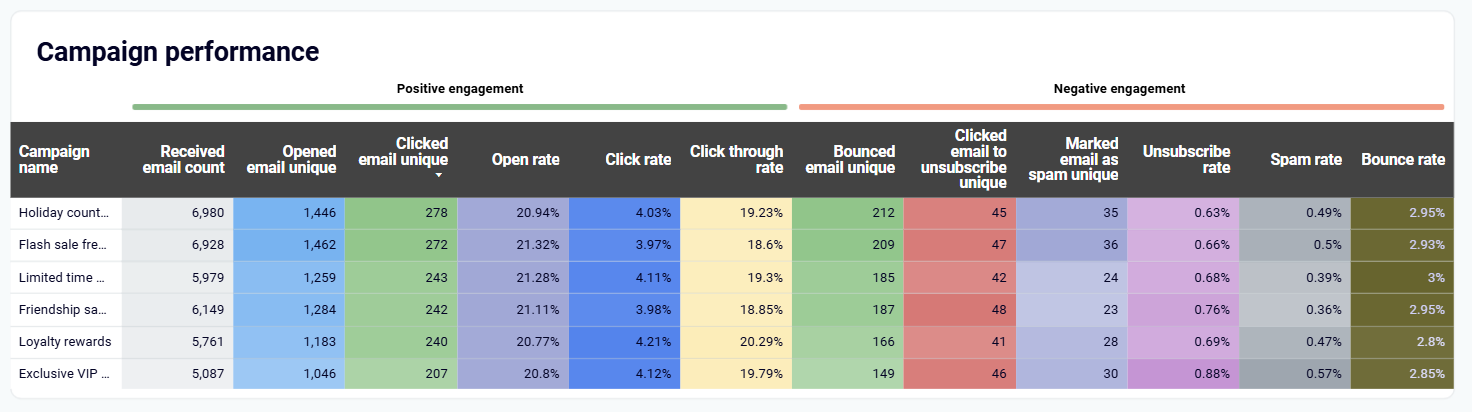
Monitor the percentage of delivered emails that subscribers open to evaluate subject line effectiveness and overall campaign appeal. This metric reveals how well your email content attracts subscriber attention and helps you optimize subject lines, sender names, and send timing for better initial engagement.
Measure the percentage of email recipients who engage with links within your campaigns to assess content relevance and call-to-action strength. This metric indicates how compelling your email content is and guides optimization efforts for driving more website traffic and conversions.
Track the percentage of subscribers who opt out after receiving your campaigns to identify content or frequency issues that may be driving list attrition. Understanding unsubscribe patterns helps you maintain list health and adjust your email strategy to preserve subscriber relationships.
Monitor how often subscribers mark your emails as spam to protect your sender reputation and identify potential deliverability issues. High spam rates can damage your ability to reach subscriber inboxes and require immediate attention to content and sending practices.
Calculate the percentage of emails that fail to reach recipients due to invalid addresses or delivery problems to maintain email list quality. Monitoring bounce rates helps you identify problematic email addresses and protect your sender reputation from deliverability challenges.
Measure how long subscribers spend reading and interacting with your email content to understand attention levels and content effectiveness. This metric reveals whether your emails capture and hold subscriber interest, helping you optimize content length and design for maximum engagement.
Track the total income generated from email marketing campaigns to measure the direct financial impact of your email efforts. This metric connects your email marketing activities to business outcomes and helps you calculate return on investment for different campaign types.
Monitor subscribers who click through your emails but then proceed to unsubscribe, indicating potential issues with landing page experience or campaign promise fulfillment. This metric helps identify disconnects between email content and subscriber expectations, enabling better campaign alignment.