Instagram dashboard examples and reporting templates
Track your Instagram content performance, audience behavior, and advertising effectiveness with automated reporting dashboards. These templates consolidate metrics from Instagram Business accounts and Meta Ads to show how your posts perform, who engages with your content, and which campaigns drive the best results for your brand.
Instagram dashboard examples for every need


 +6
+6


 +6
+6

about your case. It doesn't cost you a penny 😉
Choose your Instagram dashboard template to kick off
What is an Instagram reporting dashboard?
Unlike native Instagram Insights that require manual checking and provide limited historical data, an Instagram reporting dashboard connects directly to your accounts through automated data integration. This approach eliminates manual reporting work and provides longer historical periods for trend analysis. When you connect advertising data alongside organic metrics, you gain visibility into how paid promotions and organic content work together to build your audience and drive profile actions.

What reports should be included on a meaningful Instagram analytics dashboard?
Building an effective Instagram analytics dashboard requires selecting reports that address different aspects of your social media strategy. The following four report types provide visibility into content performance, cross-platform effectiveness, marketing contribution, and the relationship between organic and paid efforts. Each report serves distinct analytical needs while connecting to create a complete picture of your Instagram presence.
This report tracks granular metrics for each piece of content you publish, showing views, reach, engagements, likes, comments, shares, saves, follows, and profile actions per post. Rather than looking at aggregated account metrics, this view reveals which specific posts drive the most valuable actions from your audience. You can identify content formats that generate high saves versus posts that drive profile visits, helping you replicate successful approaches and understand what motivates different audience behaviors.
The post-level analysis becomes particularly valuable when you manage multiple content strategies simultaneously—such as educational content, promotional posts, and behind-the-scenes material. By comparing performance across these categories, you discover which content types deliver against specific business objectives. For example, tutorial posts might generate high saves while product announcements drive more profile clicks and website visits.
The cross-platform report positions your Instagram performance alongside other social networks like Facebook, LinkedIn, and YouTube in a unified measurement framework. This comparative view shows how Instagram contributes to your broader social media strategy by displaying metrics like impressions, page views, and engagement rates across all platforms simultaneously. You can quickly identify whether Instagram drives more traffic to your website than other channels or which platform generates higher engagement from comparable audience sizes.
This Instagram marketing dashboard perspective helps with resource allocation decisions when you manage presence across multiple social networks. If Instagram consistently outperforms other platforms in driving website traffic or generating qualified leads, you can justify increasing content investment there. Conversely, if engagement rates lag behind other channels despite similar posting frequency, the data prompts strategy adjustments specific to Instagram's algorithm and audience preferences.
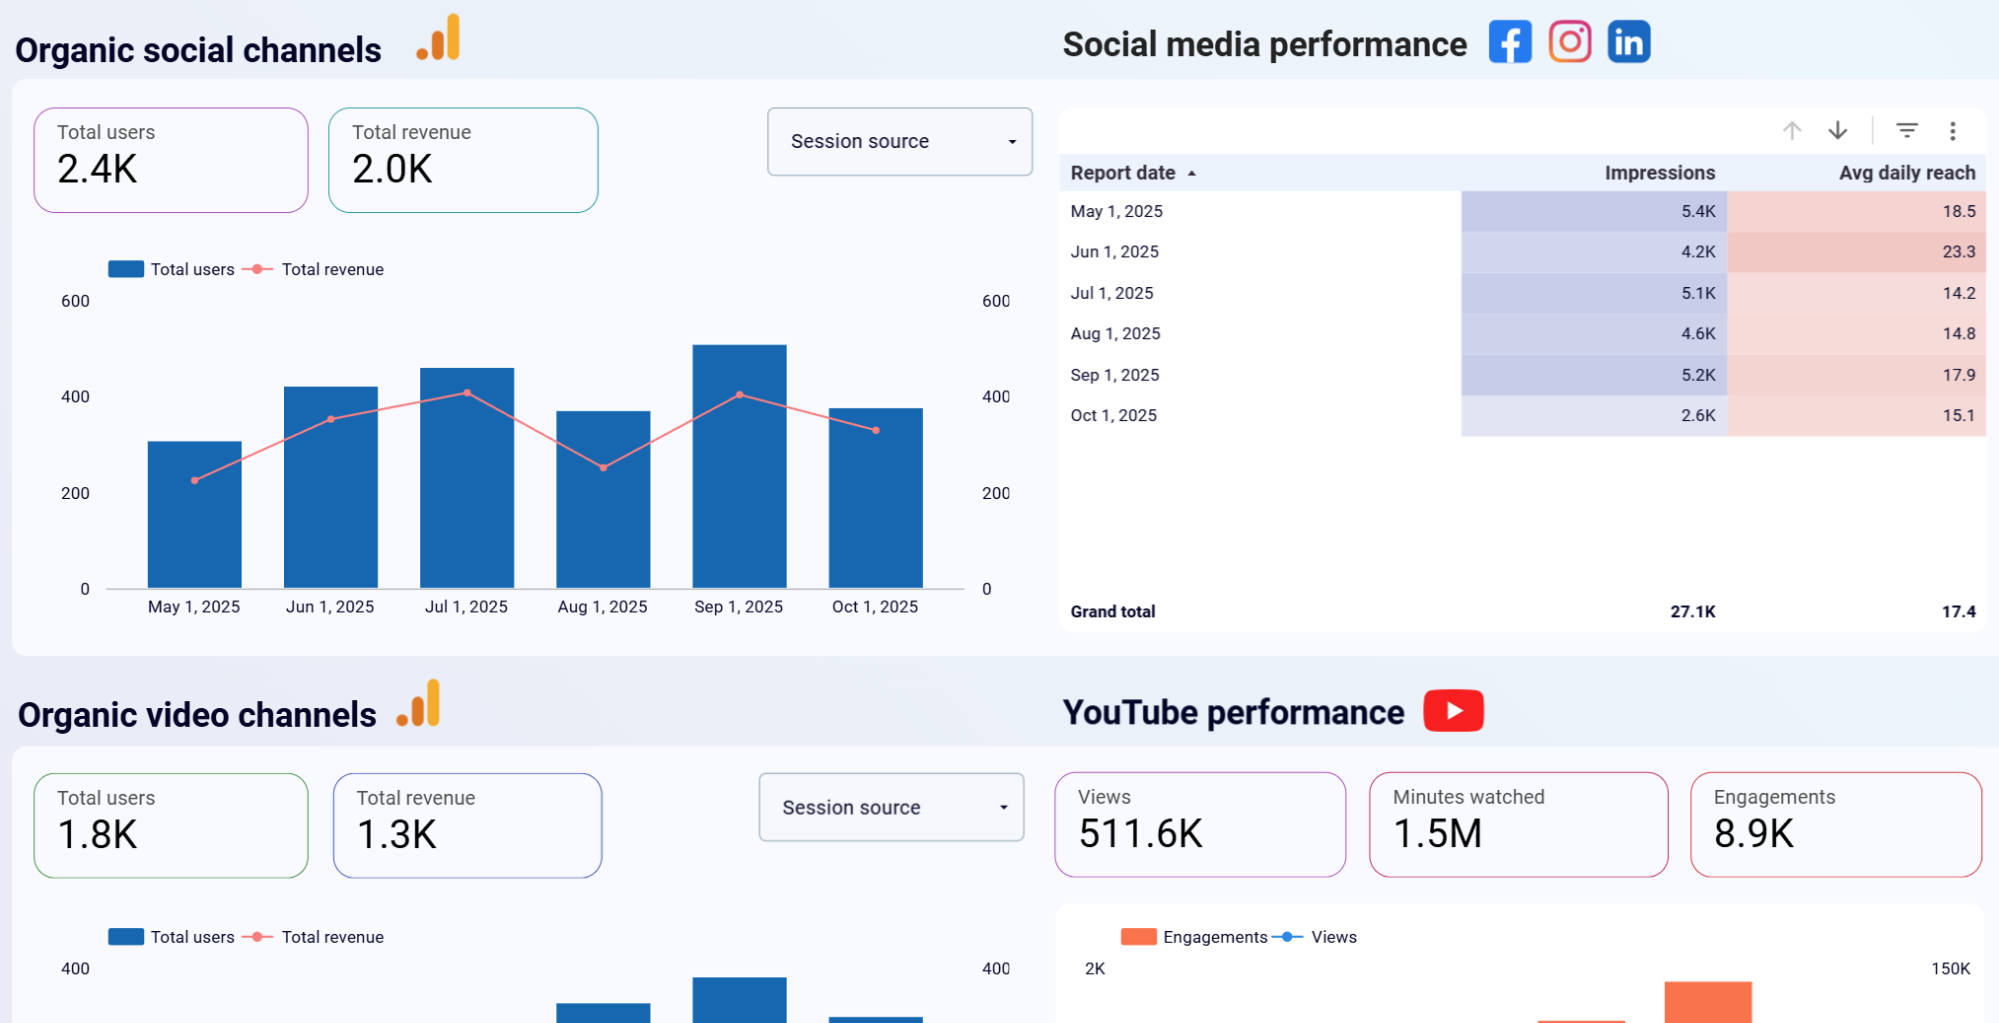
This report situates Instagram within your complete marketing ecosystem by displaying social media metrics alongside performance from paid advertising, organic search, email campaigns, and video marketing. The comprehensive view reveals how Instagram social media efforts contribute to overall marketing outcomes by tracking metrics like traffic generation, user acquisition, and conversion assistance across all channels. You see whether Instagram posts drive more new users to your website than email campaigns or how social engagement correlates with search traffic patterns.
Understanding Instagram's role in the full marketing mix becomes essential when planning budget allocation and campaign timing. If Instagram drives significant awareness that later converts through search or email channels, you can recognize the platform's value beyond direct attribution. This broader context prevents undervaluing Instagram's contribution when users engage with content but complete conversions through other channels
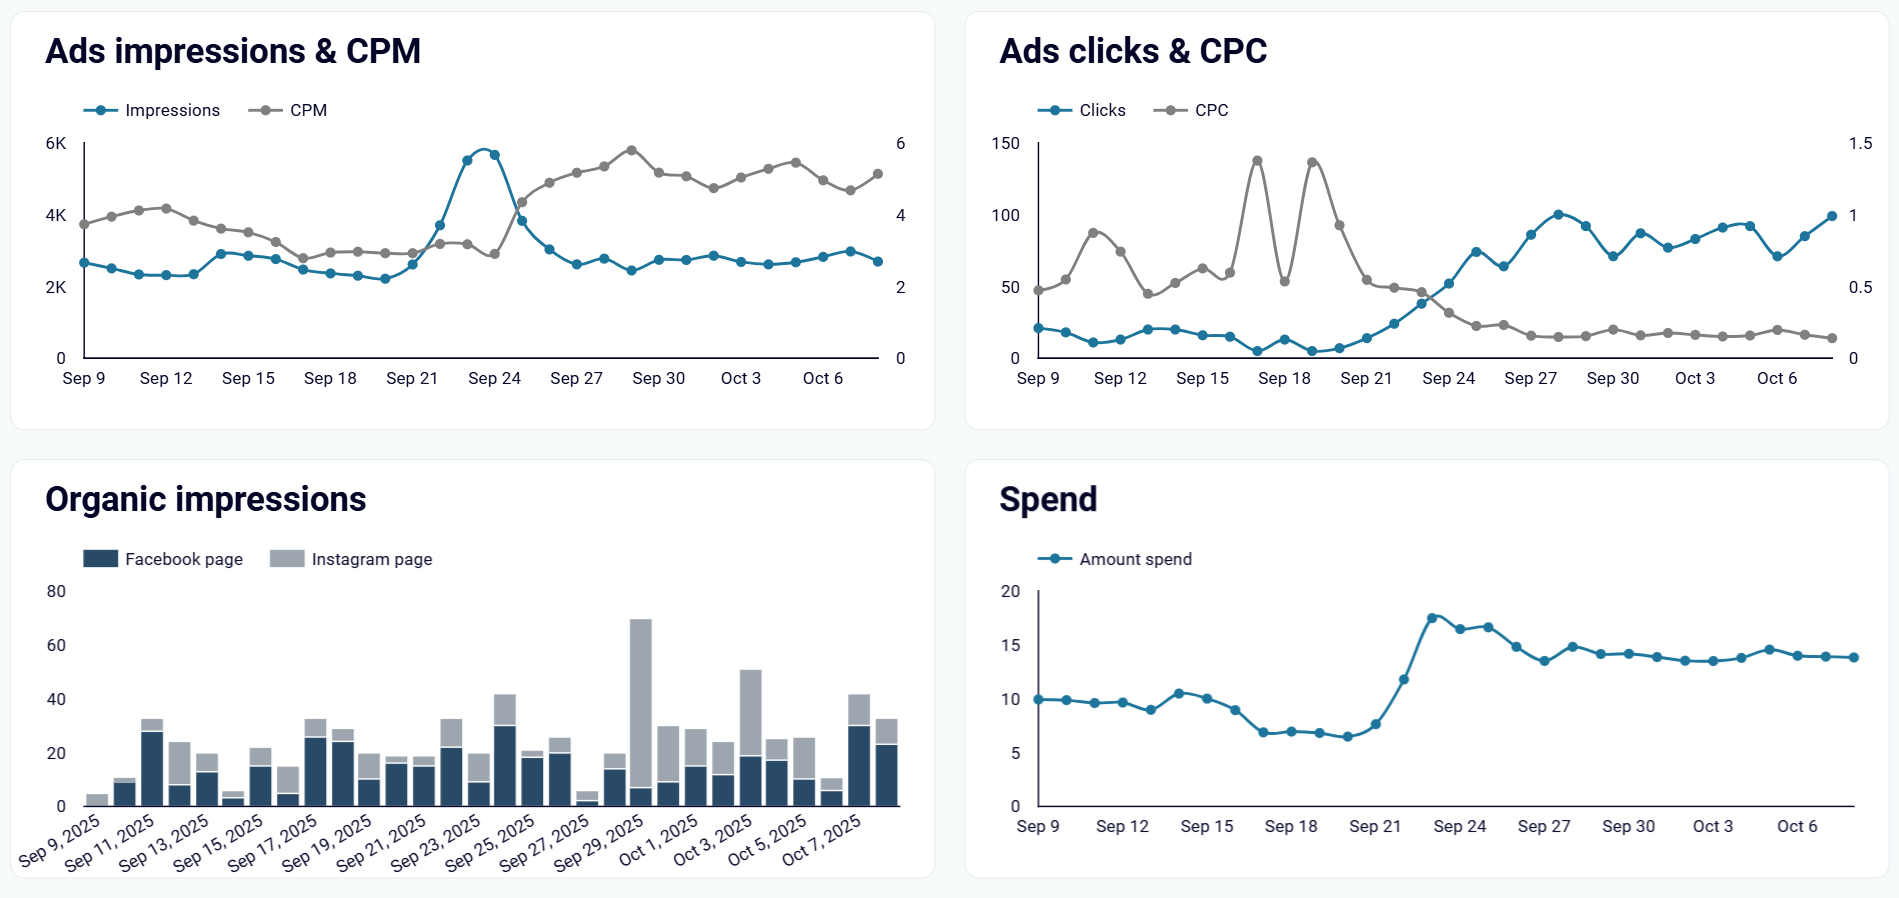
This report compares Instagram advertising metrics with organic page performance to show how paid promotions and unpaid content work together. The side-by-side view displays ad impressions, clicks, costs, and conversions alongside organic reach, engagement, and follower growth. Column charts reveal patterns like increased organic engagement following paid campaigns or periods when organic content performs strongly without advertising support. This comparison helps you understand whether paid promotion amplifies organic growth or if the two efforts operate independently.
Analyzing the paid-organic relationship guides decisions about when to boost content, how much to invest in advertising, and whether organic strategies need adjustment. If paid campaigns consistently drive follower growth that leads to sustained organic engagement, you can justify ongoing advertising investment. Alternatively, if organic reach declines despite heavy ad spending, the data suggests algorithm or content quality issues that money alone won't solve
What insights you can get with a dashboard for Instagram

Track detailed metrics per post, including views, reach, engagements, likes, comments, shares, saves, follows, and profile actions to understand which content types drive the most valuable audience behaviors. This granular analysis reveals whether educational posts generate more saves, product announcements drive profile visits, or behind-the-scenes content increases follower loyalty.

Compare Instagram performance against Facebook, LinkedIn, and YouTube in a unified view showing impressions, page views, and engagement rates across all channels. This cross-platform perspective reveals whether Instagram delivers better engagement rates than other networks or which platform drives more website traffic from comparable audience sizes.
Monitor Instagram social media metrics as part of broader marketing channel analysis that includes paid advertising, organic search, email campaigns, and video content. This comprehensive view shows how Instagram traffic and engagement compare to other marketing channels and whether social efforts drive measurable business outcomes beyond platform-specific metrics.
Analyze Instagram organic page performance alongside paid advertising results through column charts showing ad impressions, costs, and conversions next to organic reach, engagement, and follower growth. This comparison reveals whether paid campaigns amplify organic results or if the two strategies operate independently, guiding budget allocation decisions.
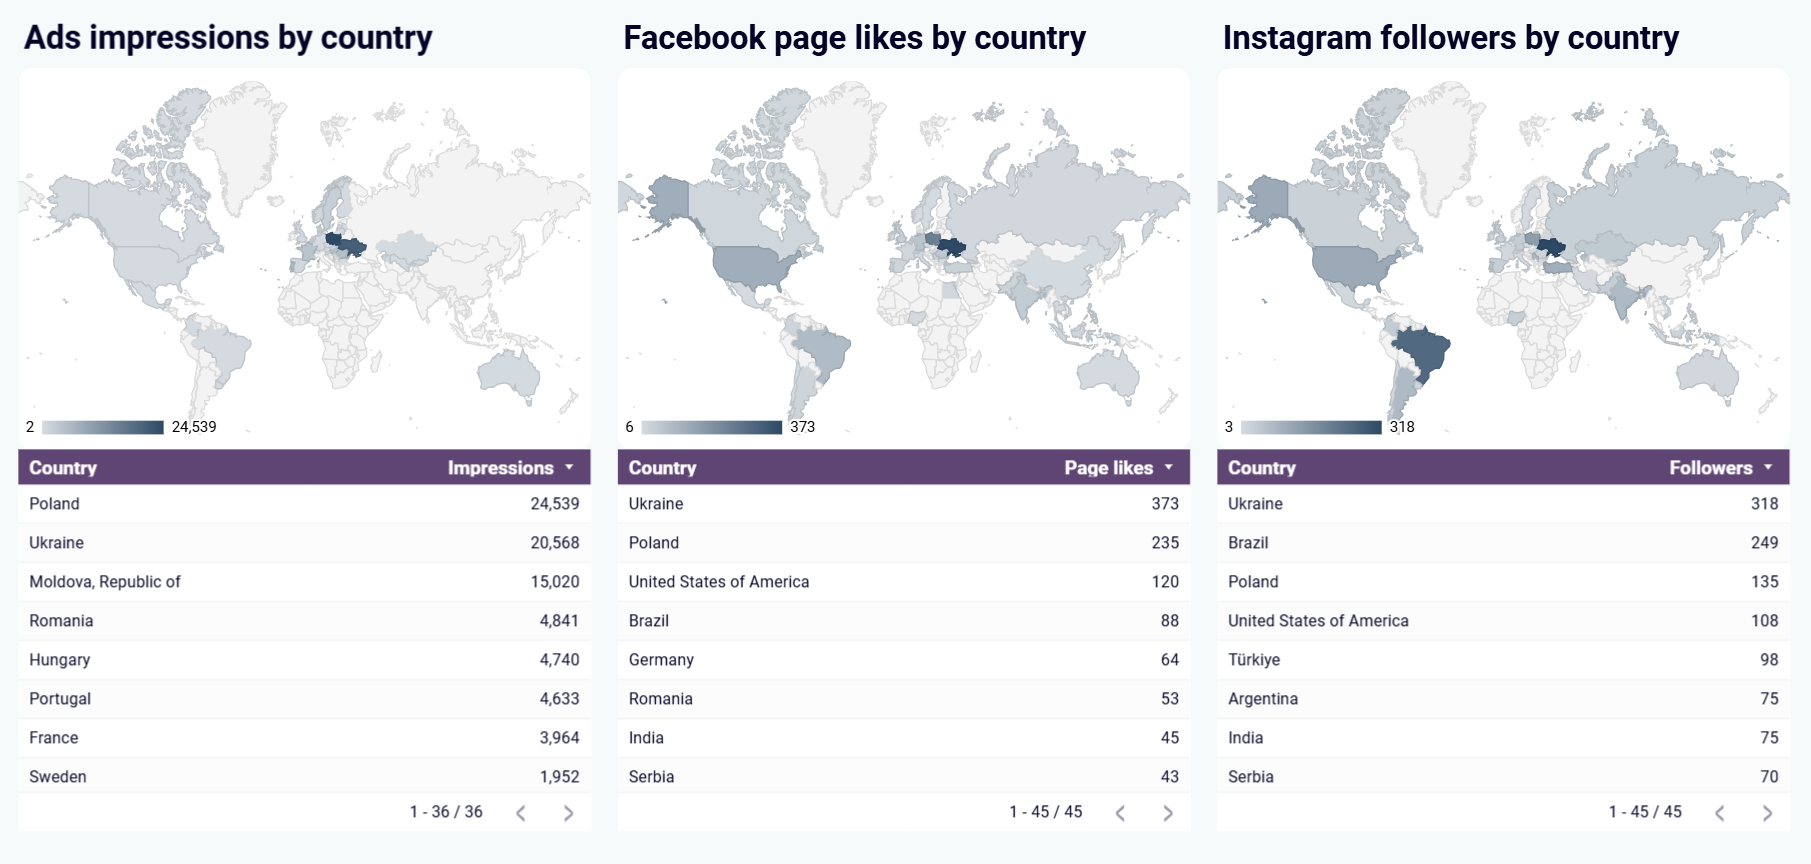
The dashboard reveals where your audience is located through detailed geographic visualizations. You can see exactly which countries, regions, and cities your followers come from, helping you understand the global or local reach of your content. This location data is invaluable for tailoring content to specific markets, planning location-based campaigns, or identifying untapped regions for growth. Understanding audience geography helps align your Instagram strategy with business objectives in target markets.
How to create an Instagram dashboard?

Metrics you can track with an Instagram dashboard templates
Monitor your total follower count alongside subscribers gained and lost within specific periods to understand audience growth patterns. This metric reveals whether your content strategy attracts new followers consistently or if growth occurs in spikes around specific campaigns. Tracking net subscriber change helps you identify content that drives unfollows and adjust your approach accordingly.
Track how many unique accounts see your content (reach) versus total views at the post level to understand content distribution beyond your follower base. High reach relative to follower count indicates strong algorithmic amplification or discovery through hashtags and explore pages. Comparing reach to views shows whether content gets watched multiple times by engaged audience members.
Measure the proportion of viewers who take action on your content through likes, comments, shares, saves, and profile visits. Engagement rate provides normalized comparison across posts with different reach levels, revealing which content formats drive the strongest audience response. Tracking specific interaction types shows whether content inspires conversation (comments), sharing (sends), or future reference (saves).
Monitor direct response metrics, including profile link clicks, website visits, and get directions actions that indicate commercial intent. These metrics show whether your content successfully drives traffic beyond Instagram to your website or physical location. Increasing profile actions suggests improving content relevance and call-to-action effectiveness.
Track how many times your content appears in feeds and stories, with specific focus on video view duration and completion rates. View counts indicate content visibility while video metrics reveal whether your content holds attention. Declining view duration suggests content pacing issues or misalignment with audience preferences.
Measure how many people see your promoted content and how frequently ads appear to the same users through impression and reach data from Meta Ads. High impression-to-reach ratios indicate users seeing ads multiple times (frequency), which can improve recall but risks ad fatigue. Monitoring these metrics helps optimize budget efficiency and audience targeting.
Track advertising cost efficiency through CPC (cost per click) and CPM (cost per thousand impressions) metrics that reveal bidding effectiveness and competitive pressure. Rising costs signal increased competition for your target audience or declining ad relevance scores. Comparing costs across campaigns identifies the most efficient approaches to Instagram advertising.
Monitor how often users save your posts for later reference or share content with others, indicating high value or utility. Save rates typically correlate with educational or inspirational content that users want to revisit, while shares suggest content resonates strongly enough to recommend to friends. These metrics often predict long-term content performance better than immediate likes.
Track not just comment volume but also the nature and depth of conversations your content generates. High comment counts with substantive discussions indicate strong community engagement, while many single-word comments might reflect superficial interaction. Monitoring reply rates to comments shows whether you're building genuine dialogue with your audience.
Understand who follows and engages with your content through age, gender, and geographic breakdowns. This demographic data reveals whether you're reaching intended target audiences or attracting different segments than expected. Shifts in audience composition over time indicate changing content appeal or algorithmic distribution patterns affecting who sees your posts.