Influencer dashboard examples and reporting templates
Track content performance, audience engagement, and growth metrics across Instagram, TikTok, and YouTube with automated influencer dashboards that consolidate data from multiple social platforms into real-time visual reports.
Influencer dashboard examples for every need


about your case. It doesn't cost you a penny 😉
Choose your white label influencer dashboard template to kick off
What is an influencer dashboard?
The influencer marketing analytics dashboard eliminates manual data collection by automatically pulling metrics from connected accounts and presenting them in easy-to-understand visualizations. Influencer dashboard templates by Coupler.io refresh on a schedule, ensuring real-time visibility into campaign performance. Whether managing a single account or multiple influencer partnerships, these influencer dashboard templates provide the insights needed to optimize content strategy, negotiate sponsorships, and demonstrate channel value to potential partners.

What reports should be included in influencer dashboards?
Building an effective influencer marketing dashboard requires selecting reports that provide actionable insights into audience behavior and content effectiveness. The following reports form the foundation of influencer performance tracking:
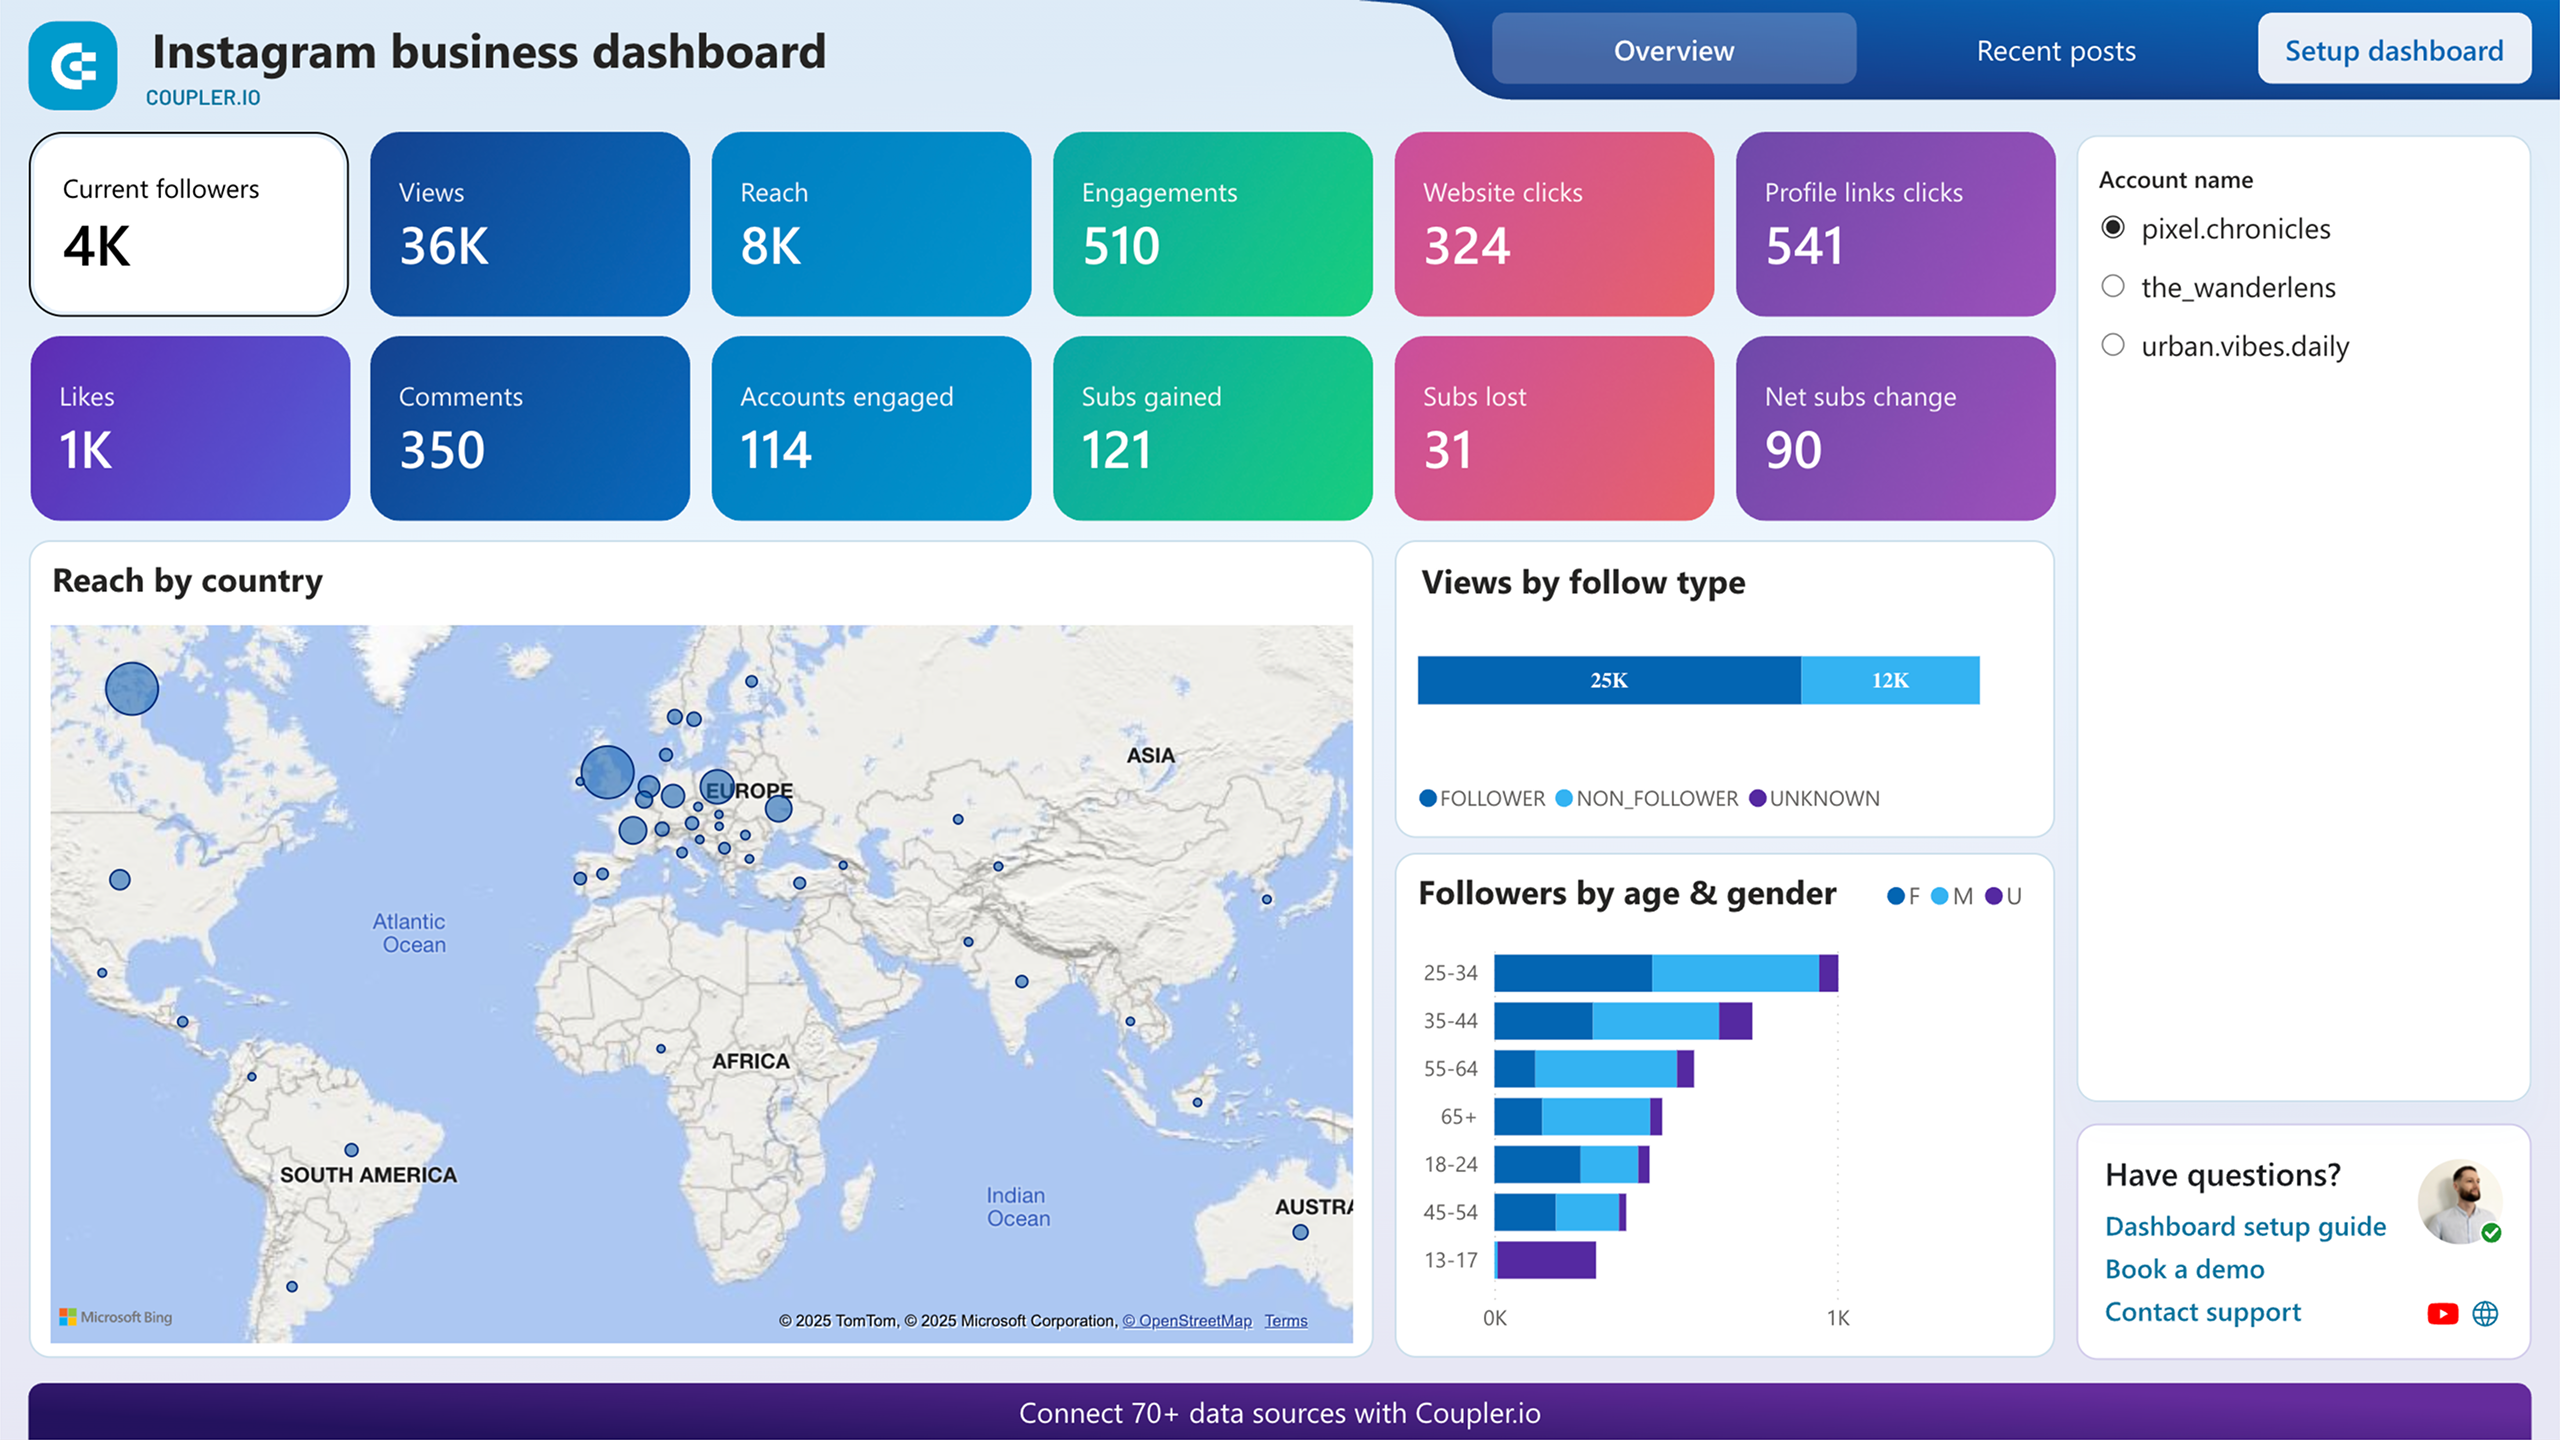
This report consolidates metrics from Instagram, TikTok, and YouTube accounts in a single view, displaying followers, views, reach, engagements, likes, comments, and shares across all connected platforms. Account switching capabilities enable comparison between different profiles or client accounts. The multi-platform view is particularly valuable for agencies managing multiple influencer partnerships or creators maintaining presence across several channels.
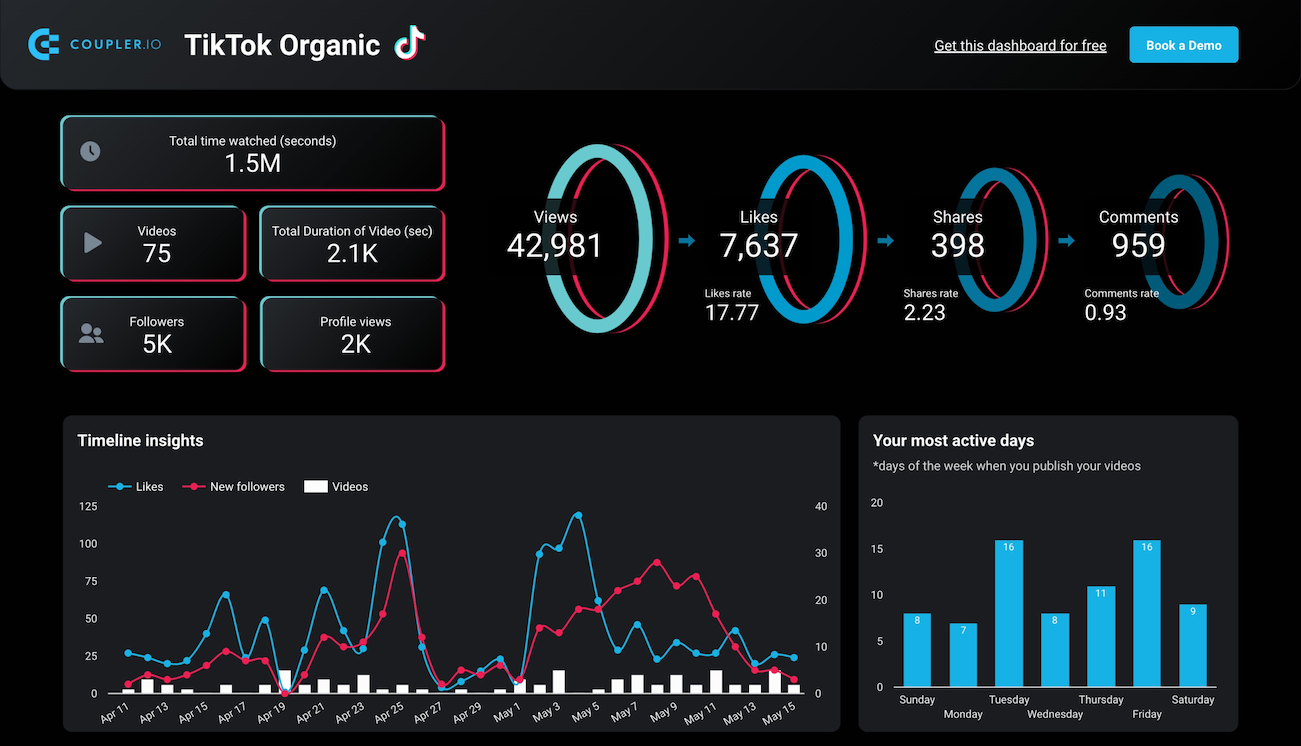
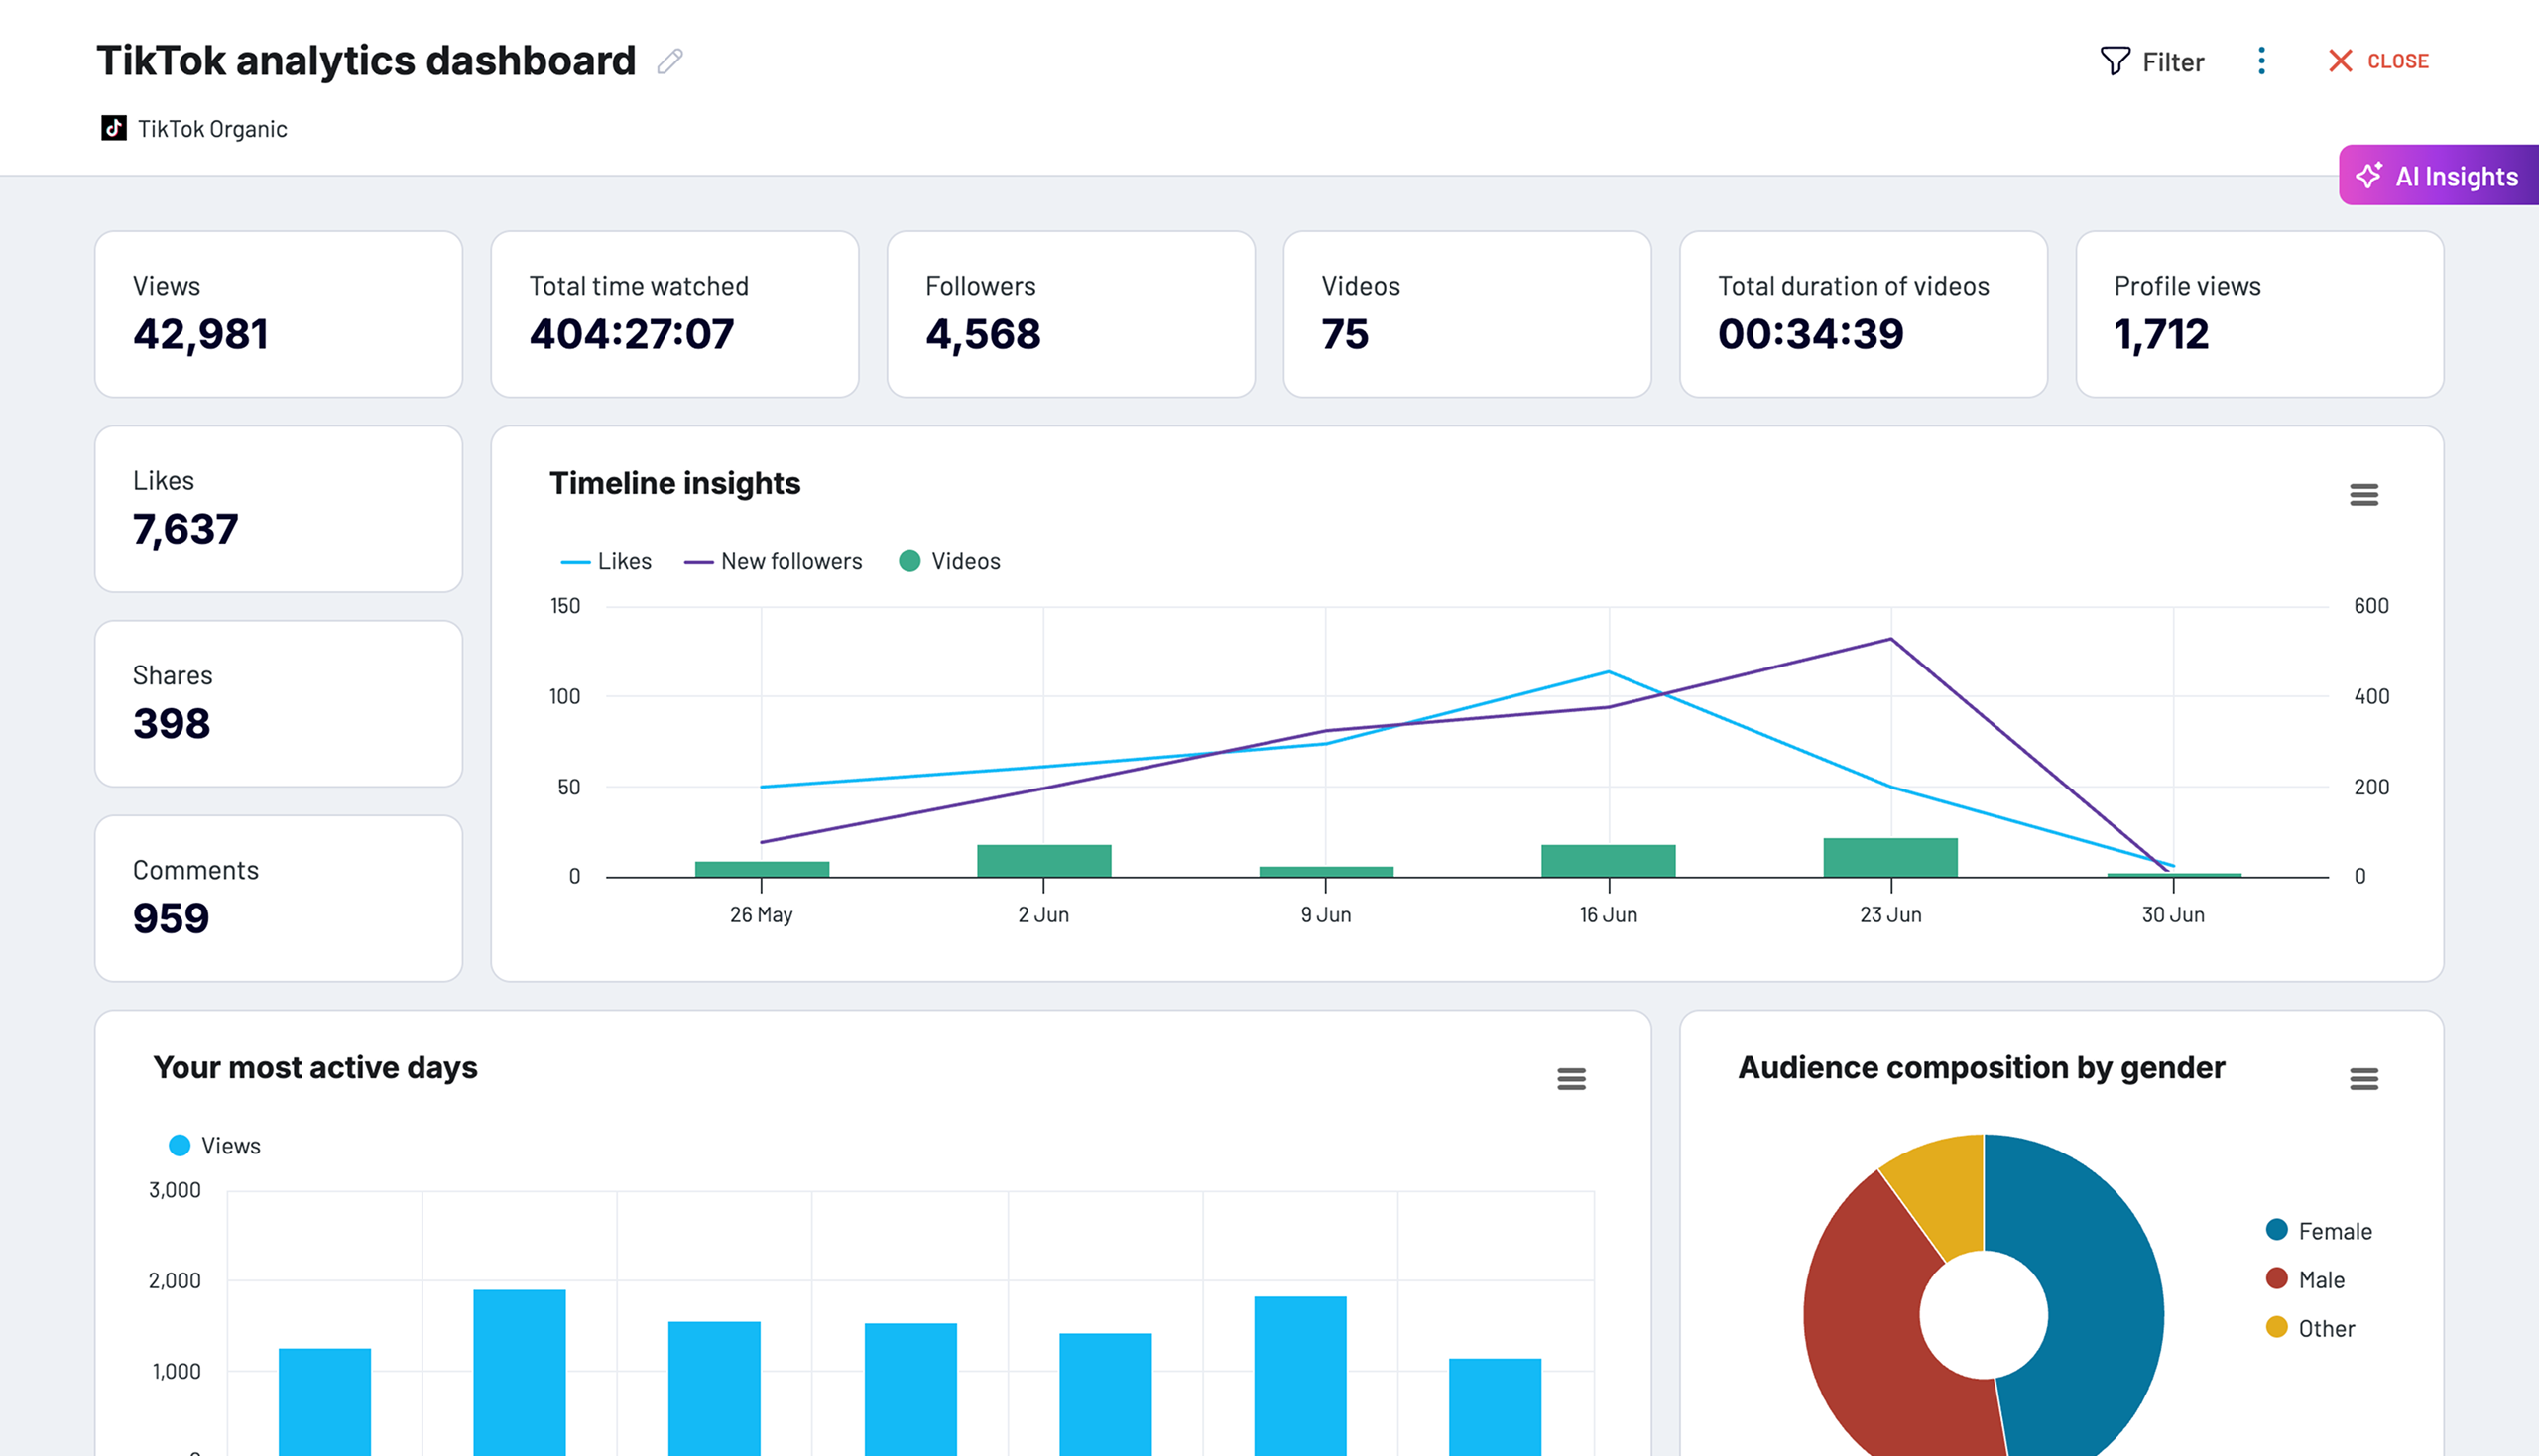
The engagement funnel report tracks how audiences interact with content across the conversion path, from initial views through likes, shares, and comments. For TikTok content, the funnel visualizes the progression from video views to engagement actions, revealing conversion rates at each stage. For Instagram content, the funnel shows how reach translates into profile visits, website clicks, and direct actions.
This report monitors follower acquisition and loss over time, displaying net subscriber changes with daily or weekly breakdowns. For YouTube channels, it tracks which videos attract new subscribers versus content that causes audience loss. Instagram Business reports show subscriber gains and losses alongside engagement patterns to correlate content types with follower behavior.
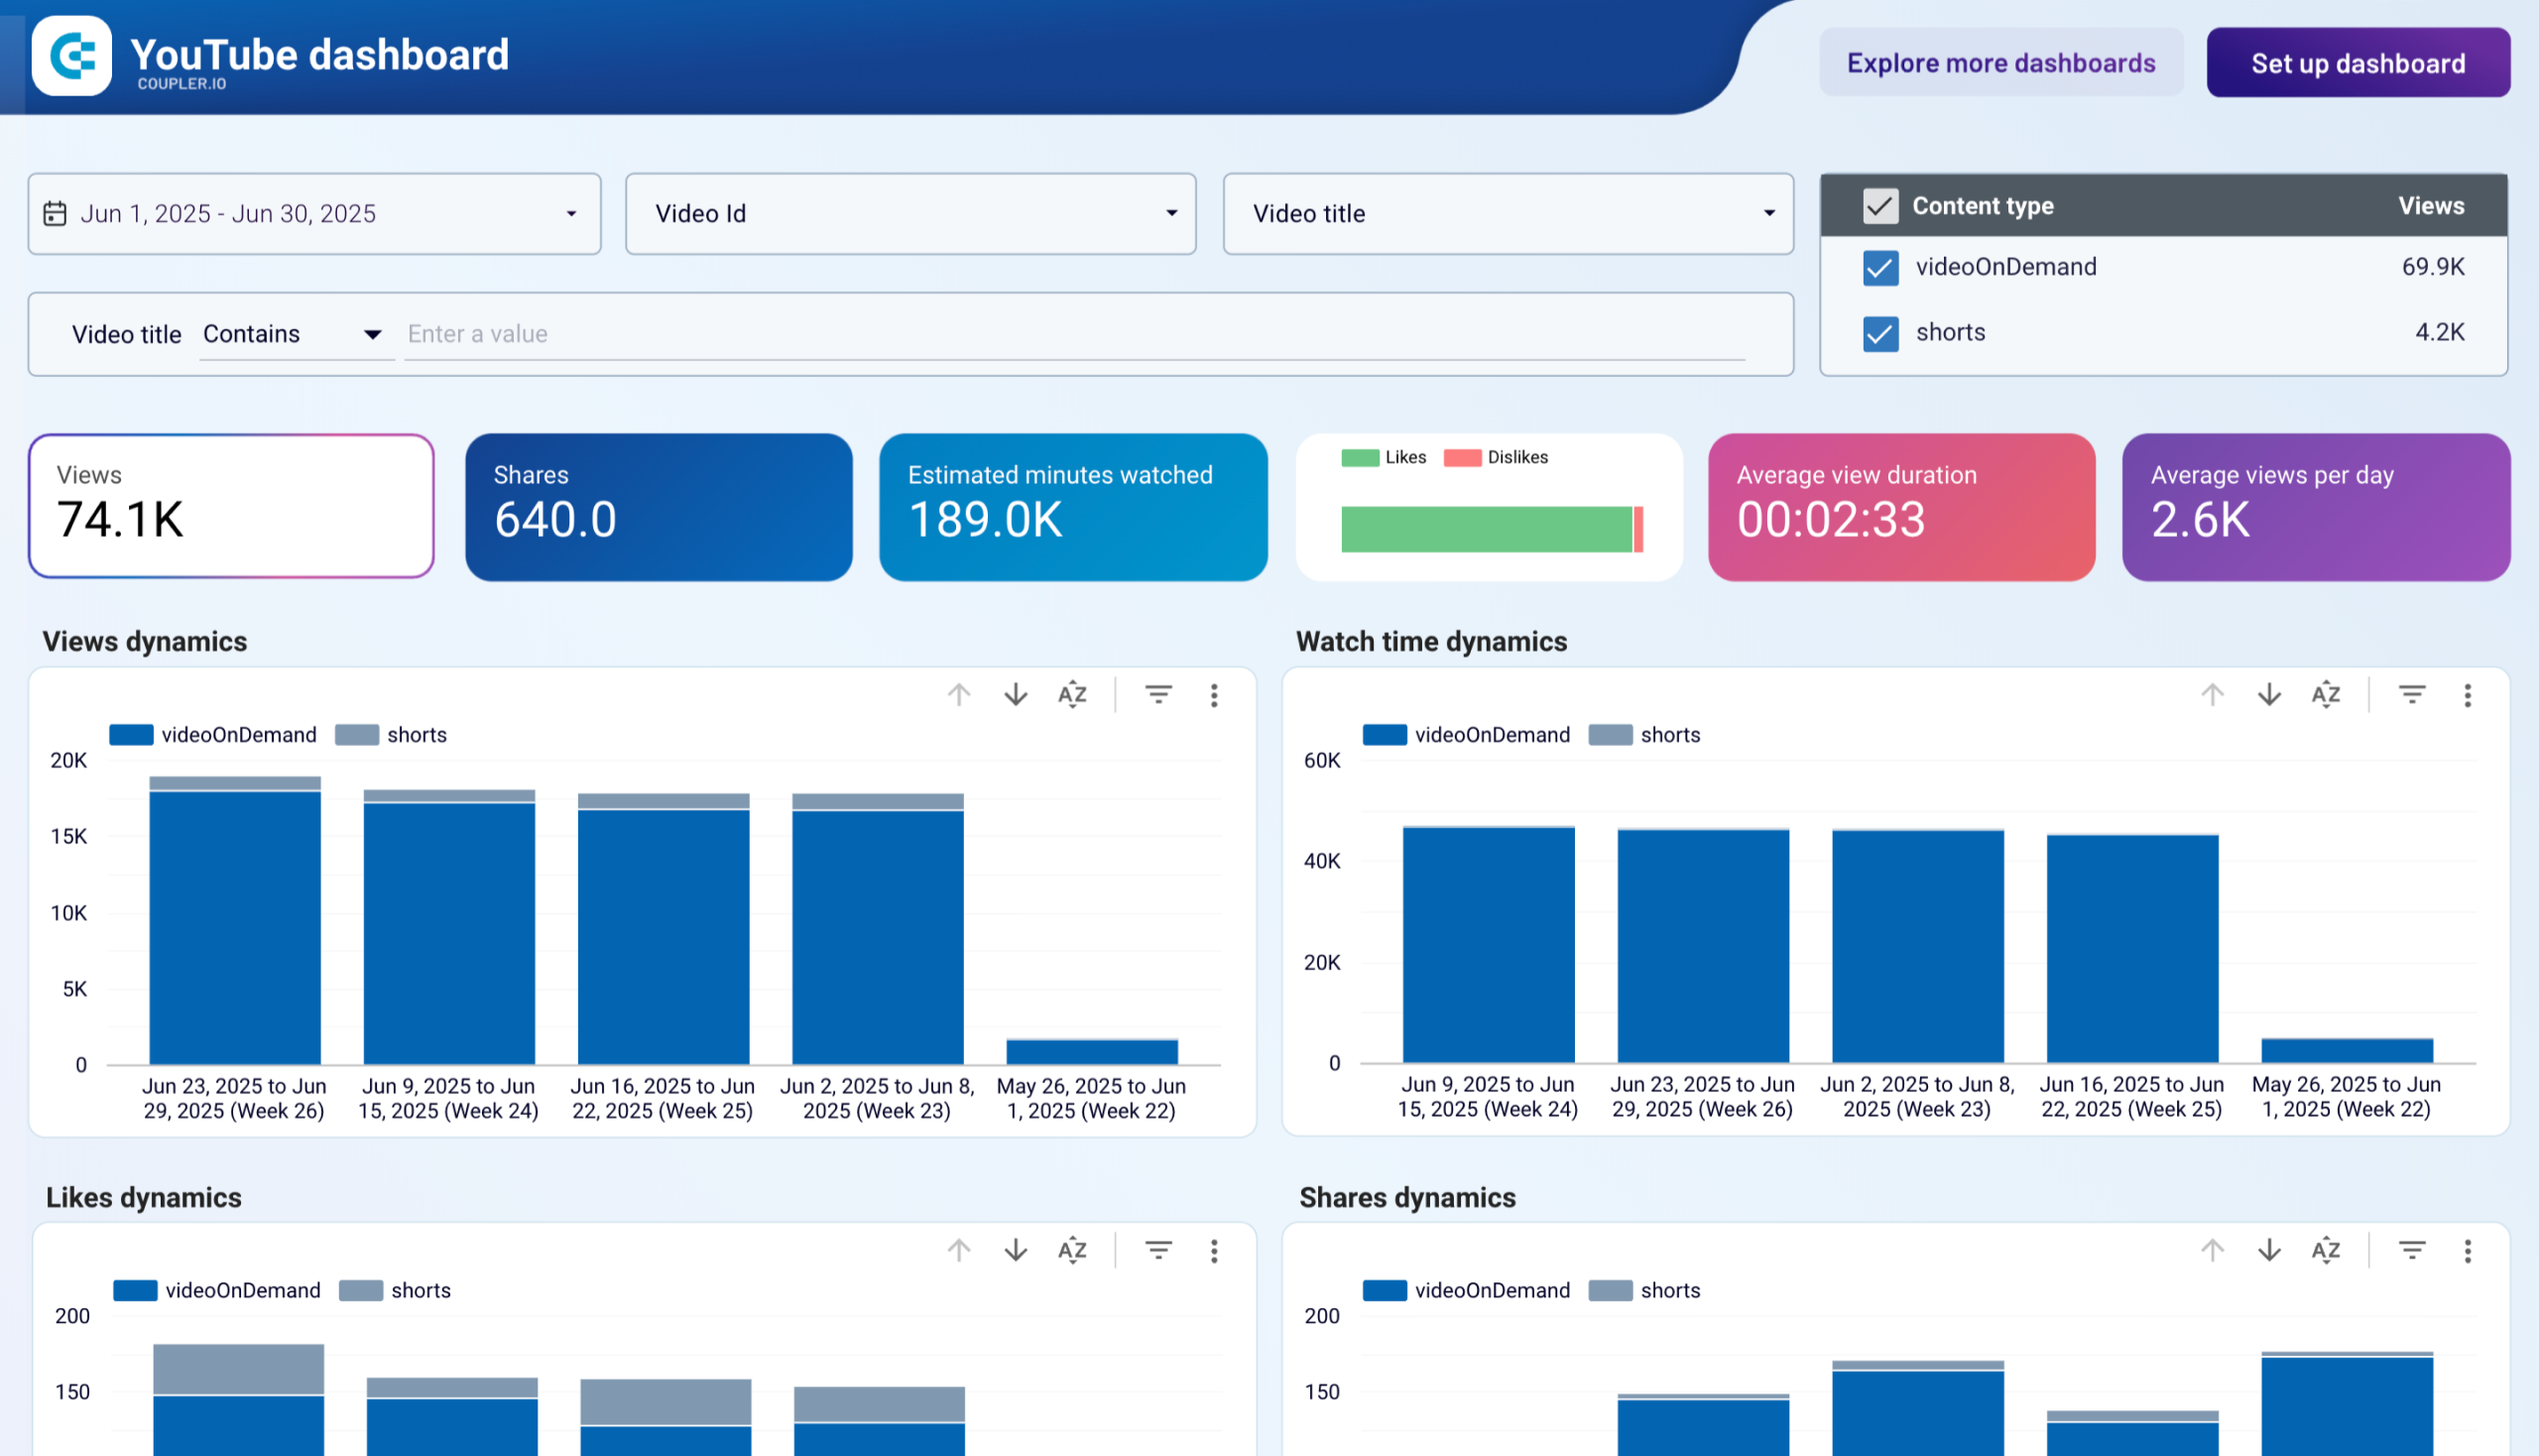
The content performance report provides detailed metrics for individual posts and videos, including views, engagement rate, reach, saves, shares, and profile actions. It ranks content by performance across multiple metrics, highlighting top performers and underperforming pieces. For YouTube, the report tracks watch time, average view duration, and traffic sources for each video.
What insights you can get with an influencer reporting dashboard
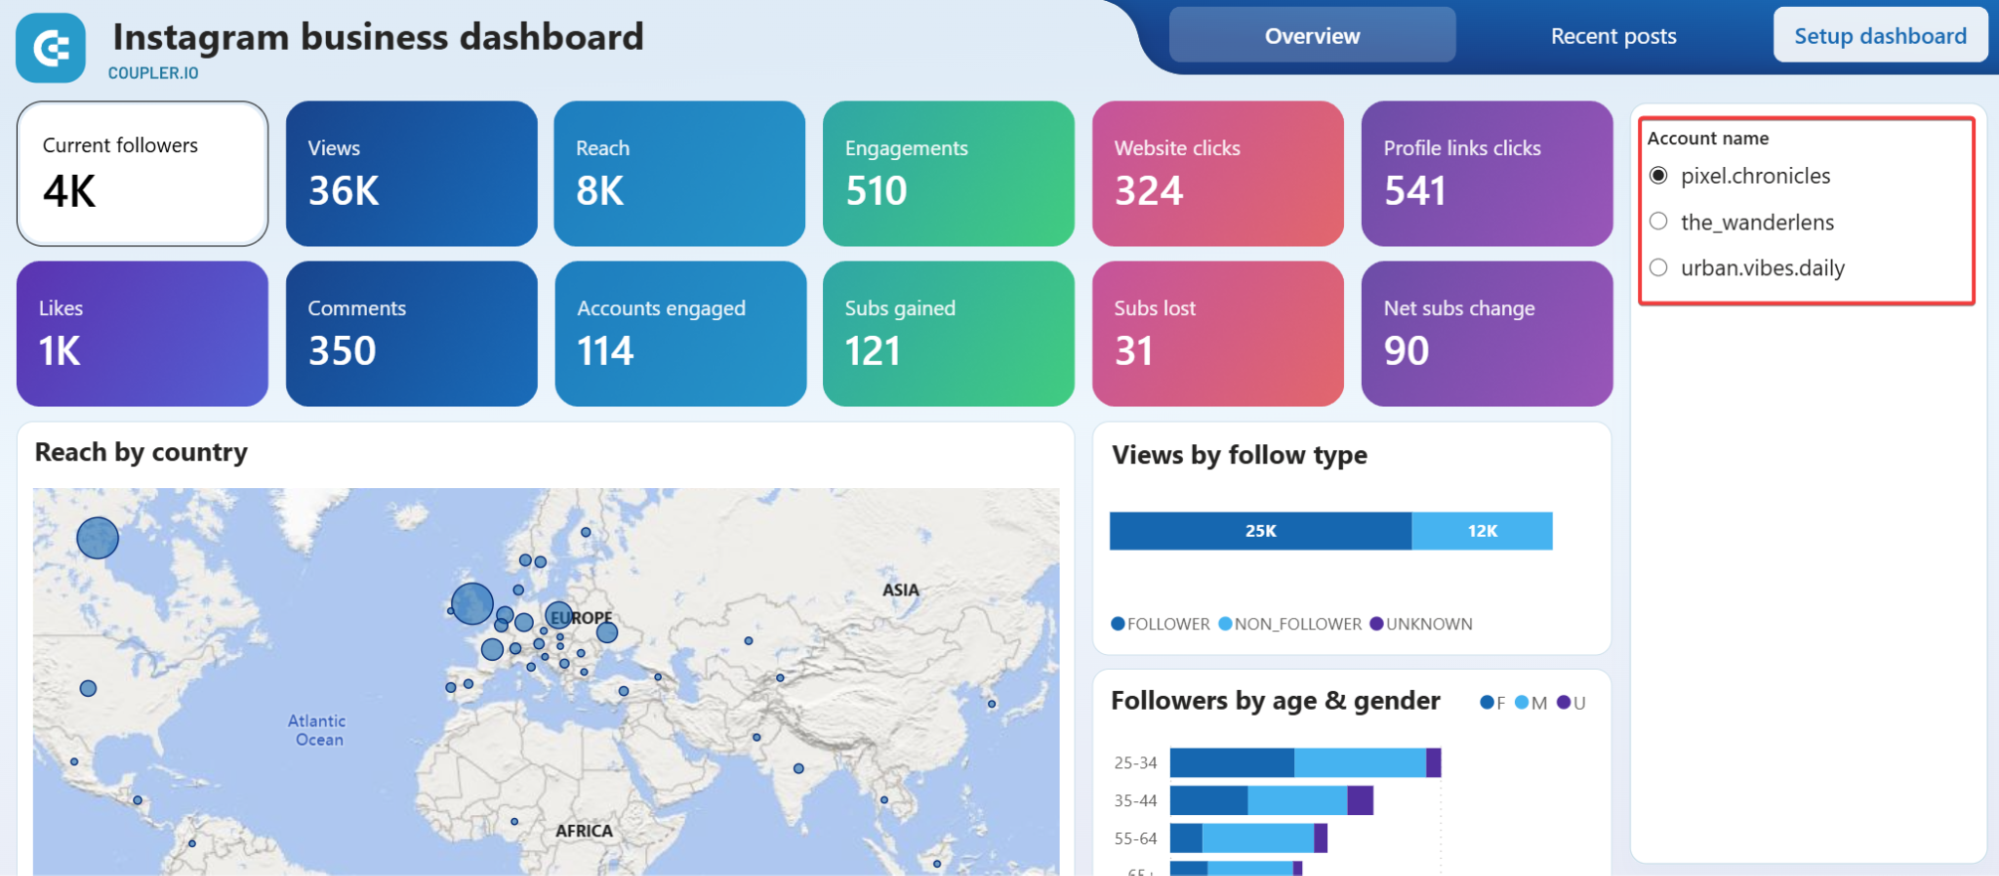
Monitor performance metrics from multiple Instagram, TikTok, or YouTube accounts simultaneously through a unified interface. The dashboard displays followers, views, reach, engagements, website clicks, profile link clicks, likes, comments, and net subscriber changes for all connected accounts. Switch between different profiles to compare engagement rates, growth patterns, and content performance. This capability is particularly valuable for agencies managing client portfolios or influencers maintaining multiple brand accounts, enabling quick identification of high-performing accounts and strategies worth replicating across other profiles.
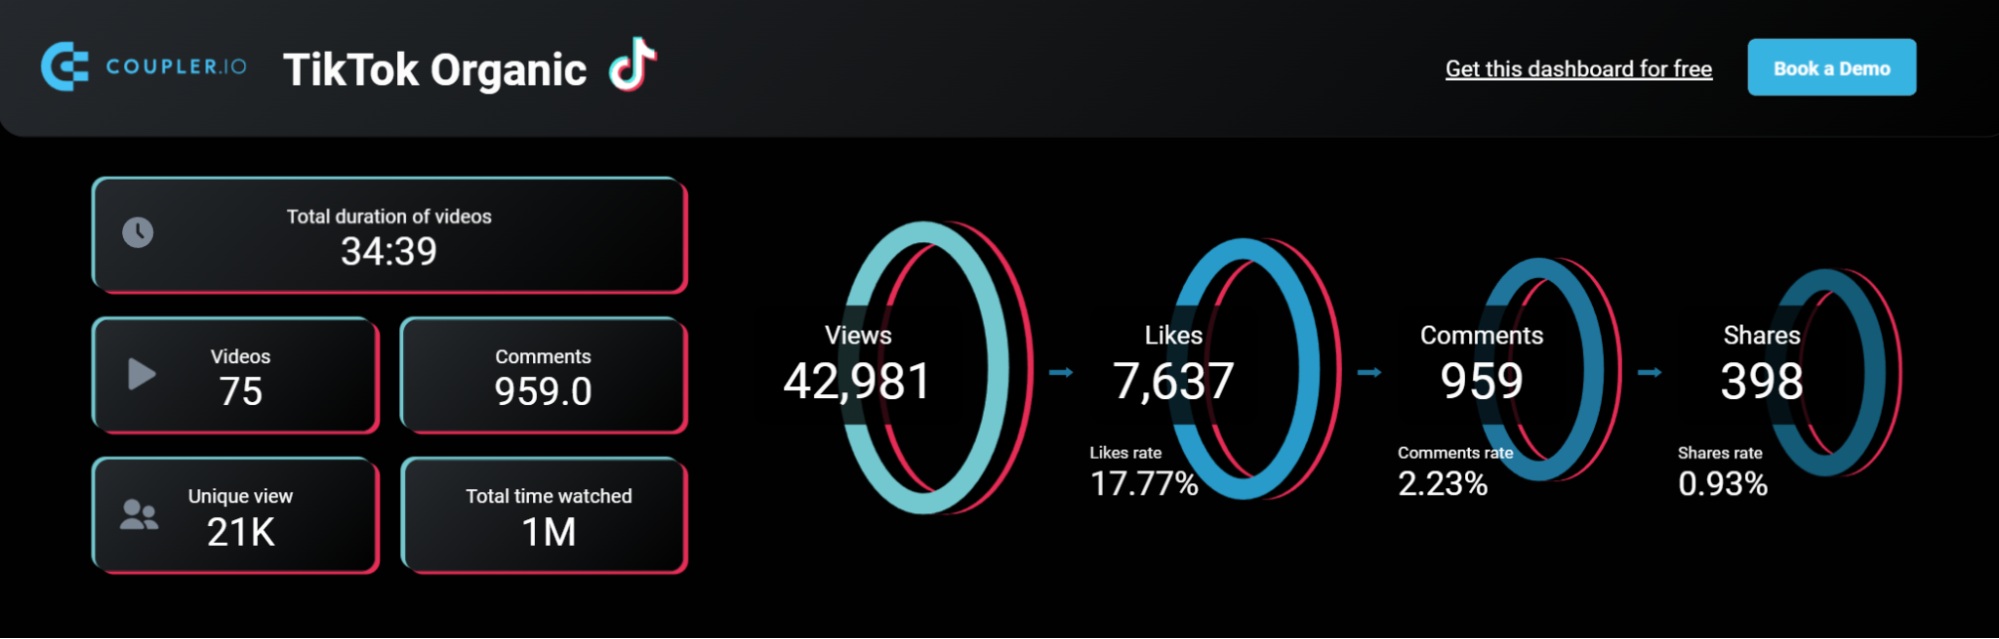
Track how audiences progress through the engagement journey from initial content views to meaningful interactions. The dashboard visualizes the conversion path showing views leading to likes, shares, and comments, with percentage rates displayed at each stage. This funnel analysis reveals where audiences are most engaged and where content fails to convert passive viewers into active participants.
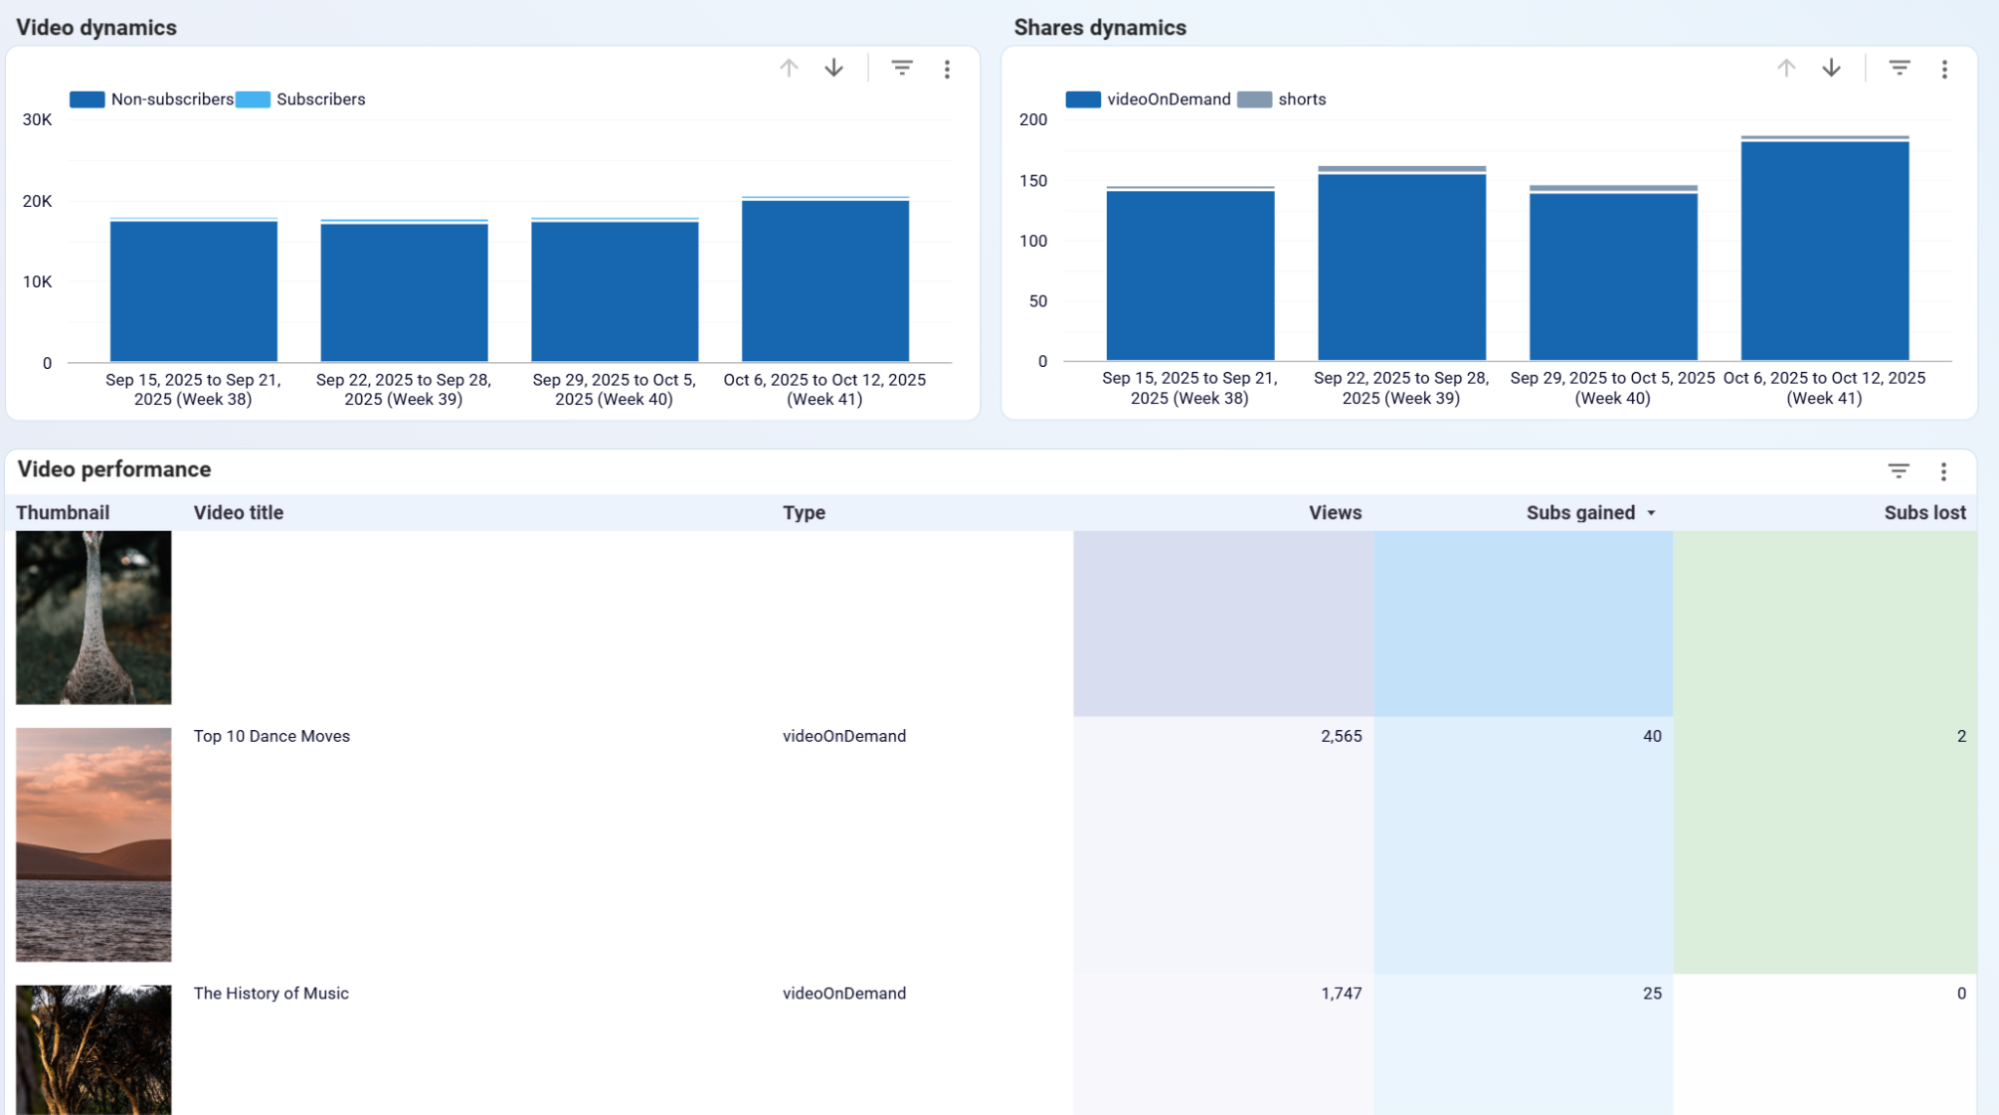
Analyze how specific videos and posts influence follower growth by tracking subscribers gained and lost for individual content pieces. The dashboard displays net subscriber changes with daily breakdowns, allowing identification of content that attracts new audiences versus posts that cause follower loss. Sort performance tables by subscriber metrics to quickly identify which videos or posts drive the strongest growth. This insight is critical for understanding what content resonates with target audiences and planning future content strategies that maximize follower acquisition while minimizing audience churn.
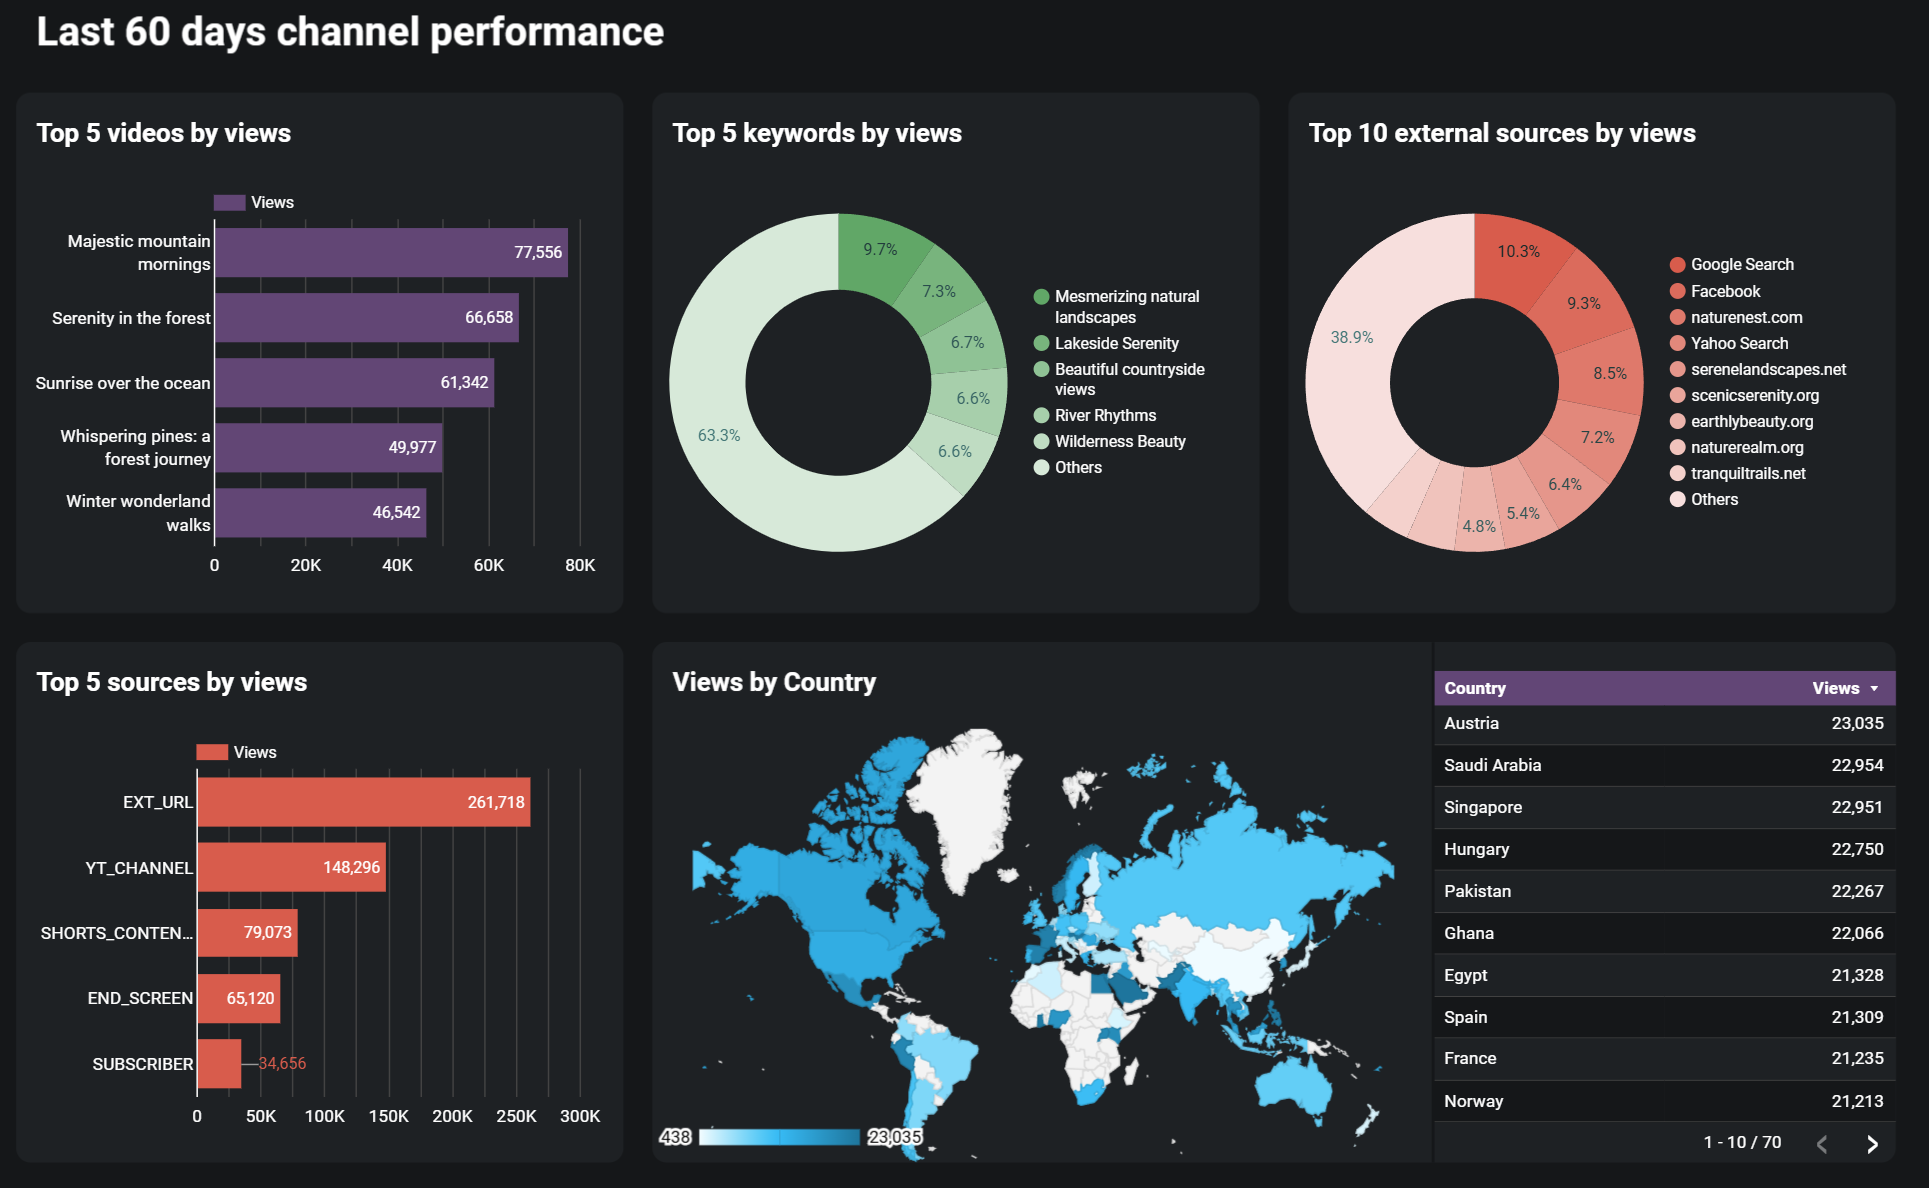
Access detailed performance rankings showing which videos and posts generate the highest views, engagement, and watch time. For YouTube channels, the dashboard identifies top-performing videos by views over rolling 60-day periods and reveals which search keywords bring viewers to content. Traffic source analysis breaks down views by origin—YouTube Search, Shorts, suggested videos, external websites—helping optimize content distribution strategies. For Instagram, the dashboard ranks posts by reach, engagement, and profile actions, enabling quick identification of high-impact content formats worth producing more frequently.
How to create an influencer dashboard?

Metrics you can track with an influencer dashboard template
Track your total follower count across Instagram, TikTok, and YouTube channels, with historical trends showing growth patterns over time. The dashboard displays net follower changes by comparing current counts with previous periods, highlighting successful growth campaigns and identifying periods of audience decline. This metric serves as the primary indicator of channel size and reach potential for sponsorship negotiations.
Monitor total video and content views across all platforms, with breakdowns by individual posts and videos. The dashboard tracks view counts for YouTube videos, TikTok content, and Instagram reels, allowing comparison of performance across different content formats. Daily and weekly view trends help identify optimal posting times and measure campaign effectiveness during promotional periods.
Measure the unique number of accounts that see your Instagram content, with geographic breakdowns showing audience distribution by country. The dashboard visualizes reach data through maps and charts, revealing which markets drive the largest audience exposure. Reach metrics help assess content discovery potential beyond existing followers and inform geographic expansion strategies for brand partnerships.
Track total interaction counts including likes, comments, shares, saves, and profile actions across all platforms. The dashboard calculates engagement rates by dividing total engagements by reach or views, providing a standardized metric for comparing content performance regardless of follower count. High engagement rates indicate strong audience connection and are often more valuable to sponsors than raw follower numbers.
Monitor the number of likes received on posts and videos across Instagram, TikTok, and YouTube. The dashboard displays likes as both absolute counts and percentages of total views, helping identify content that resonates emotionally with audiences. Tracking likes over time reveals shifts in audience preferences and content quality perception across different content types and topics.
Track comment counts on posts and videos as an indicator of audience engagement depth. The dashboard highlights content that generates discussion and community interaction, which often signals strong audience connection. Comment metrics are particularly valuable for assessing content that prompts conversation and building active communities around influencer brands.
Measure how often audiences share your content with their networks, indicating content virality potential. The dashboard tracks shares across Instagram, TikTok, and YouTube, with breakdowns showing which content types drive the most organic distribution. High share rates suggest content that audiences find valuable enough to recommend, often leading to exponential reach growth beyond paid promotion.
Monitor total minutes watched across all YouTube videos, with average view duration metrics showing how long audiences stay engaged. The dashboard tracks watch time trends over multiple periods, helping identify content that maintains viewer attention versus videos with high drop-off rates. This metric directly impacts YouTube's recommendation algorithm and is critical for channel growth strategies.
Track new followers acquired over specific time periods across all platforms. The dashboard displays daily, weekly, and monthly subscriber acquisition rates, with correlation analysis showing which content pieces drive the strongest follower growth. Understanding subscriber acquisition patterns helps optimize content calendars for maximum audience expansion during key campaign periods.
Monitor follower loss over time to identify content or activities that negatively impact audience retention. The dashboard highlights periods of significant follower decline and correlates them with specific posts or videos, enabling quick identification of content that fails to resonate with existing audiences. This metric is essential for maintaining audience quality and preventing costly follower churn during sponsorship campaigns.