Harvest dashboard examples and reporting templates
Monitor team productivity and optimize resource allocation with automated Harvest reporting dashboards that consolidate time tracking data into visual insights. Track billable hours, identify productivity patterns, and prevent burnout with real-time analytics from your Harvest time tracking platform.
Harvest dashboard examples for every need


about your case. It doesn't cost you a penny 😉
Choose your white label Harvest dashboard to kick off
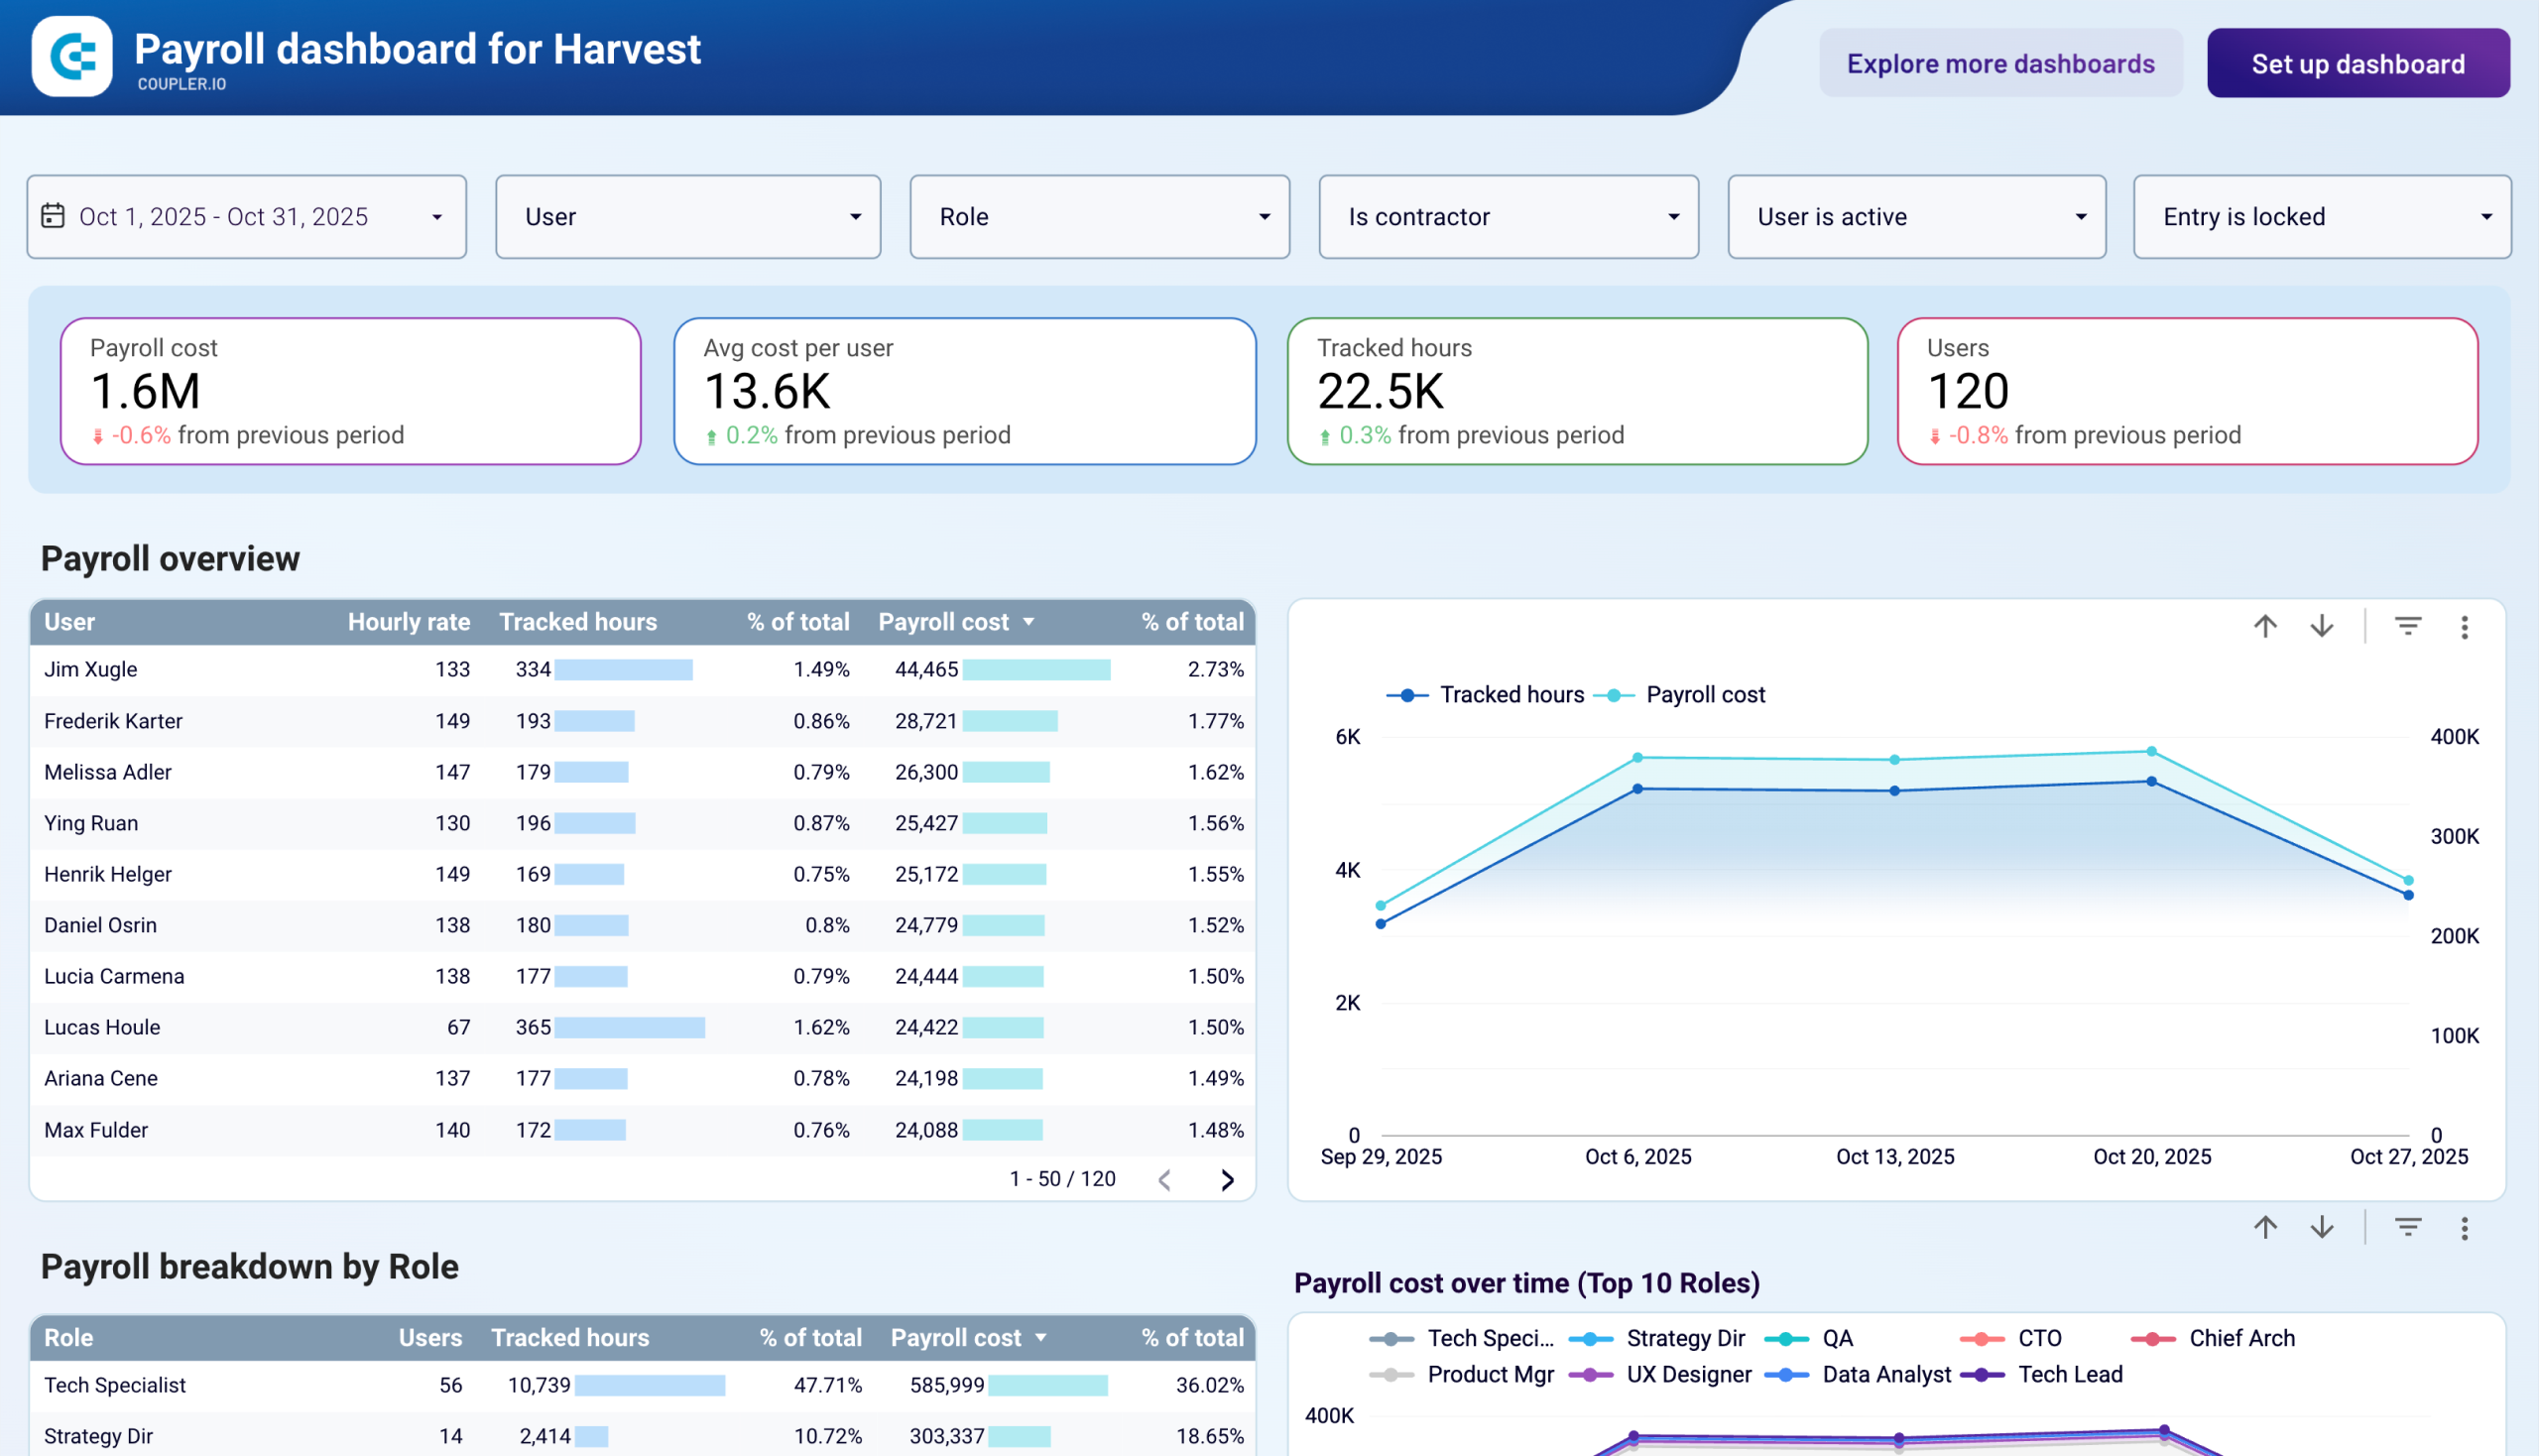
What is a Harvest dashboard?
Unlike basic reports, our Harvest dashboard templates provide calendar views for daily performance analysis, comparative metrics across team members, and automated alerts for time tracking inconsistencies. Harvest reporting dashboards eliminate the need for manual data compilation while offering deeper insights into how your team spends time, which projects generate the most revenue, and where productivity improvements are needed most.

What reports should be included in Harvest dashboards?
An effective Harvest reporting dashboard should incorporate four essential report types that provide complete visibility into your team's time utilization and project performance. These reports work together to identify productivity bottlenecks, optimize resource allocation, and ensure accurate billing practices.
The individual performance report displays each team member's daily and weekly time logs with calendar visualization for easy pattern recognition. This report helps identify team members who consistently log fewer hours than contracted (potential underwork issues) or those working excessive hours beyond their agreements (burnout risk indicators). The calendar view makes it simple to spot data entry errors, such as impossibly high daily hour totals that require correction. Time tracking managers use this report to maintain fair workload distribution and ensure team members maintain sustainable working patterns.
The project profitability report tracks billable hours and revenue generation across different clients and projects over monthly periods. This analysis reveals which clients provide the most profitable work and which projects consume resources without adequate compensation. The report includes comparative metrics showing hour investment versus revenue return, enabling better project selection and pricing strategies. Teams can identify high-value clients worth prioritizing and projects that may need scope adjustments or rate increases.
The team productivity report provides filtering capabilities by project, client, user, and task to analyze performance across different dimensions. This report shows productivity trends, identifies peak performance periods, and reveals potential efficiency improvements. Managers can compare team members' performance on similar tasks, spot training opportunities, and redistribute work based on individual strengths. The report also highlights when team members are switching between too many projects, which can reduce overall efficiency.
The billing accuracy report ensures that logged hours align with actual billable amounts and identifies discrepancies that could impact revenue. This report tracks the relationship between time spent and billing rates across different project types and clients. It helps identify undercharged projects, ensures accurate client invoicing, and prevents revenue loss from untracked or incorrectly categorized time entries. Finance teams use this report to verify billing accuracy before sending invoices to clients.
What insights you can get with the Harvest dashboard
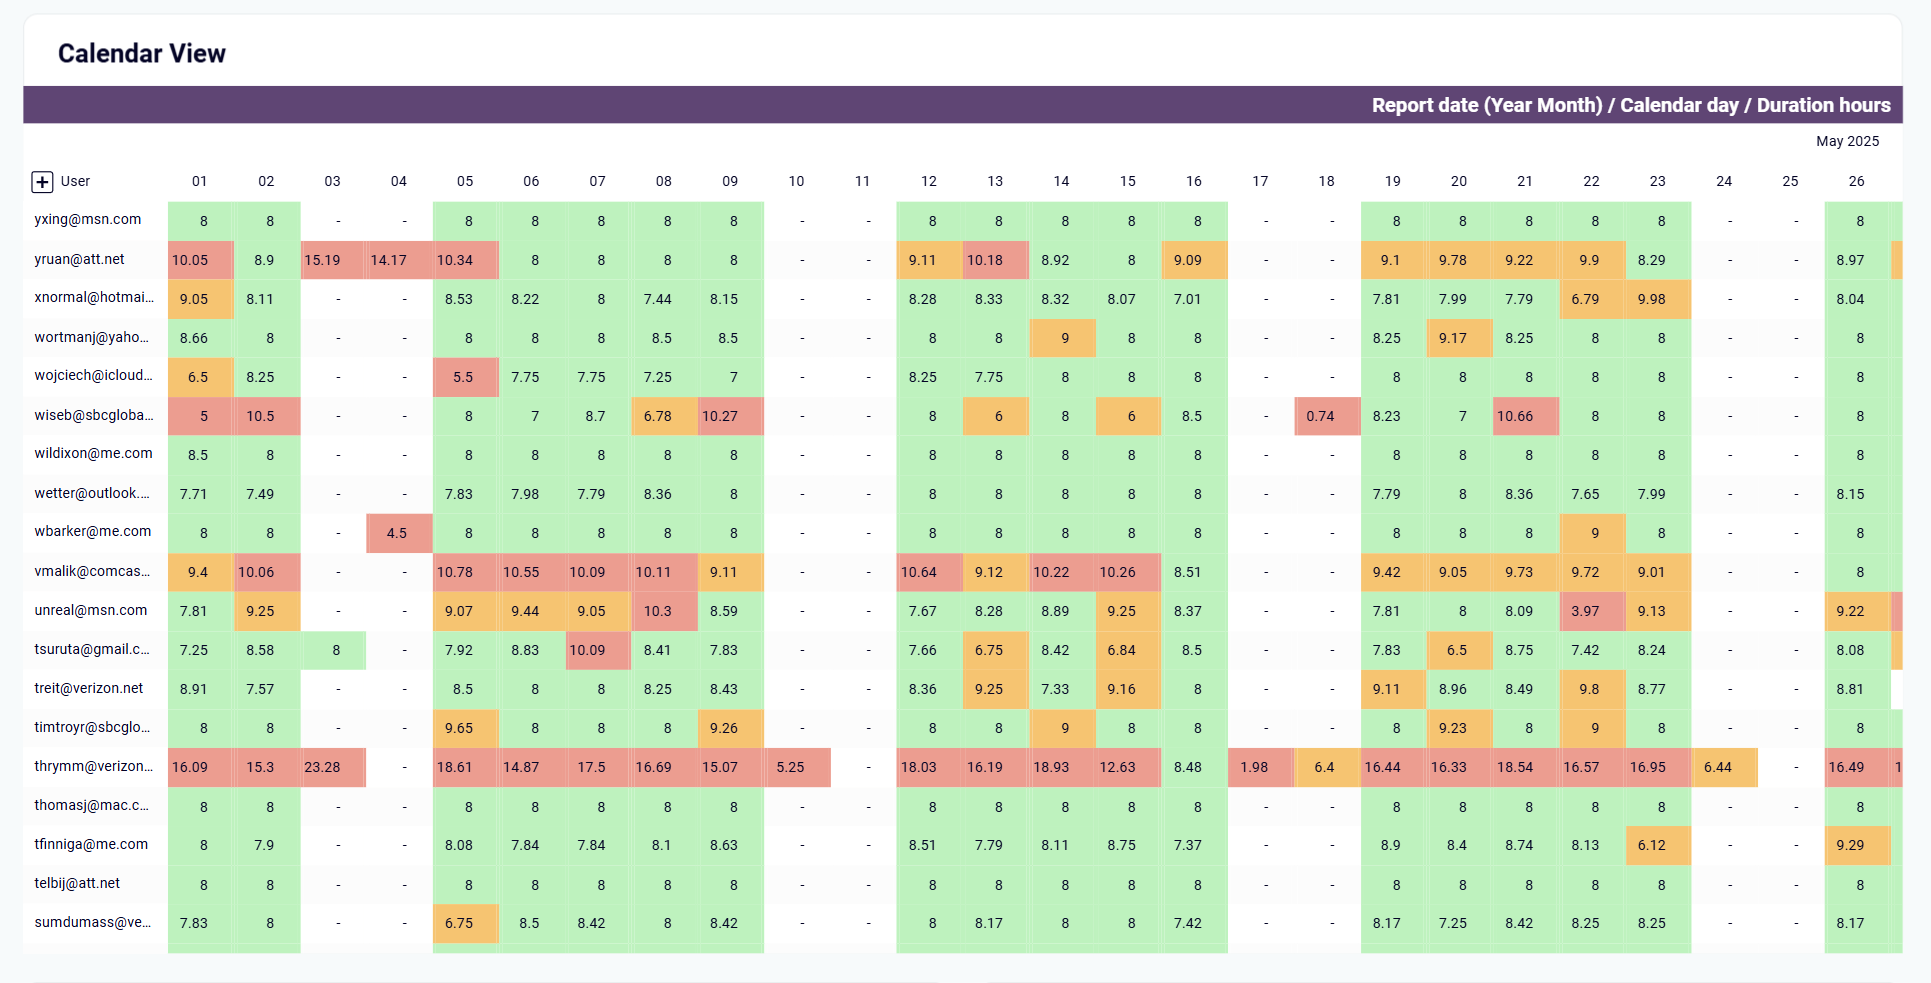
The calendar view report allows detailed analysis of individual team member performance over monthly periods, revealing patterns that standard reports miss. You can quickly spot team members averaging only 5-6 hours per day on 40-hour contracts, indicating potential underwork issues that need addressing. Conversely, the dashboard highlights team members consistently working 9+ hours daily despite 40-hour agreements, signaling burnout risks that require immediate intervention.
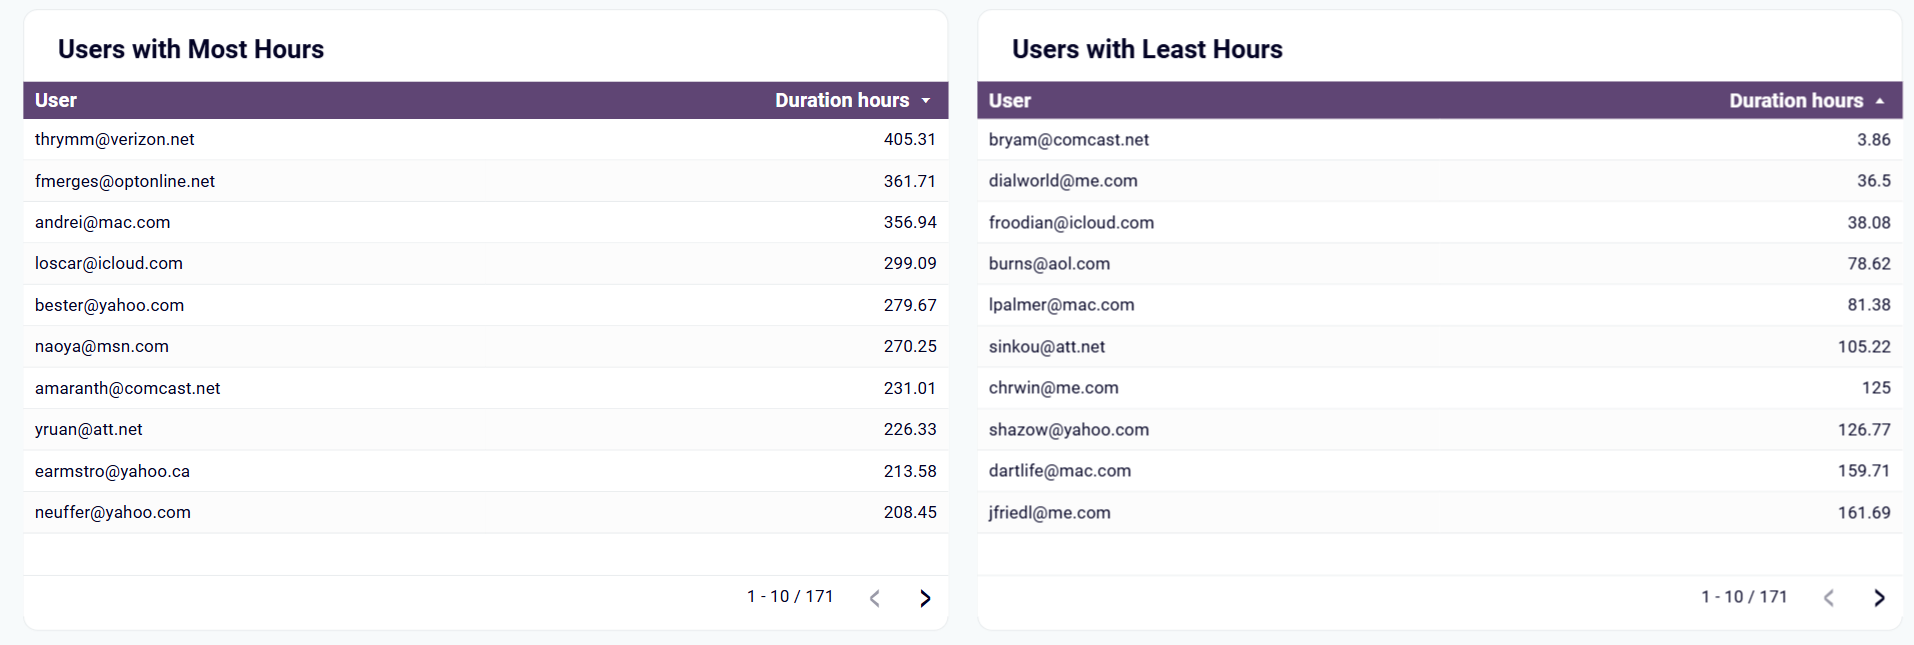
Side-by-side comparison tables show users with the most and least logged hours, revealing significant workload imbalances across your team. You can instantly identify high-performing team members logging 400+ hours while others record only 3-40 hours, enabling immediate resource reallocation decisions. This comparative view helps prevent burnout among overworked team members while identifying underutilized talent that could take on additional responsibilities.
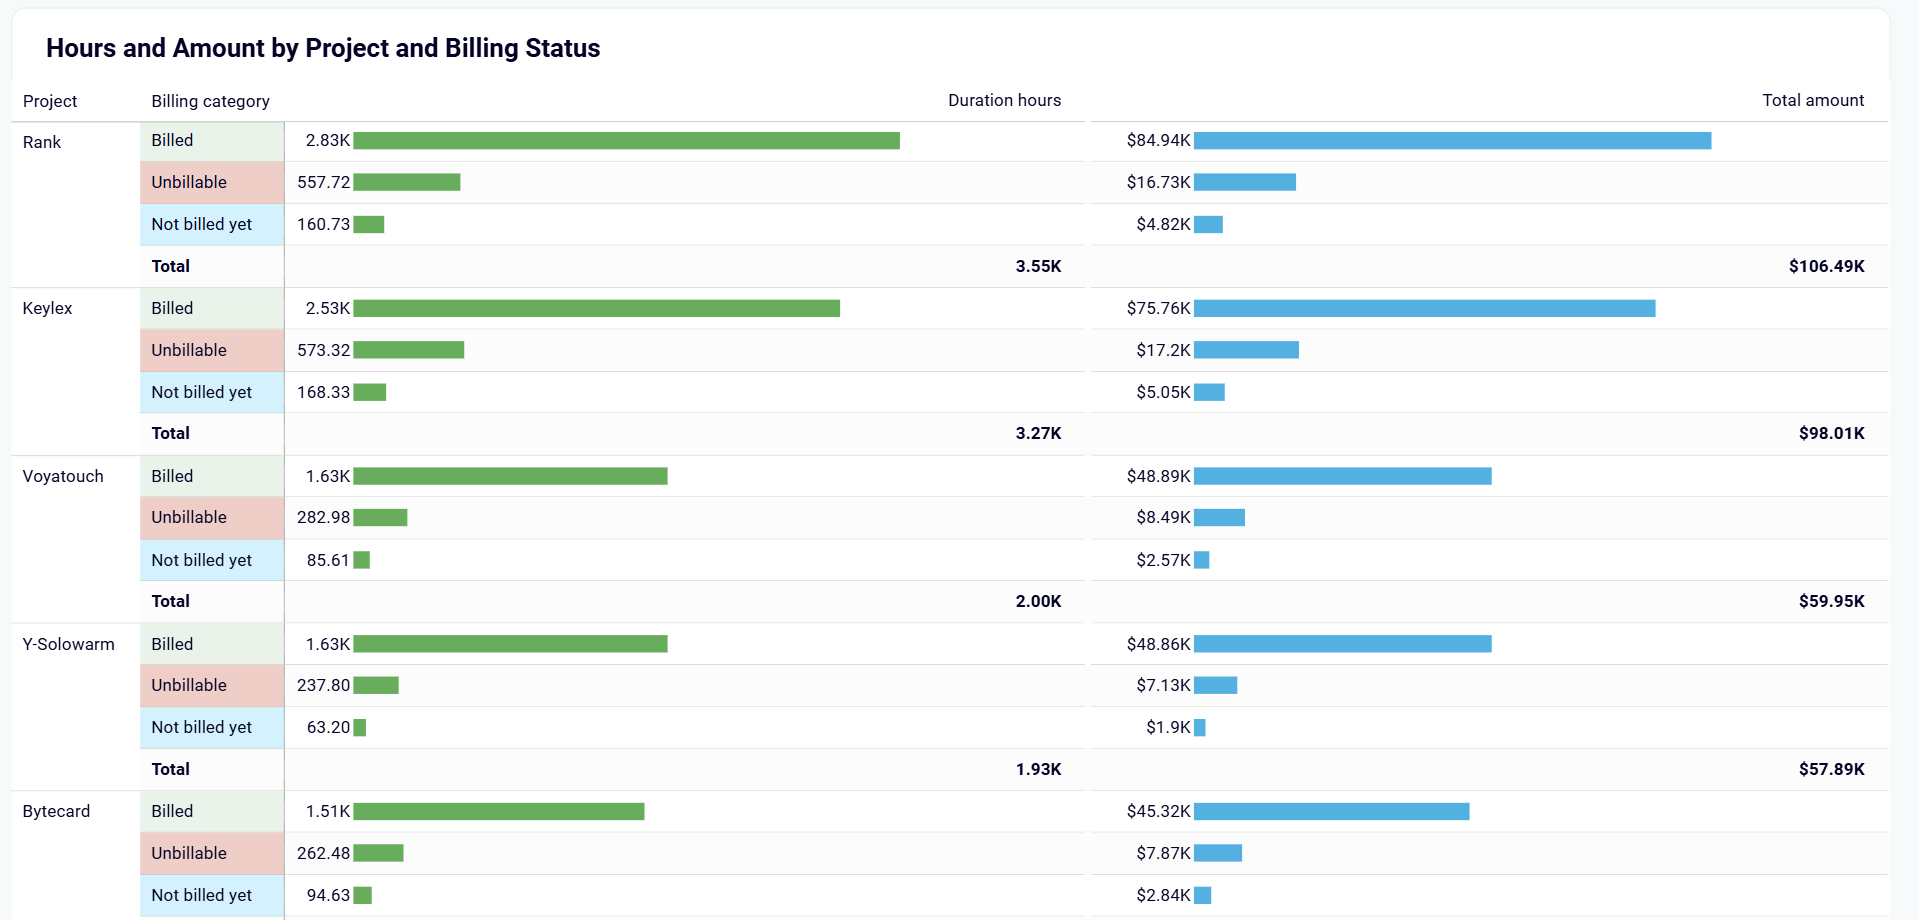
Track billable amounts and hours across different projects and clients from a monthly perspective to identify your most profitable relationships. Our Harvest dashboards reveal which clients provide consistent, well-paying work and which projects consume resources without adequate compensation. This analysis enables better project selection, pricing strategies, and resource allocation decisions.
Advanced filtering capabilities by project, client, group, user, and task provide granular insights into team dynamics and individual performance patterns. You can analyze how different team members perform on similar tasks, identify training opportunities, and redistribute work based on individual strengths and capacity. This detailed analysis helps prevent overallocation of high-performing team members while developing underutilized talent.
How to create a Harvest dashboard?

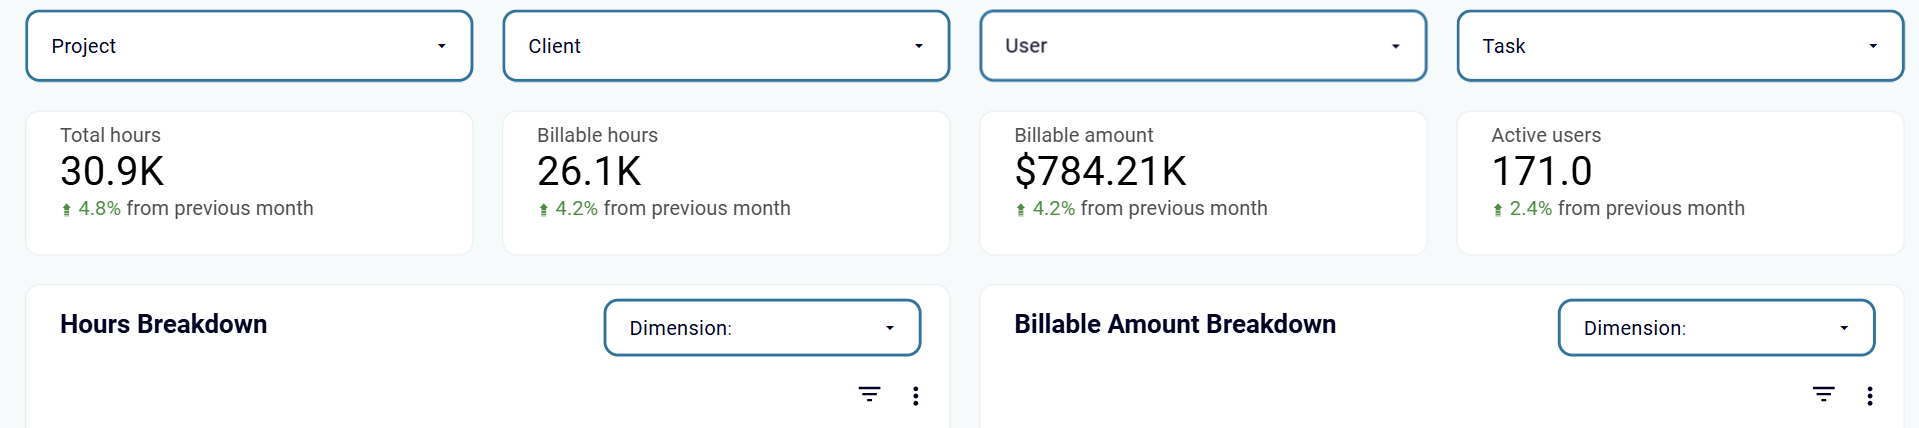
Metrics you can track with Harvest dashboard templates
Track the complete time investment across all projects, clients, and team members to understand overall workload distribution and capacity planning. This metric provides a comprehensive view of how your team's time is allocated and helps identify periods of high or low activity that may require resource adjustments.
Monitor time that can be charged to clients versus internal or administrative work to optimize revenue-generating activities. This metric helps distinguish between profitable work and overhead tasks. With its help, you can better project selection and team allocation decisions for maximum billing efficiency.
Calculate total revenue generated from tracked time by applying hourly rates to billable hours across projects and clients. This metric directly connects time investment to financial outcomes. As a result, you can measure the monetary value of your team's work and identify the most profitable activities.
Track how many team members are actively logging time during specific periods to monitor team engagement and utilization rates. This metric helps identify when additional resources may be needed or when team members might be underutilized across different projects or time periods.
Measure the actual time spent on specific tasks, projects, or client work to analyze the efficiency and accuracy of time estimates. This metric enables better project scoping and helps identify tasks that consistently take longer than expected, improving future planning and client proposals.
Calculate the complete cost of project delivery by combining team member rates with tracked hours to understand true project expenses. This metric includes all labor costs associated with project work. With its help, you can determine actual profitability and inform pricing strategies for similar future projects.
Project anticipated profit margins by comparing estimated costs against proposed project pricing before work begins. This metric helps evaluate project viability during the proposal stage and ensures that accepted projects will meet profitability targets based on planned resource allocation and hourly rates.
Measure real profit margins by comparing final project costs against client payments to assess project success and profitability accuracy. This metric reveals the difference between projected and actual financial outcomes, helping refine estimation processes and improve future project pricing and resource planning.