Employee performance dashboard examples and reporting templates
Stop relying on gut feelings about team performance—get precise insights that help you optimize talent allocation, prevent burnout, and maximize revenue per employee through automated performance tracking. Use our employee performance management dashboard to reveal individual achievement trends, workload imbalances, and meeting efficiency across your organization.
Employee performance dashboard examples for every need


about your case. It doesn't cost you a penny 😉
Choose your white label employee performance dashboard to kick off
What is an employee performance dashboard?
The KPI dashboard for employee performance eliminates guesswork from team management by showing exactly which individuals drive results, where bottlenecks occur, and how workload distribution affects overall productivity. With automated data refresh by Coupler.io, employee performance dashboard templates ensure you're always working with up-to-date performance information without manual data consolidation. This creates a unified view of workforce productivity that helps managers spot high performers, identify coaching opportunities, and make strategic personnel decisions based on objective metrics rather than subjective impressions.

What reports should be included in employee performance dashboards?
Building robust employee performance reporting dashboards requires a strategic selection of metrics that illuminate both individual contributions and team dynamics. Through analysis of successful workforce analytics implementations, four core reporting areas emerge as fundamental for comprehensive performance evaluation.
Revenue attribution reports show exactly which team members generate the highest business value through their daily activities. These reports break down deal closures, conversion rates, and revenue per employee across different time periods. By tracking individual sales performance, win rates, and deal progression speed, managers gain clear visibility into who consistently delivers results and which approaches drive success.
Workflow progression reports reveal how effectively each team member navigates complex business processes from initial contact through final delivery. These analytics show where individuals excel in moving prospects through sales funnels and which stages typically create delays or drop-offs. Understanding process efficiency at the individual level enables targeted coaching interventions and helps replicate successful approaches across the entire team.
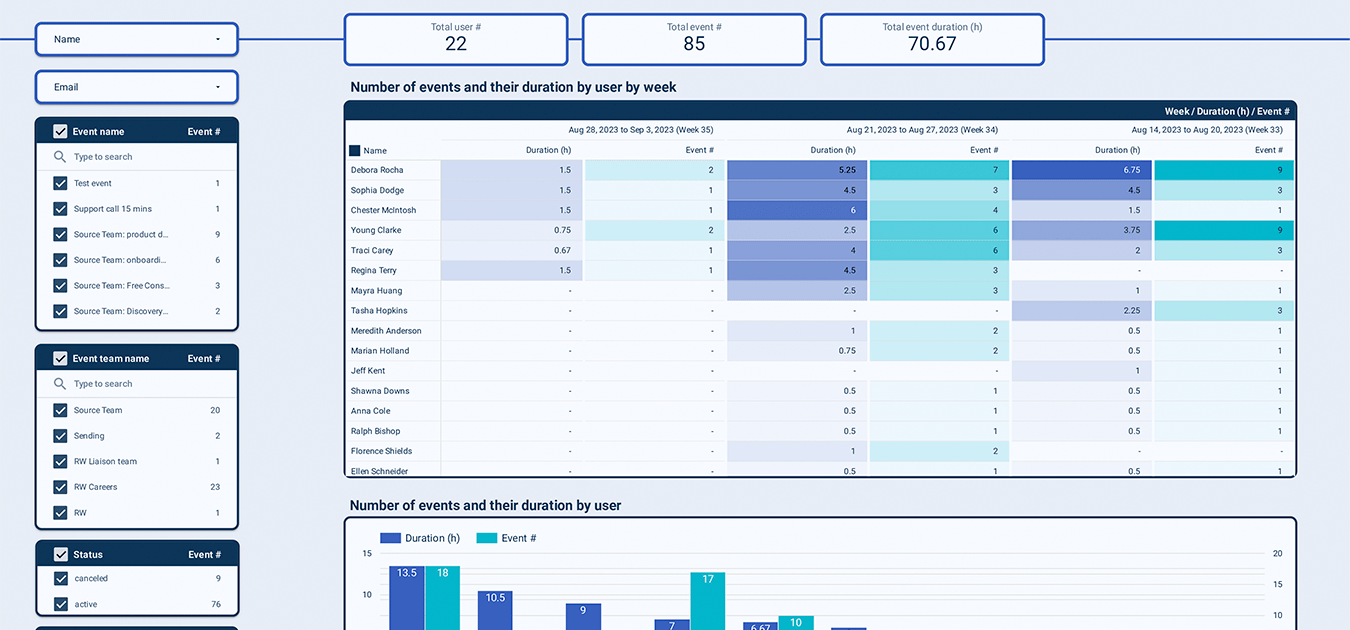
Resource utilization reports examine how team members distribute their time across different activities, meetings, and client interactions. This analysis identifies individuals who may be overcommitted with excessive meeting loads or underutilized with too much idle time. By monitoring scheduling patterns and availability trends, managers can rebalance workloads, prevent burnout, and ensure optimal productivity levels across the organization.
Competitive analysis reports enable side-by-side evaluation of team member achievements using standardized metrics like win rates, deal sizes, and closure timelines. These comparisons help identify best practices from top performers while highlighting improvement opportunities for others. Rather than creating unhealthy competition, these reports facilitate knowledge sharing and mentoring relationships that elevate overall team performance.
What insights you can get with the employee performance dashboard
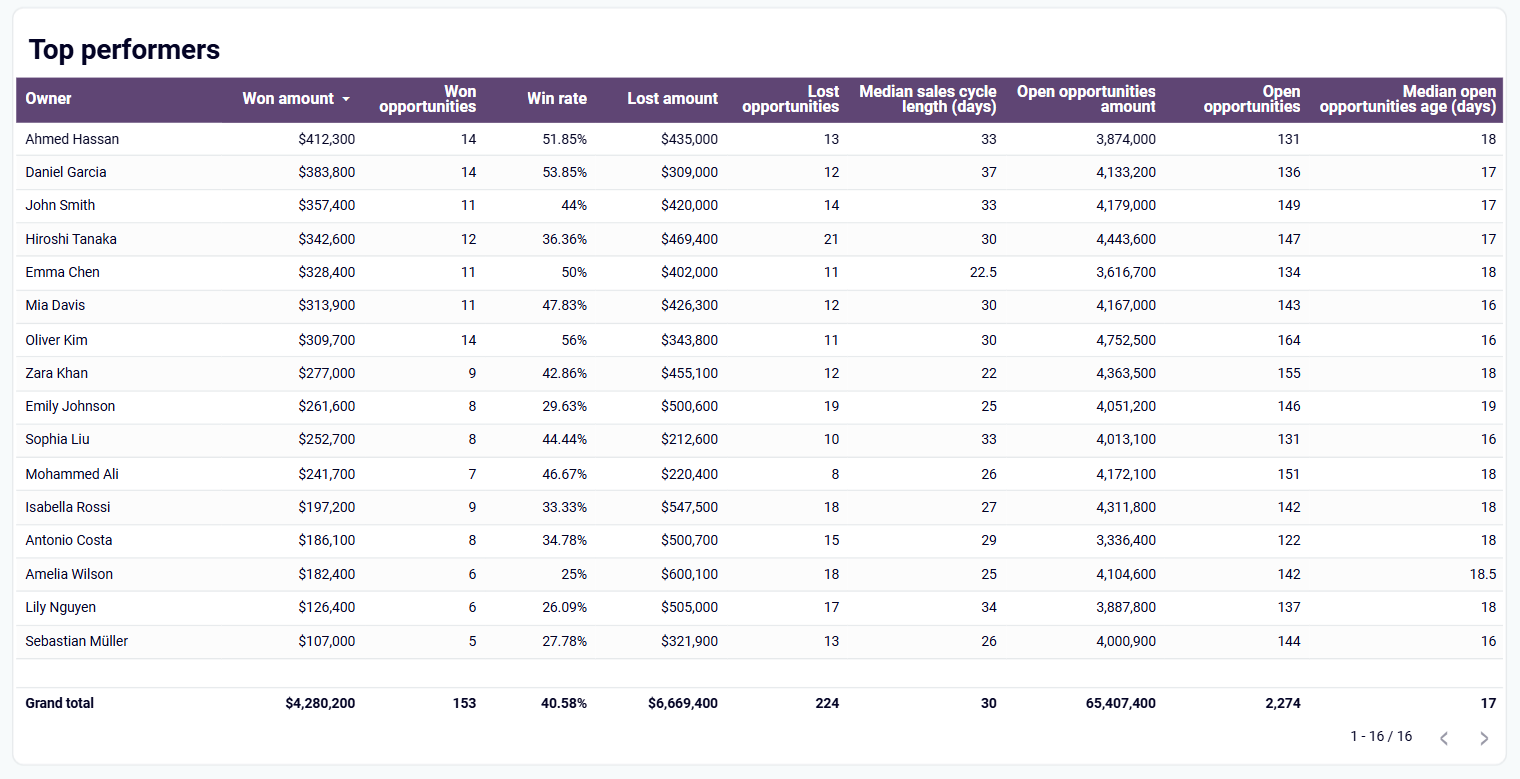
Analyze sales metrics for each team member, including won amounts, win rates, lost opportunities, and sales cycle length. This detailed performance breakdown shows individual revenue contributions, conversion effectiveness, and pipeline management skills to identify top performers and areas needing improvement.
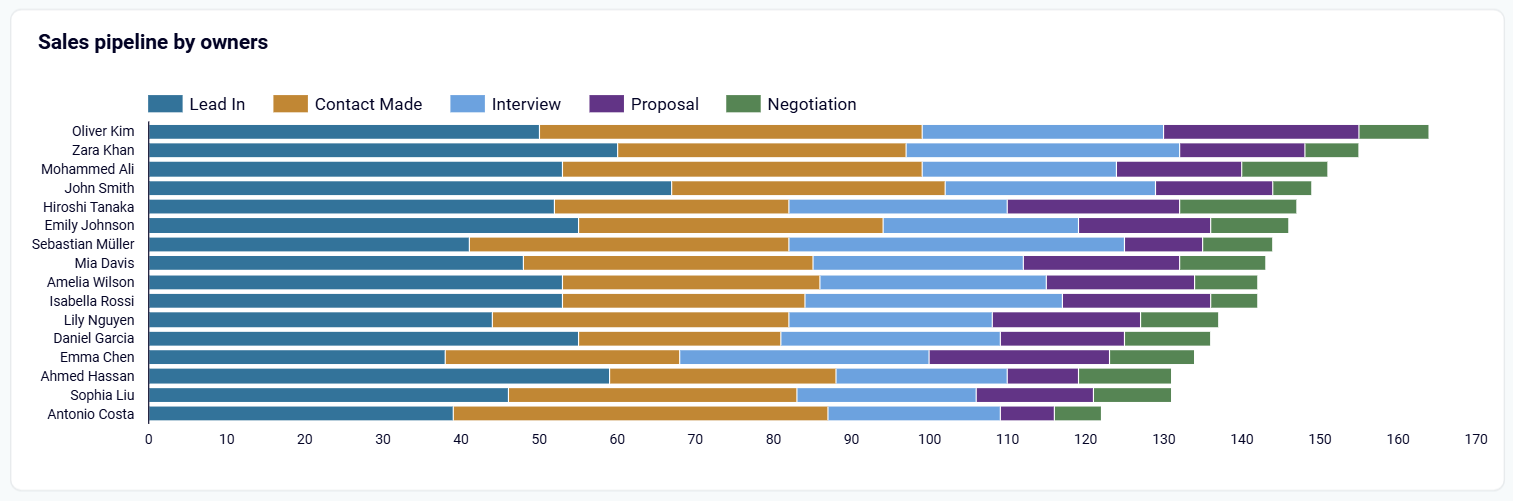
Examine how each individual moves opportunities through your business process with detailed conversion tracking at every stage. Identify personal strengths in prospect development and pinpoint where specific team members typically encounter obstacles that slow deal progression.
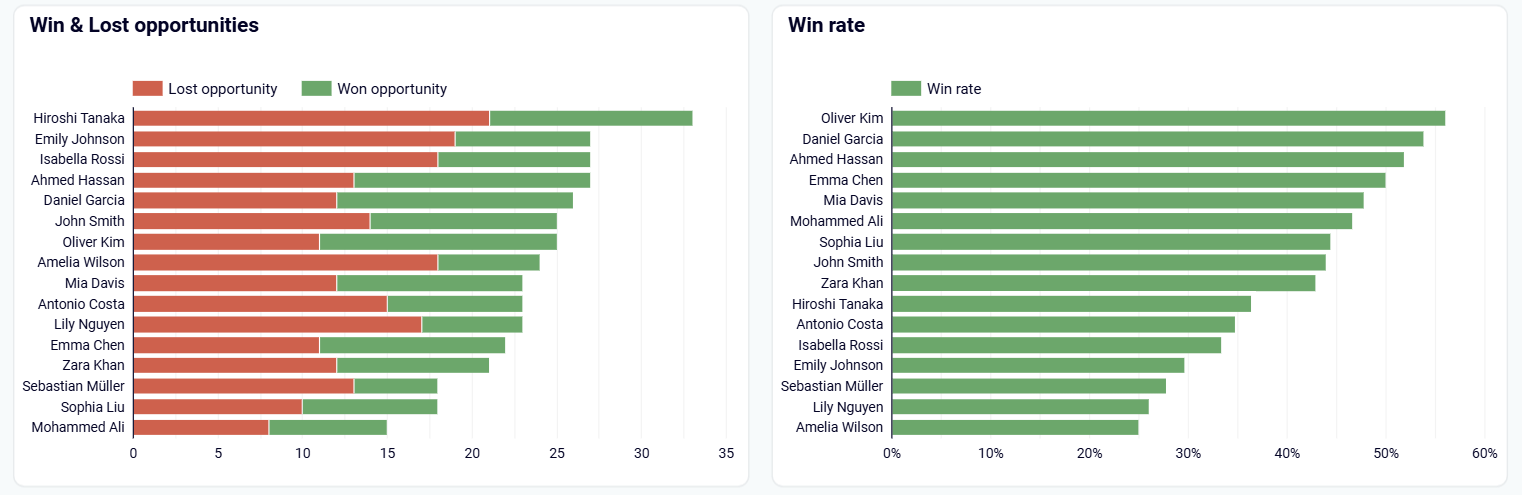
Compare closure success rates across your entire team to spot performance patterns and identify coaching opportunities. This analysis reveals which team members consistently achieve higher win rates and which ones may need additional support to improve their conversion effectiveness.
Monitor meeting loads and time commitments across team members to maintain productivity balance and prevent calendar overwhelm. Track weekly engagement patterns and availability trends to optimize resource allocation while supporting sustainable work practices.
How to create an employee performance dashboard?

Metrics you can track with employee performance dashboard templates
Track both the number of successful deals and total revenue each team member has generated from closed opportunities. This dual metric provides a complete view of individual sales performance, showing both deal volume and revenue contribution.
Monitor the count of unsuccessful deals and the potential revenue value that was not captured by each team member. This metric helps identify patterns in lost business and quantify the financial impact of missed opportunities.
Calculate the percentage of opportunities each team member successfully closes compared to their total deal count. This fundamental metric reveals individual sales effectiveness and helps benchmark performance across your sales organization.
Measure the typical duration each team member takes to move deals from initial opportunity to closure. This timing metric reveals efficiency patterns and helps identify who can accelerate deal progression most effectively.
Track both the number of active deals and their total potential value that each team member is currently managing. This metric provides visibility into pipeline health and workload distribution across your sales team.
Monitor how long current opportunities have been in progress for each team member. This metric helps identify deals that may be stalling and require intervention to maintain healthy pipeline velocity.
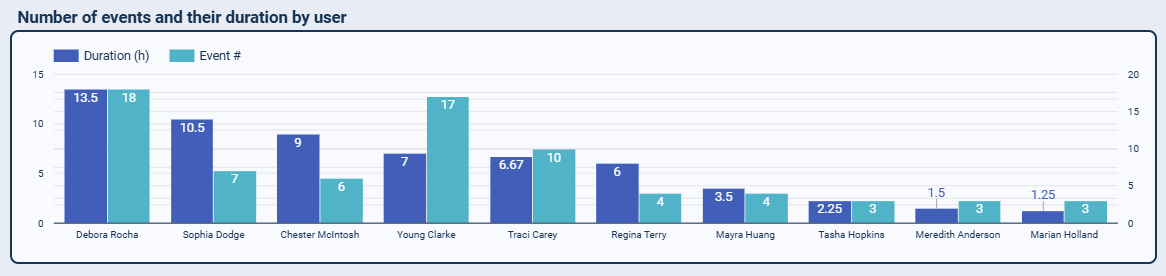
Track the total count of scheduled meetings and appointments each team member handles. This metric provides insight into activity levels and helps balance meeting loads across your organization.
Analyze the total time each team member spends in scheduled meetings and events. This metric helps optimize time allocation and ensures productive use of calendar time while maintaining client engagement.