Agency dashboard examples and reporting templates
Eliminate manual agency reporting with agency dashboards that consolidate client data from advertising platforms, analytics tools, and financial systems. Track campaign performance across multiple client accounts, monitor budget allocation, analyze revenue patterns, and demonstrate measurable results through automated data updates from your clients' connected sources.
Agency dashboard examples for every need


 +3
+3


 +2
+2


 +3
+3


 +3
+3


 +5
+5

 +6
+6
 +6
+6


 +3
+3

 +1
+1

 +3
+3
 +2
+2

 +3
+3

about your case. It doesn't cost you a penny 😉
Choose your white label digital agency dashboard to kick off
What is an agency dashboard?
A digital agency dashboard eliminates manual data gathering by consolidating multi-client reporting into a single interface where you can compare performance across accounts, identify optimization opportunities, and generate client presentations. Through scheduled data refreshing via Coupler.io, our agency dashboard templates maintain up-to-date information for stakeholder communications, performance reviews, and strategic planning without repetitive exports or spreadsheet updates.

What reports should be included in agency dashboards?
An effective agency client dashboard requires several interconnected reports that provide visibility into client performance, resource allocation, and business outcomes. Our analysis of agency dashboard implementations reveals four categories of reports that address distinct operational needs:
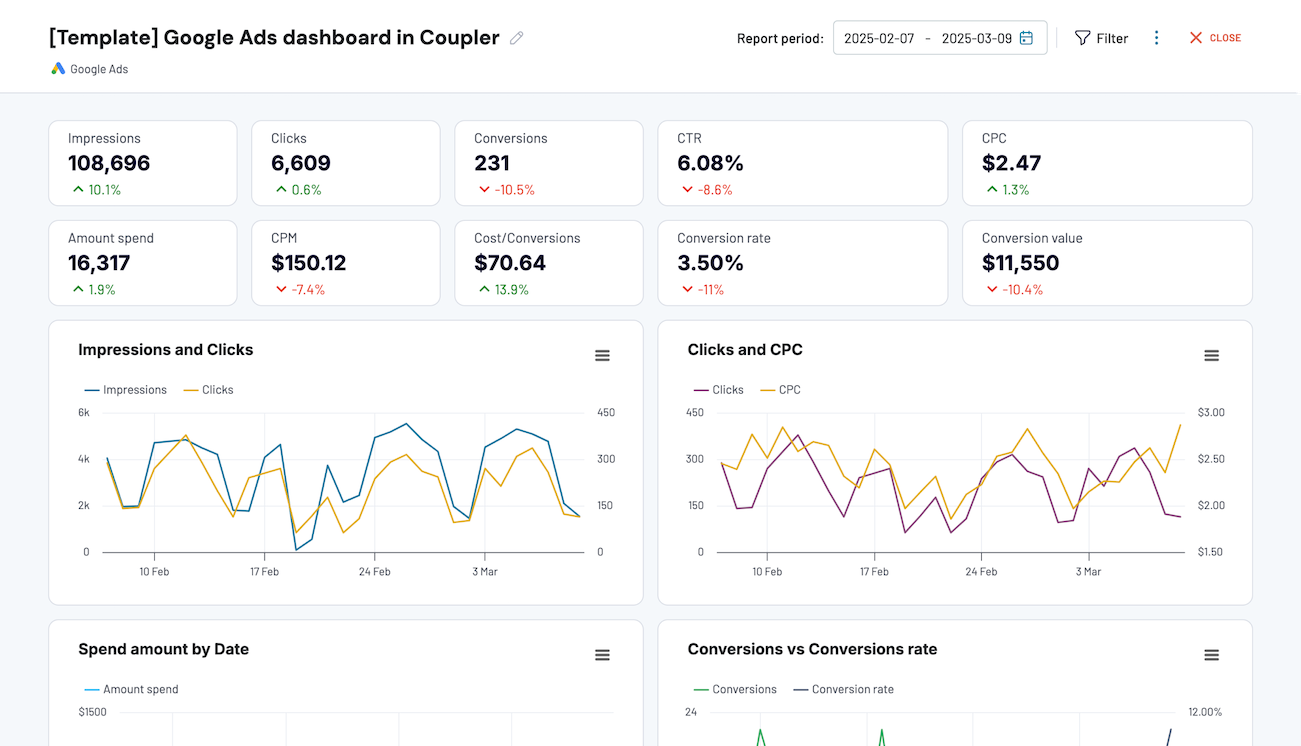
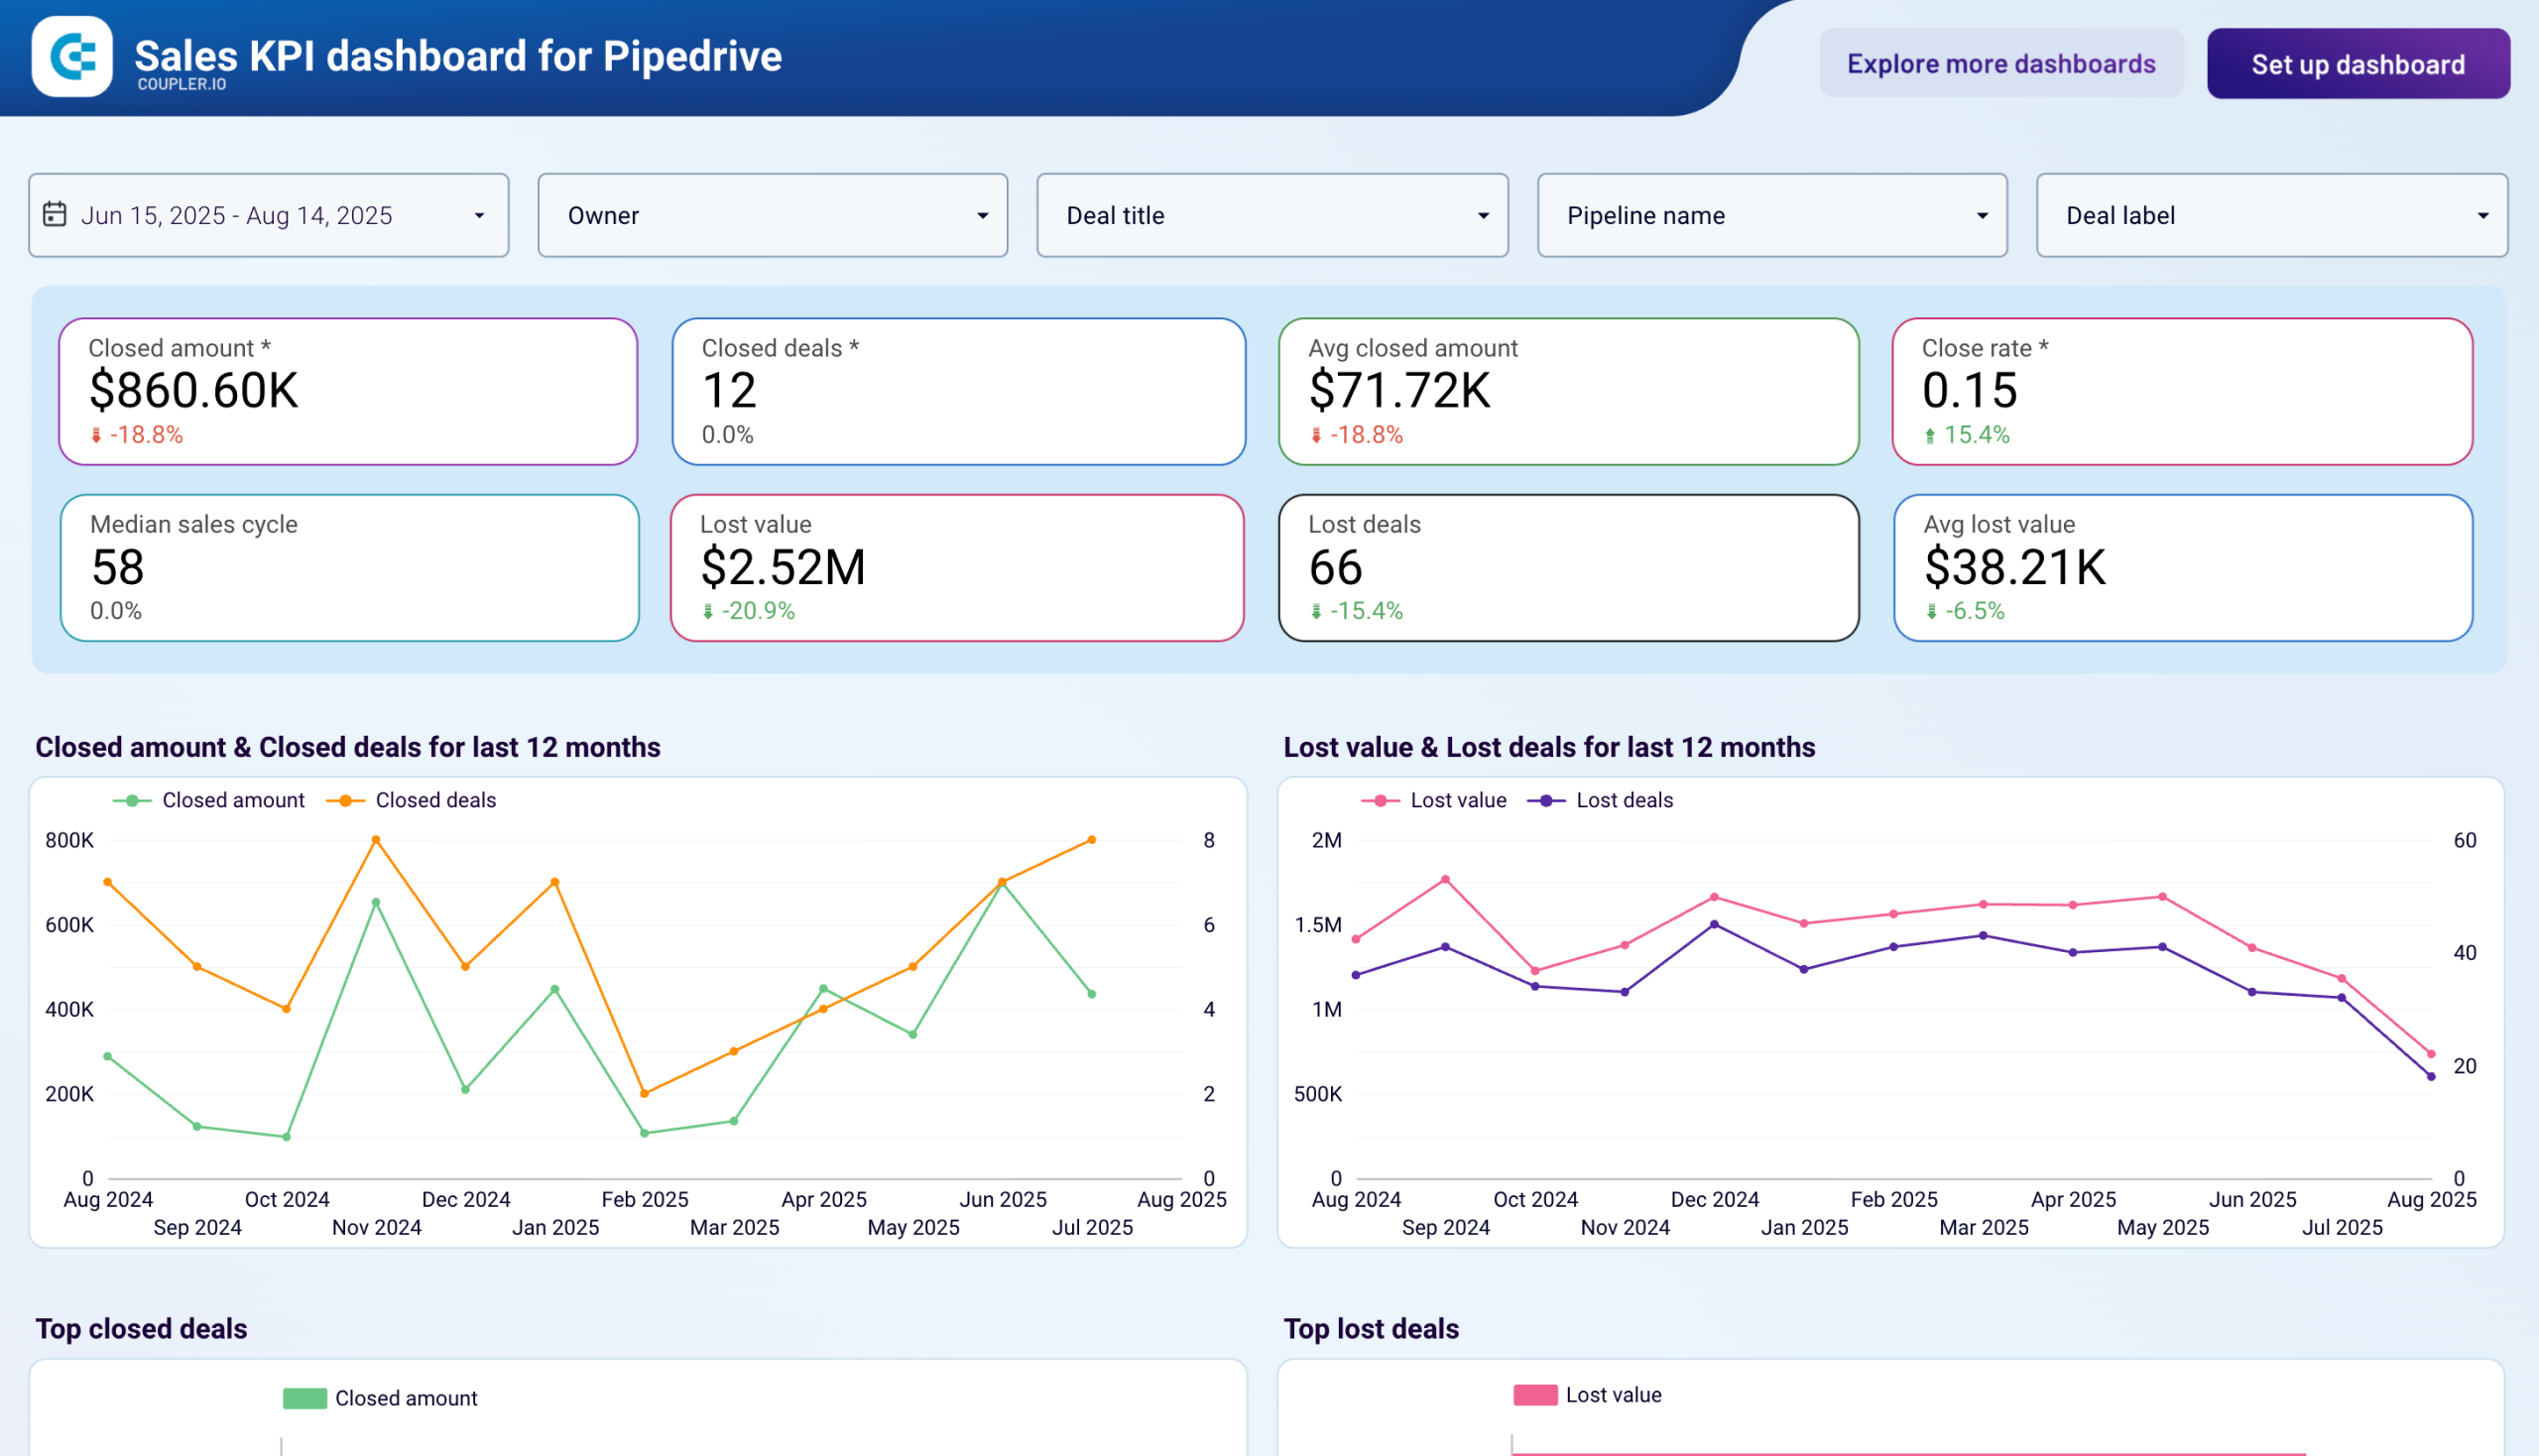
This report consolidates paid campaign data across Facebook Ads, LinkedIn Ads, Google Ads, and other platforms for all client accounts. It tracks how advertising investments translate into impressions, clicks, and engagement while monitoring cost efficiency metrics including CPM, CPC, and CTR. The visualization shows budget distribution patterns across platforms and time periods, helping agencies identify which channels deliver optimal results for each client. For agencies managing dozens of client campaigns simultaneously, this centralized view eliminates the need to access individual platform interfaces, enabling faster identification of underperforming campaigns that require optimization or budget reallocation to higher-performing channels.
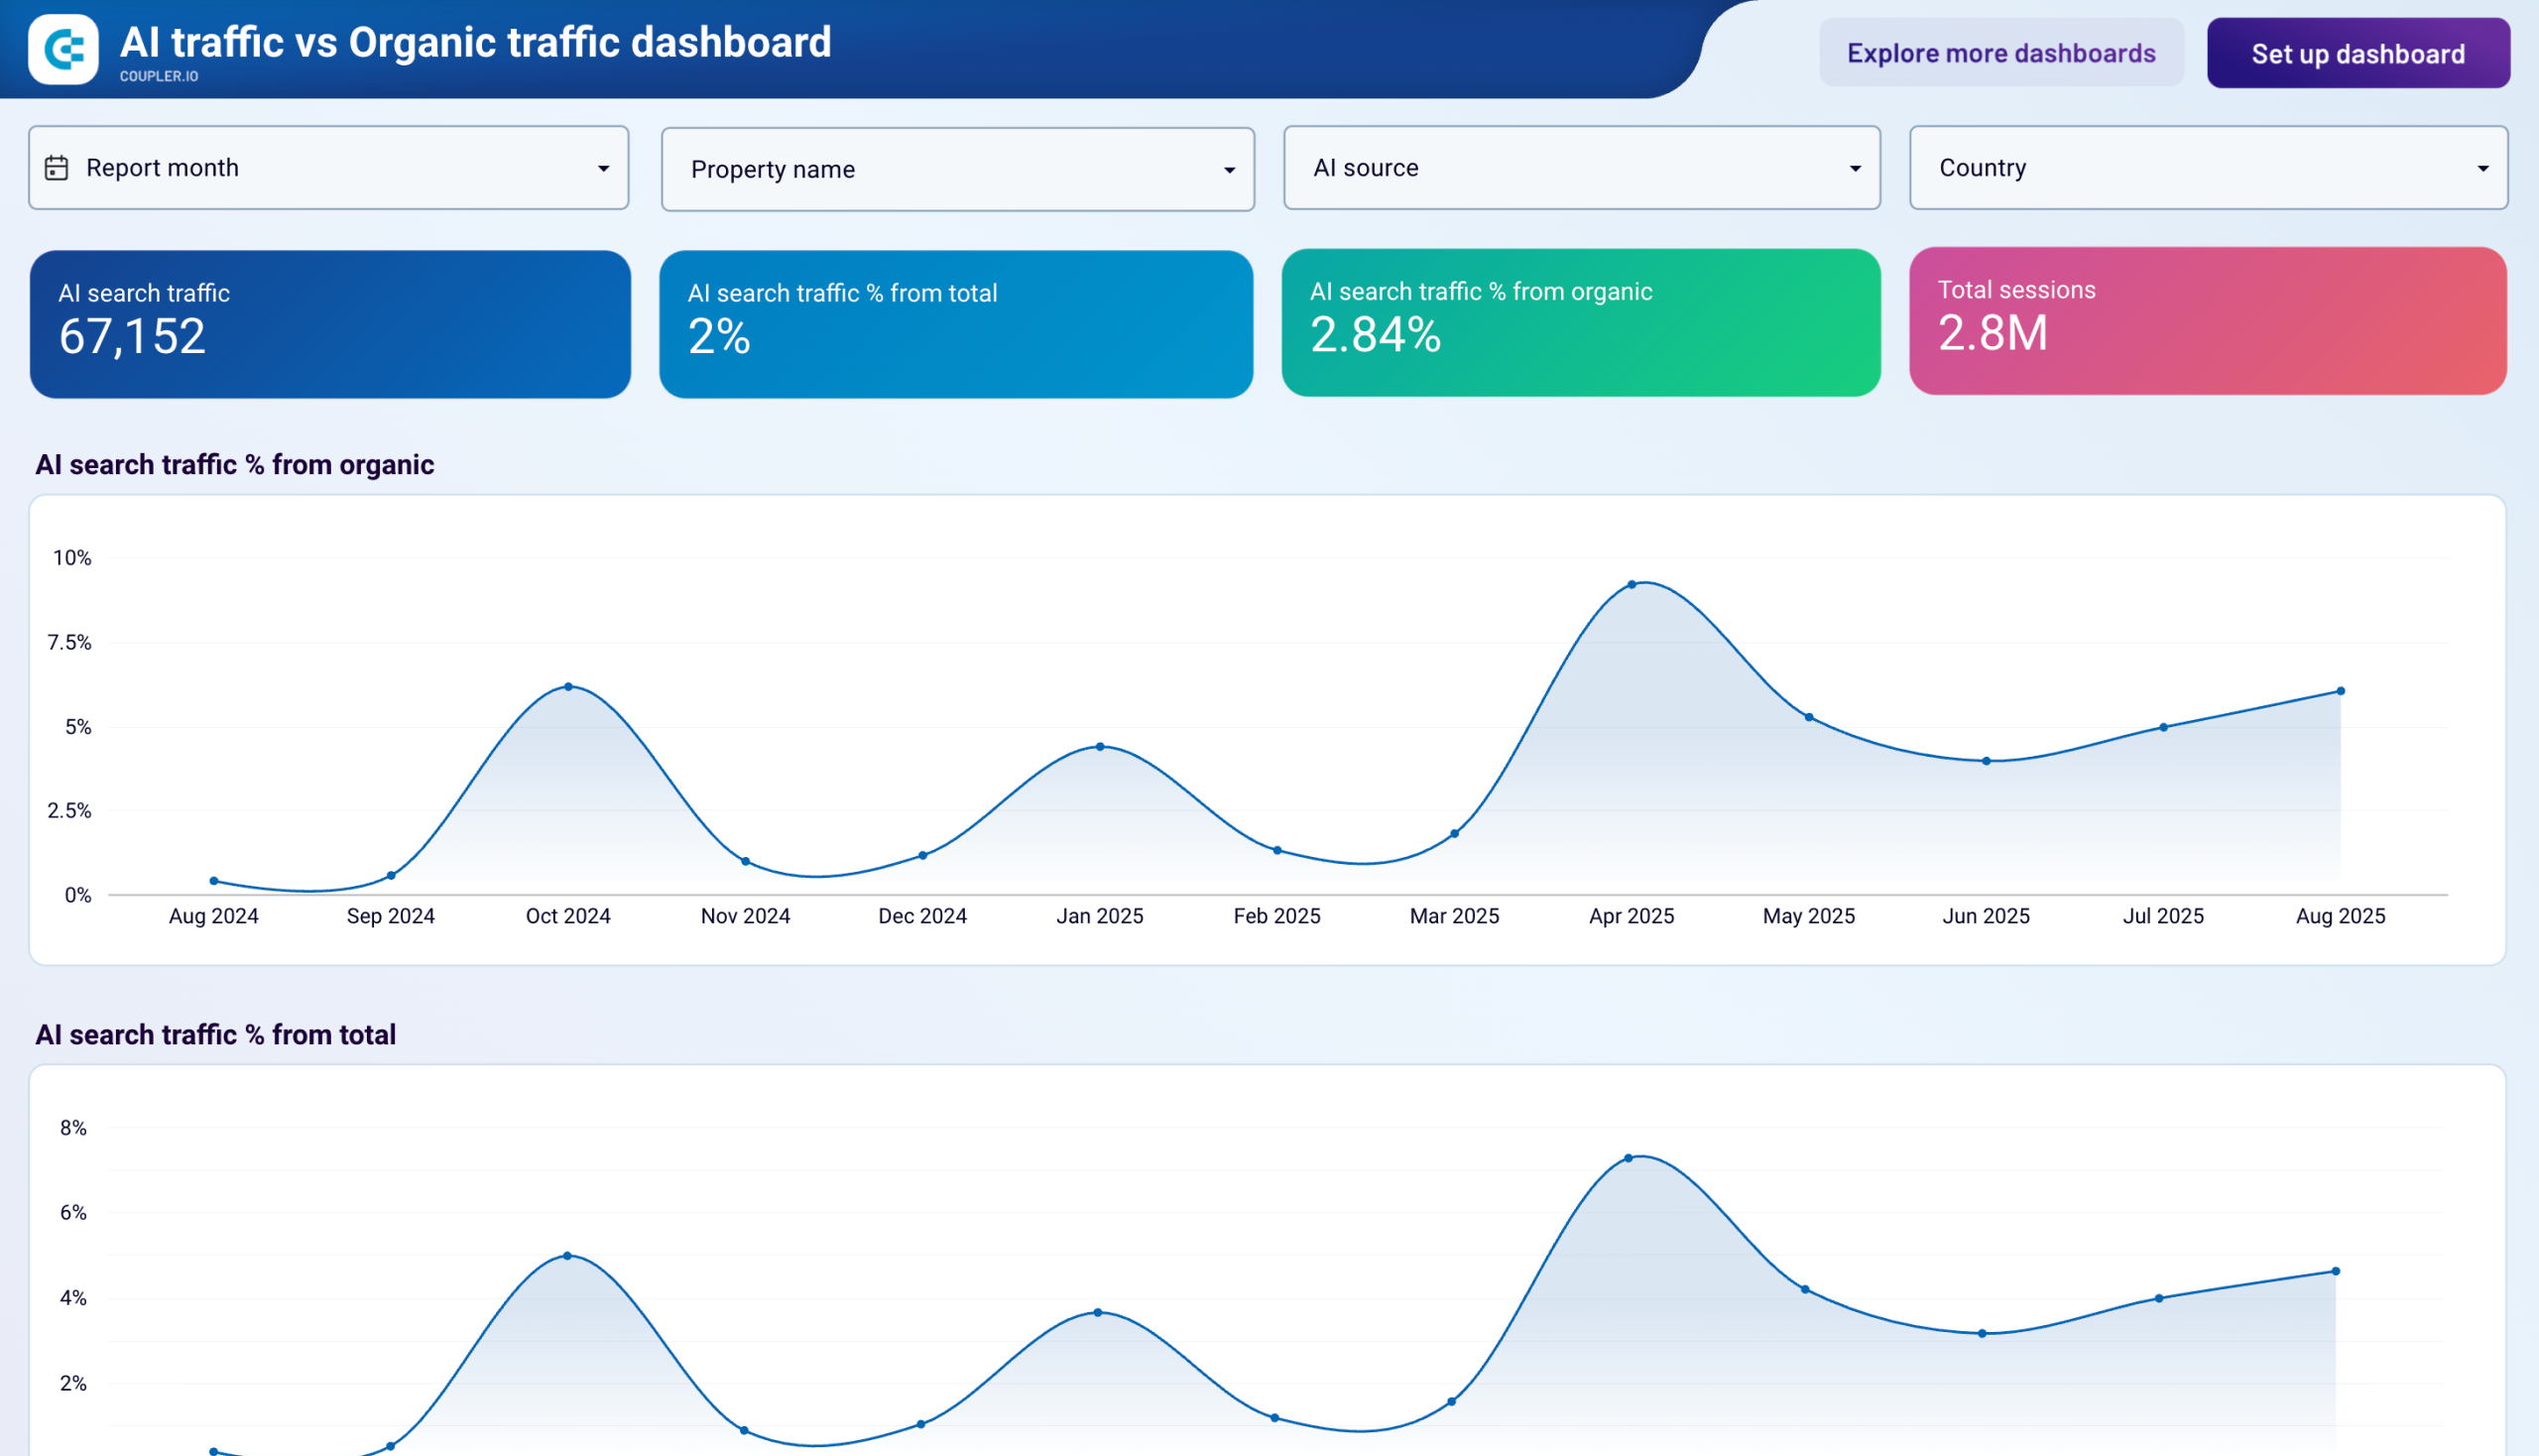
The traffic aggregation report combines Google Analytics 4 data from multiple client properties into a single interface, showing user acquisition patterns, session metrics, and conversion performance across the entire client portfolio. It tracks total traffic volume, new versus returning visitor ratios, and engagement metrics while providing breakdowns by traffic source, geographic location, and device type. This report proves particularly valuable during client reviews when demonstrating collective portfolio performance or identifying trends that affect multiple accounts. Agencies can filter by specific client properties to drill into individual account performance while maintaining the ability to analyze aggregate patterns that inform strategic recommendations across the portfolio.
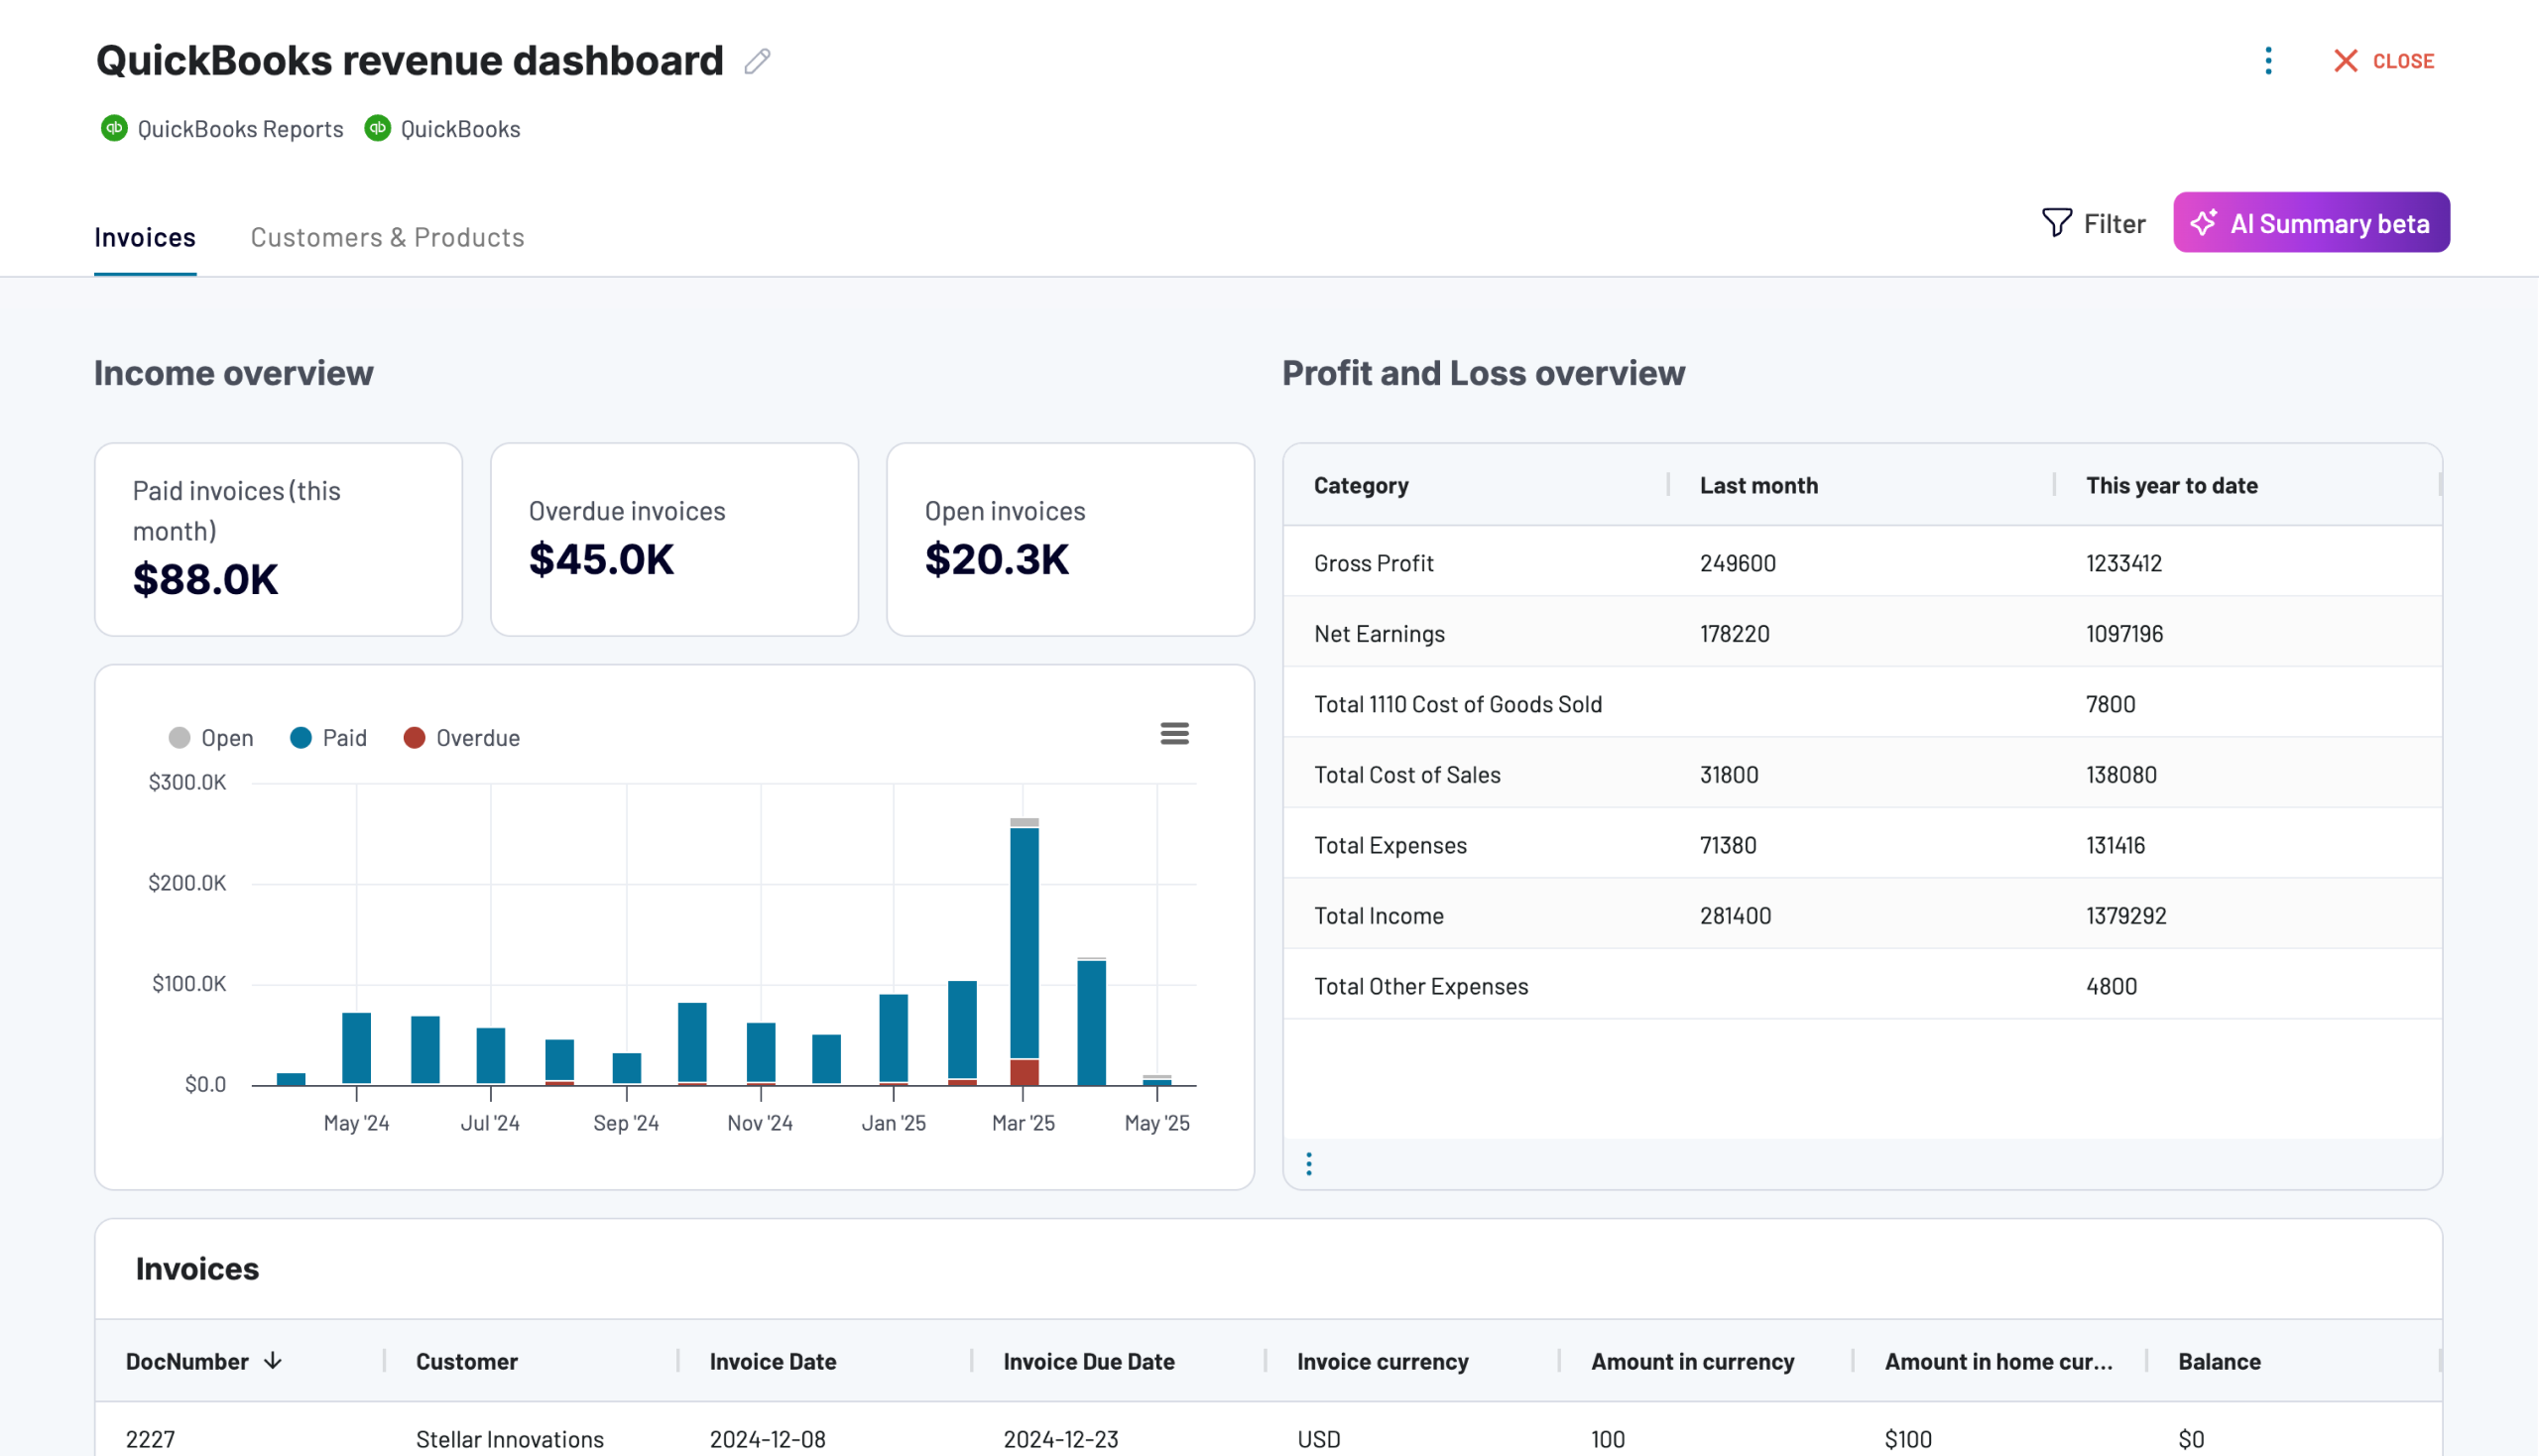
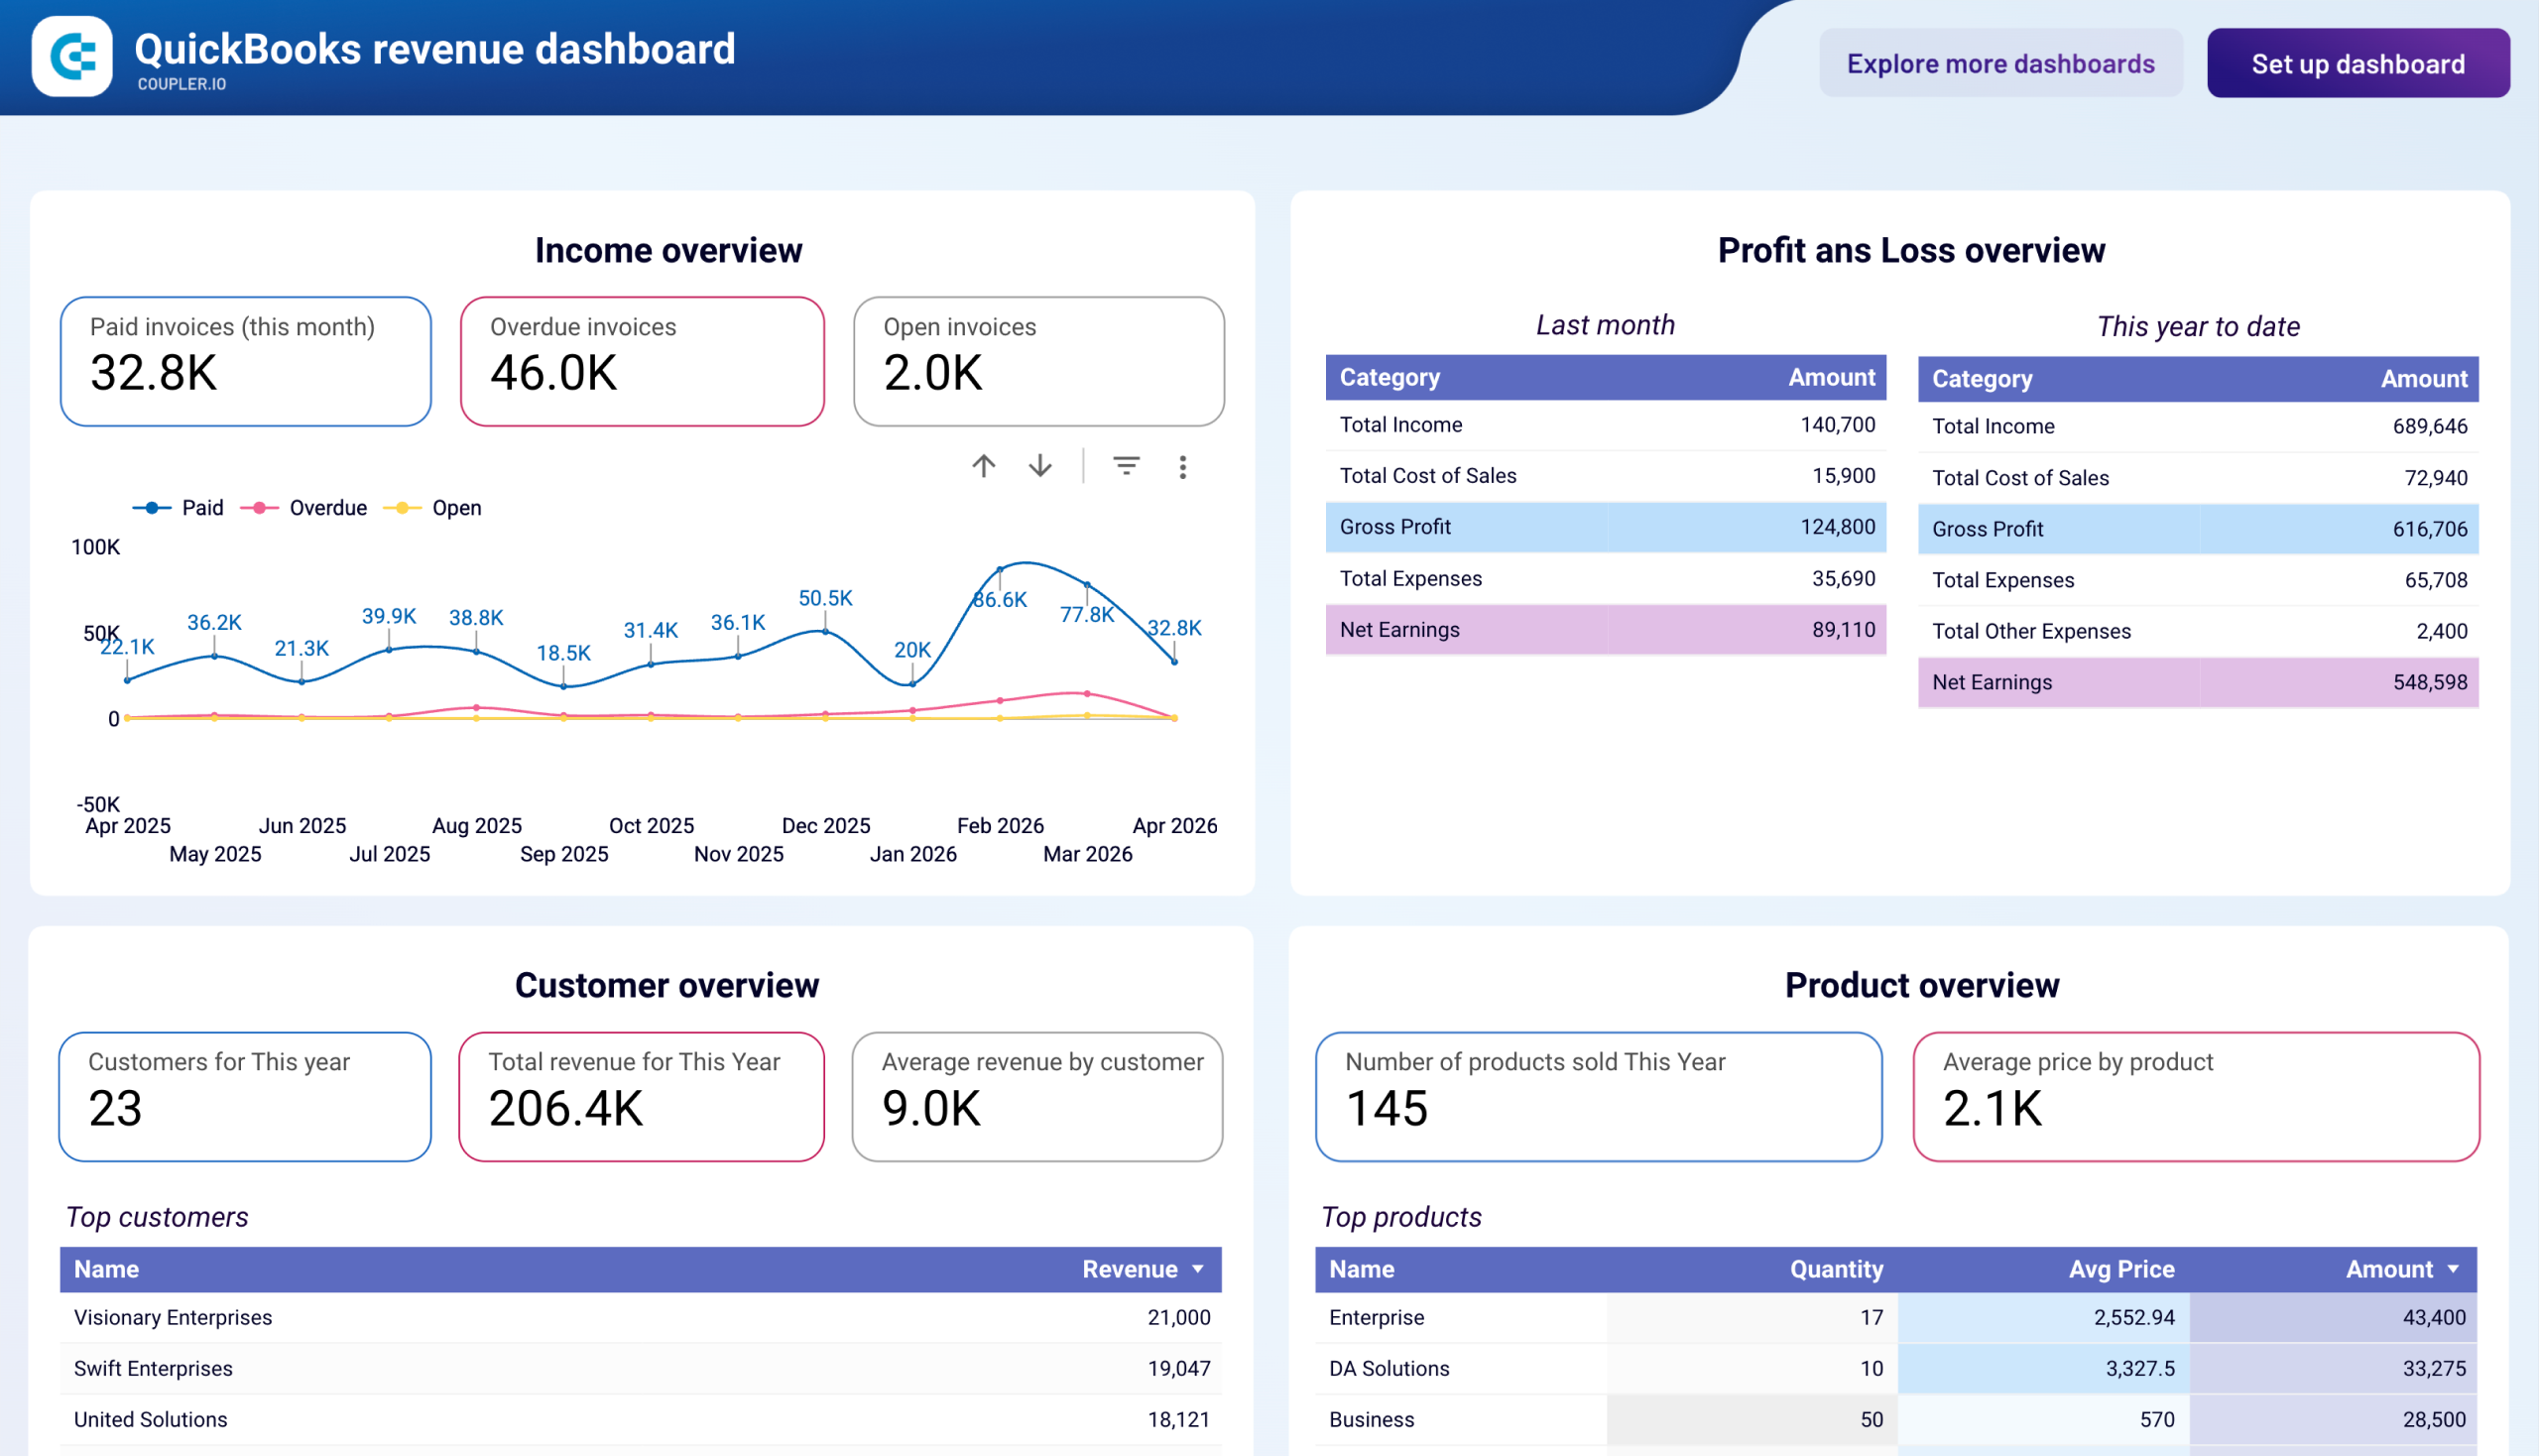
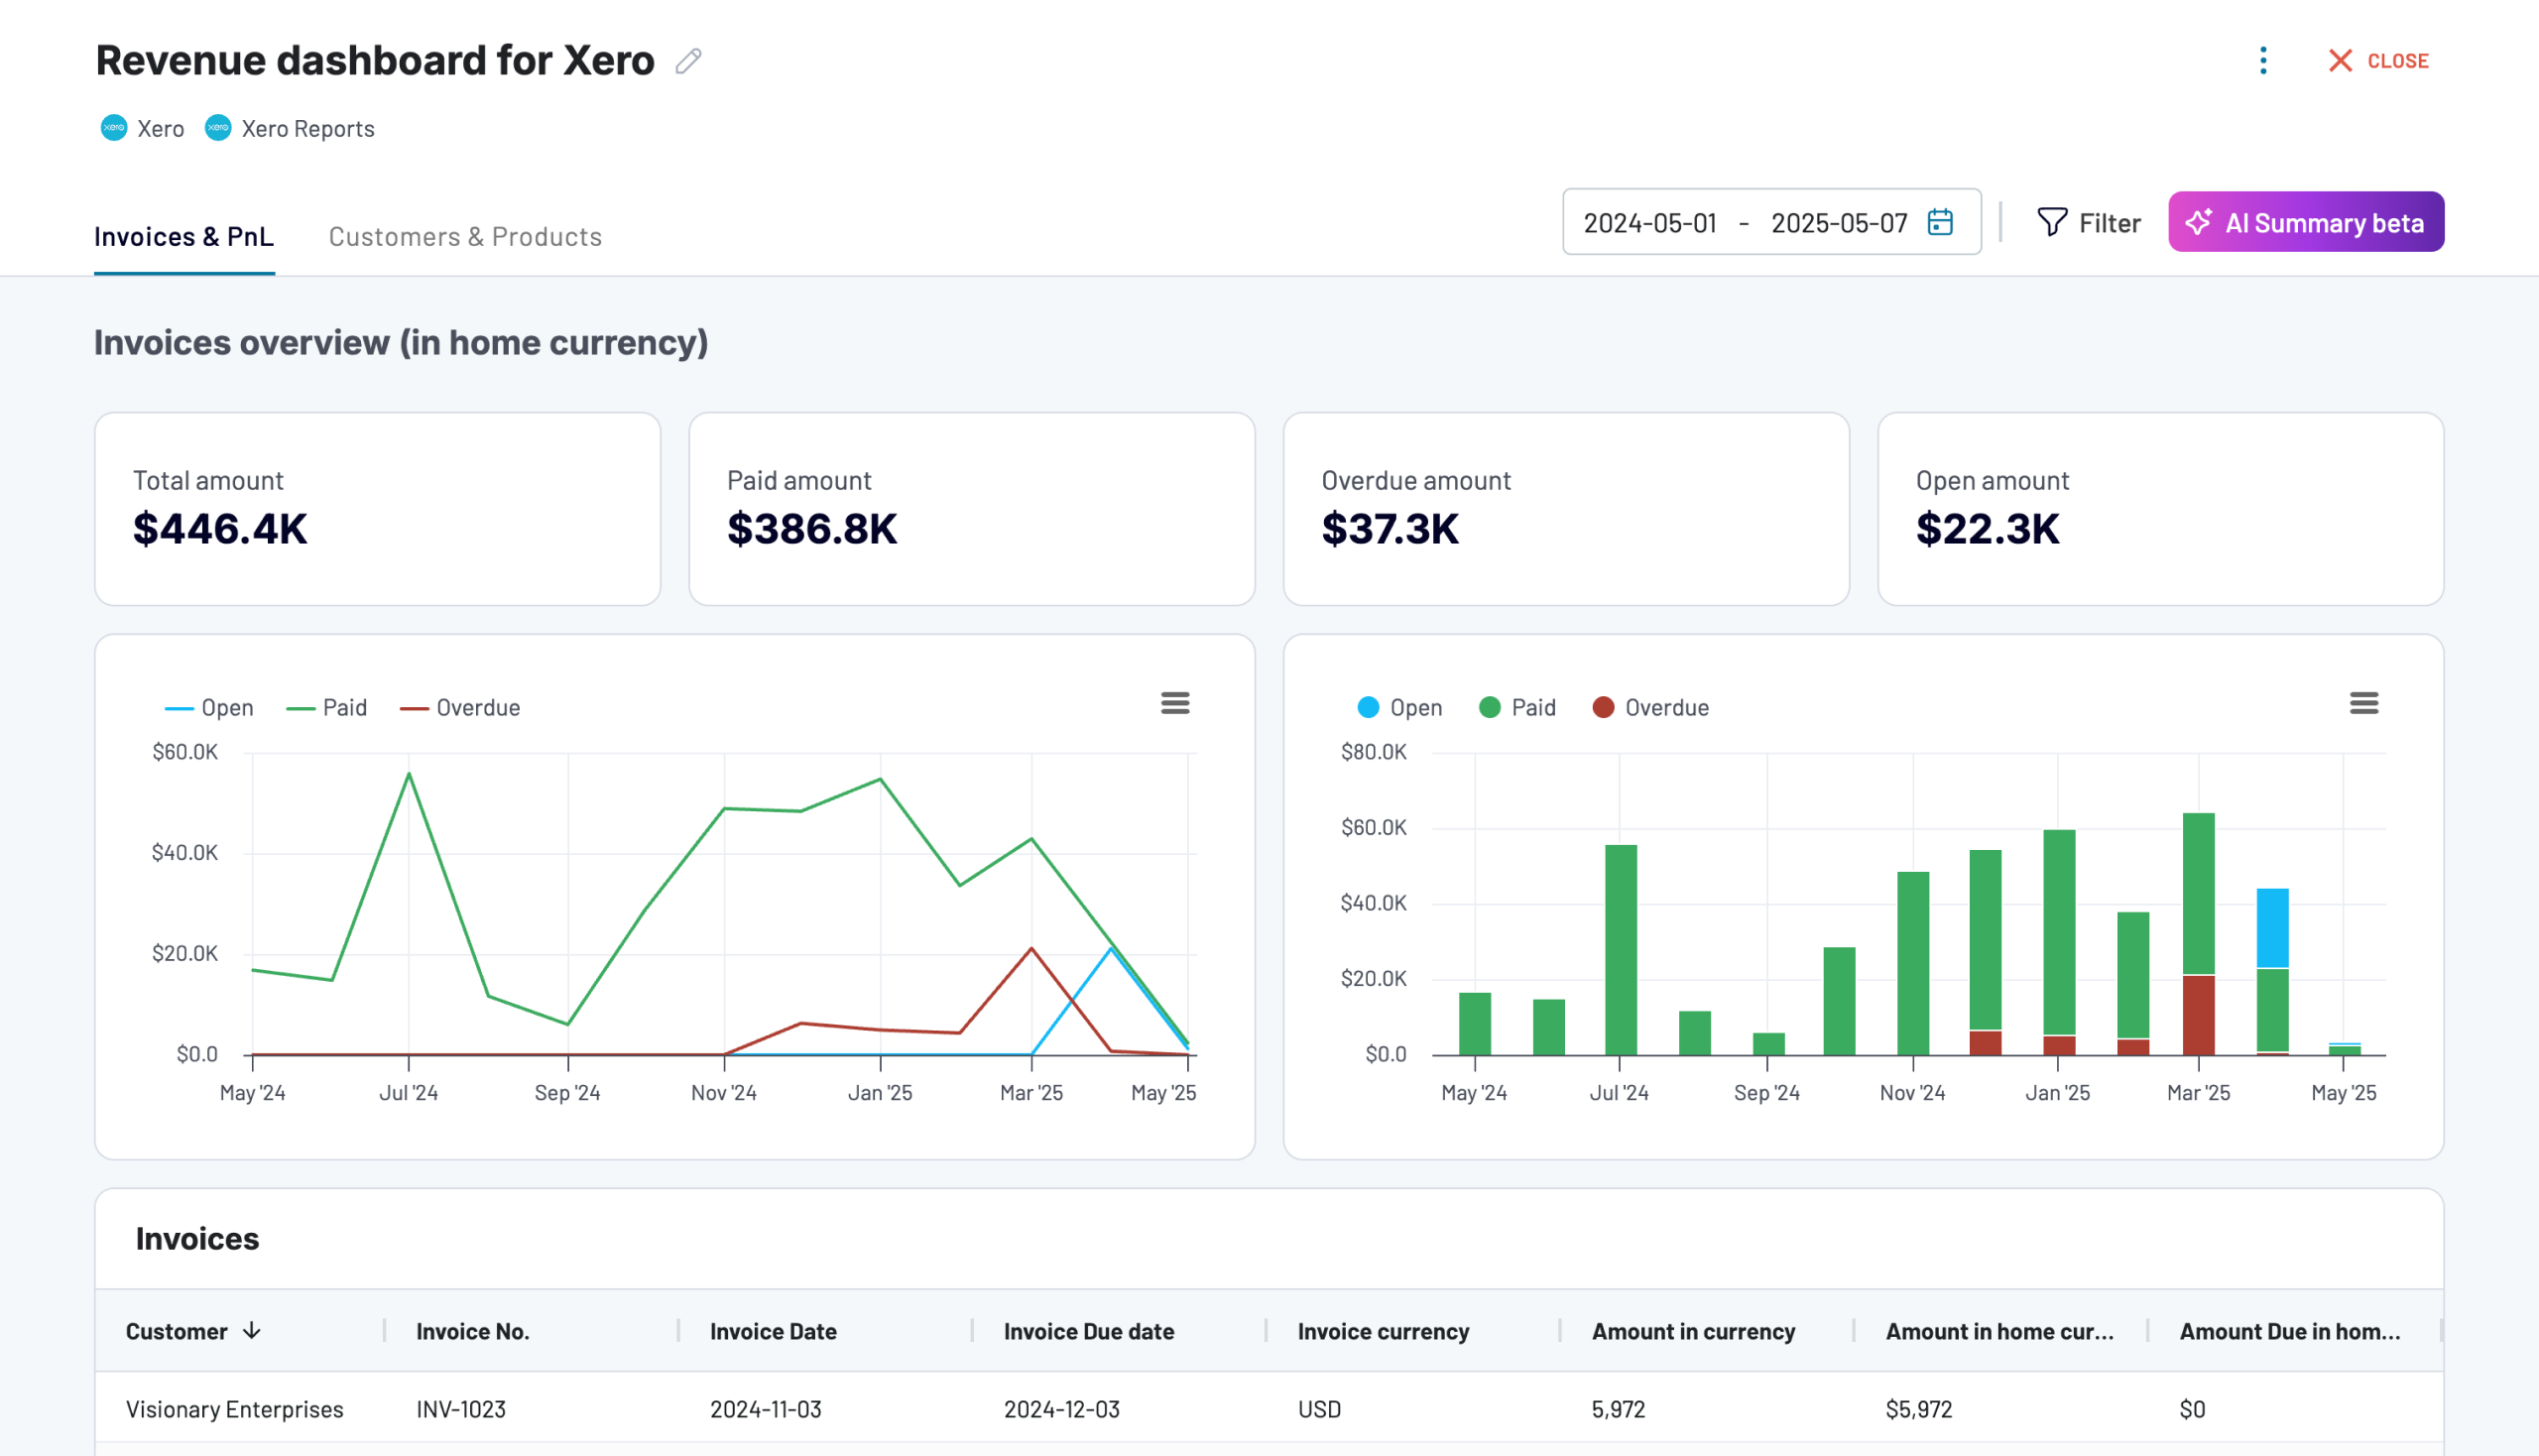
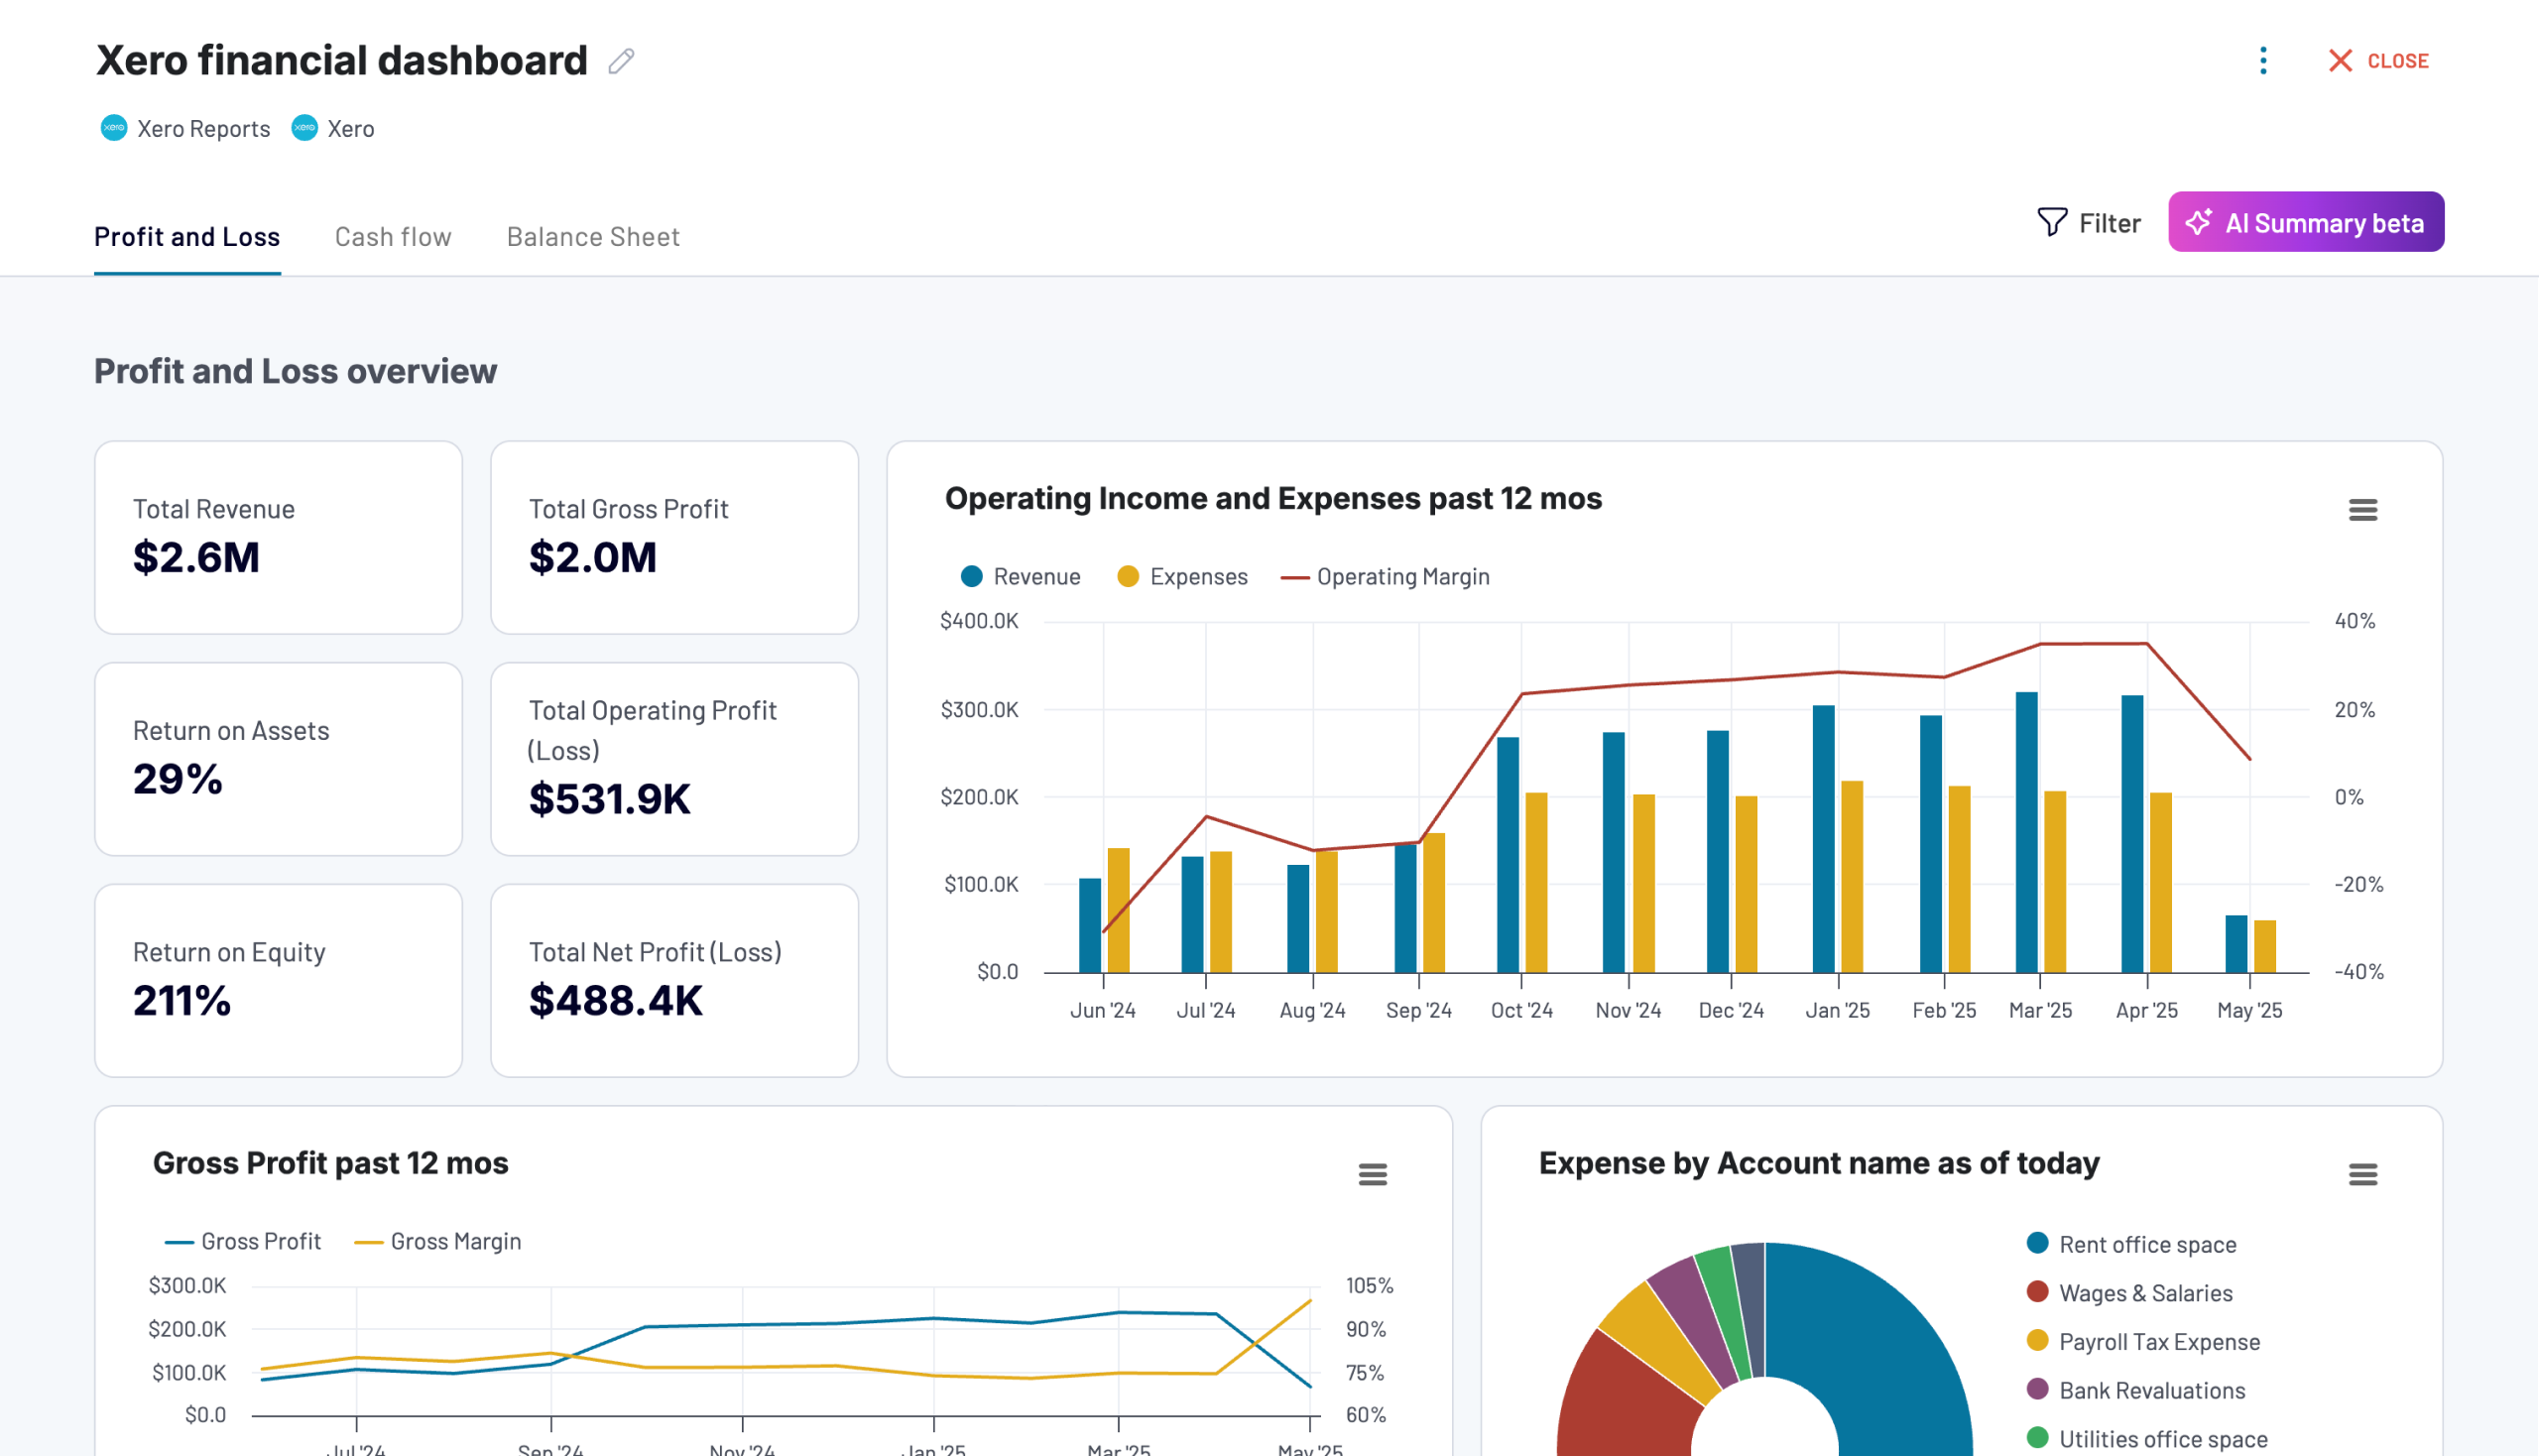
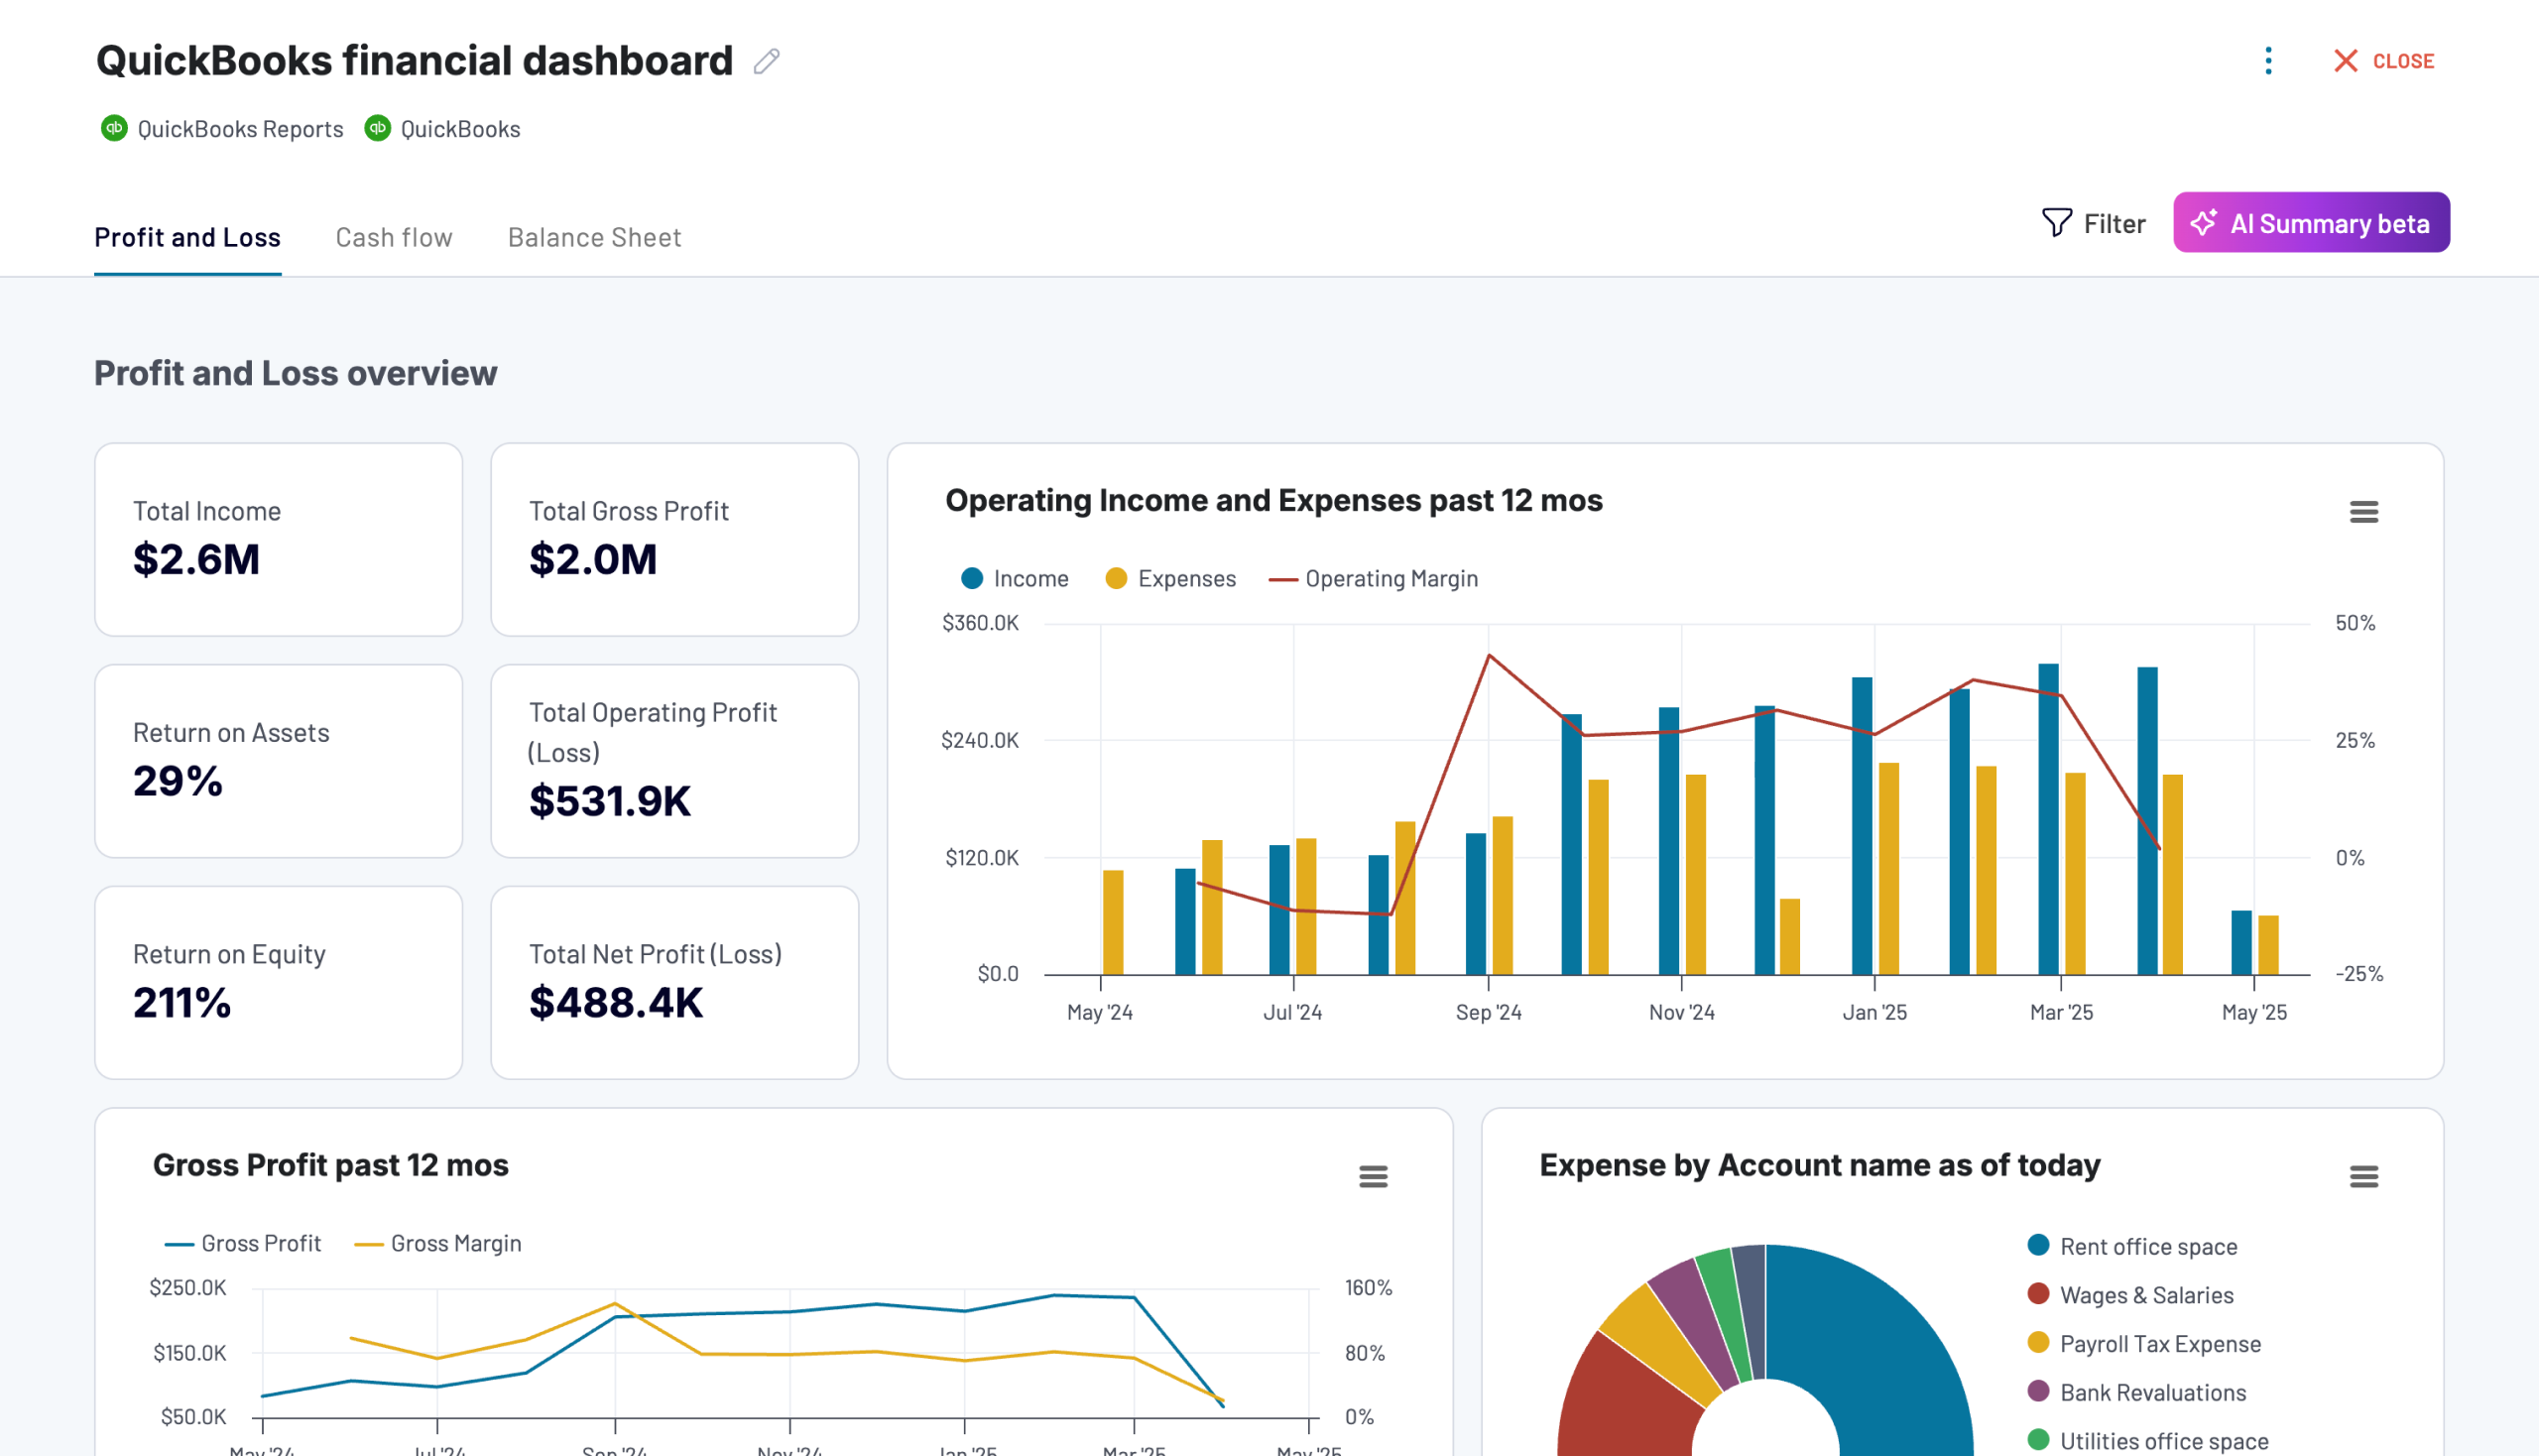
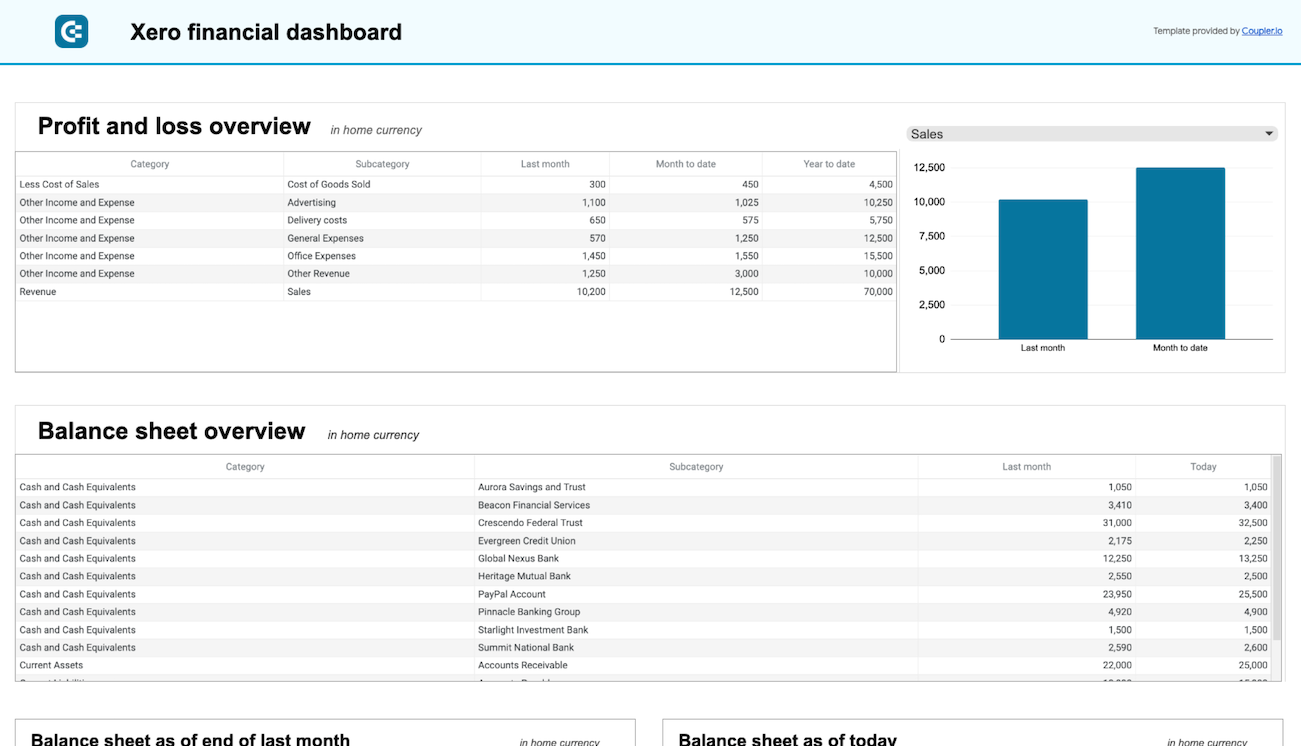
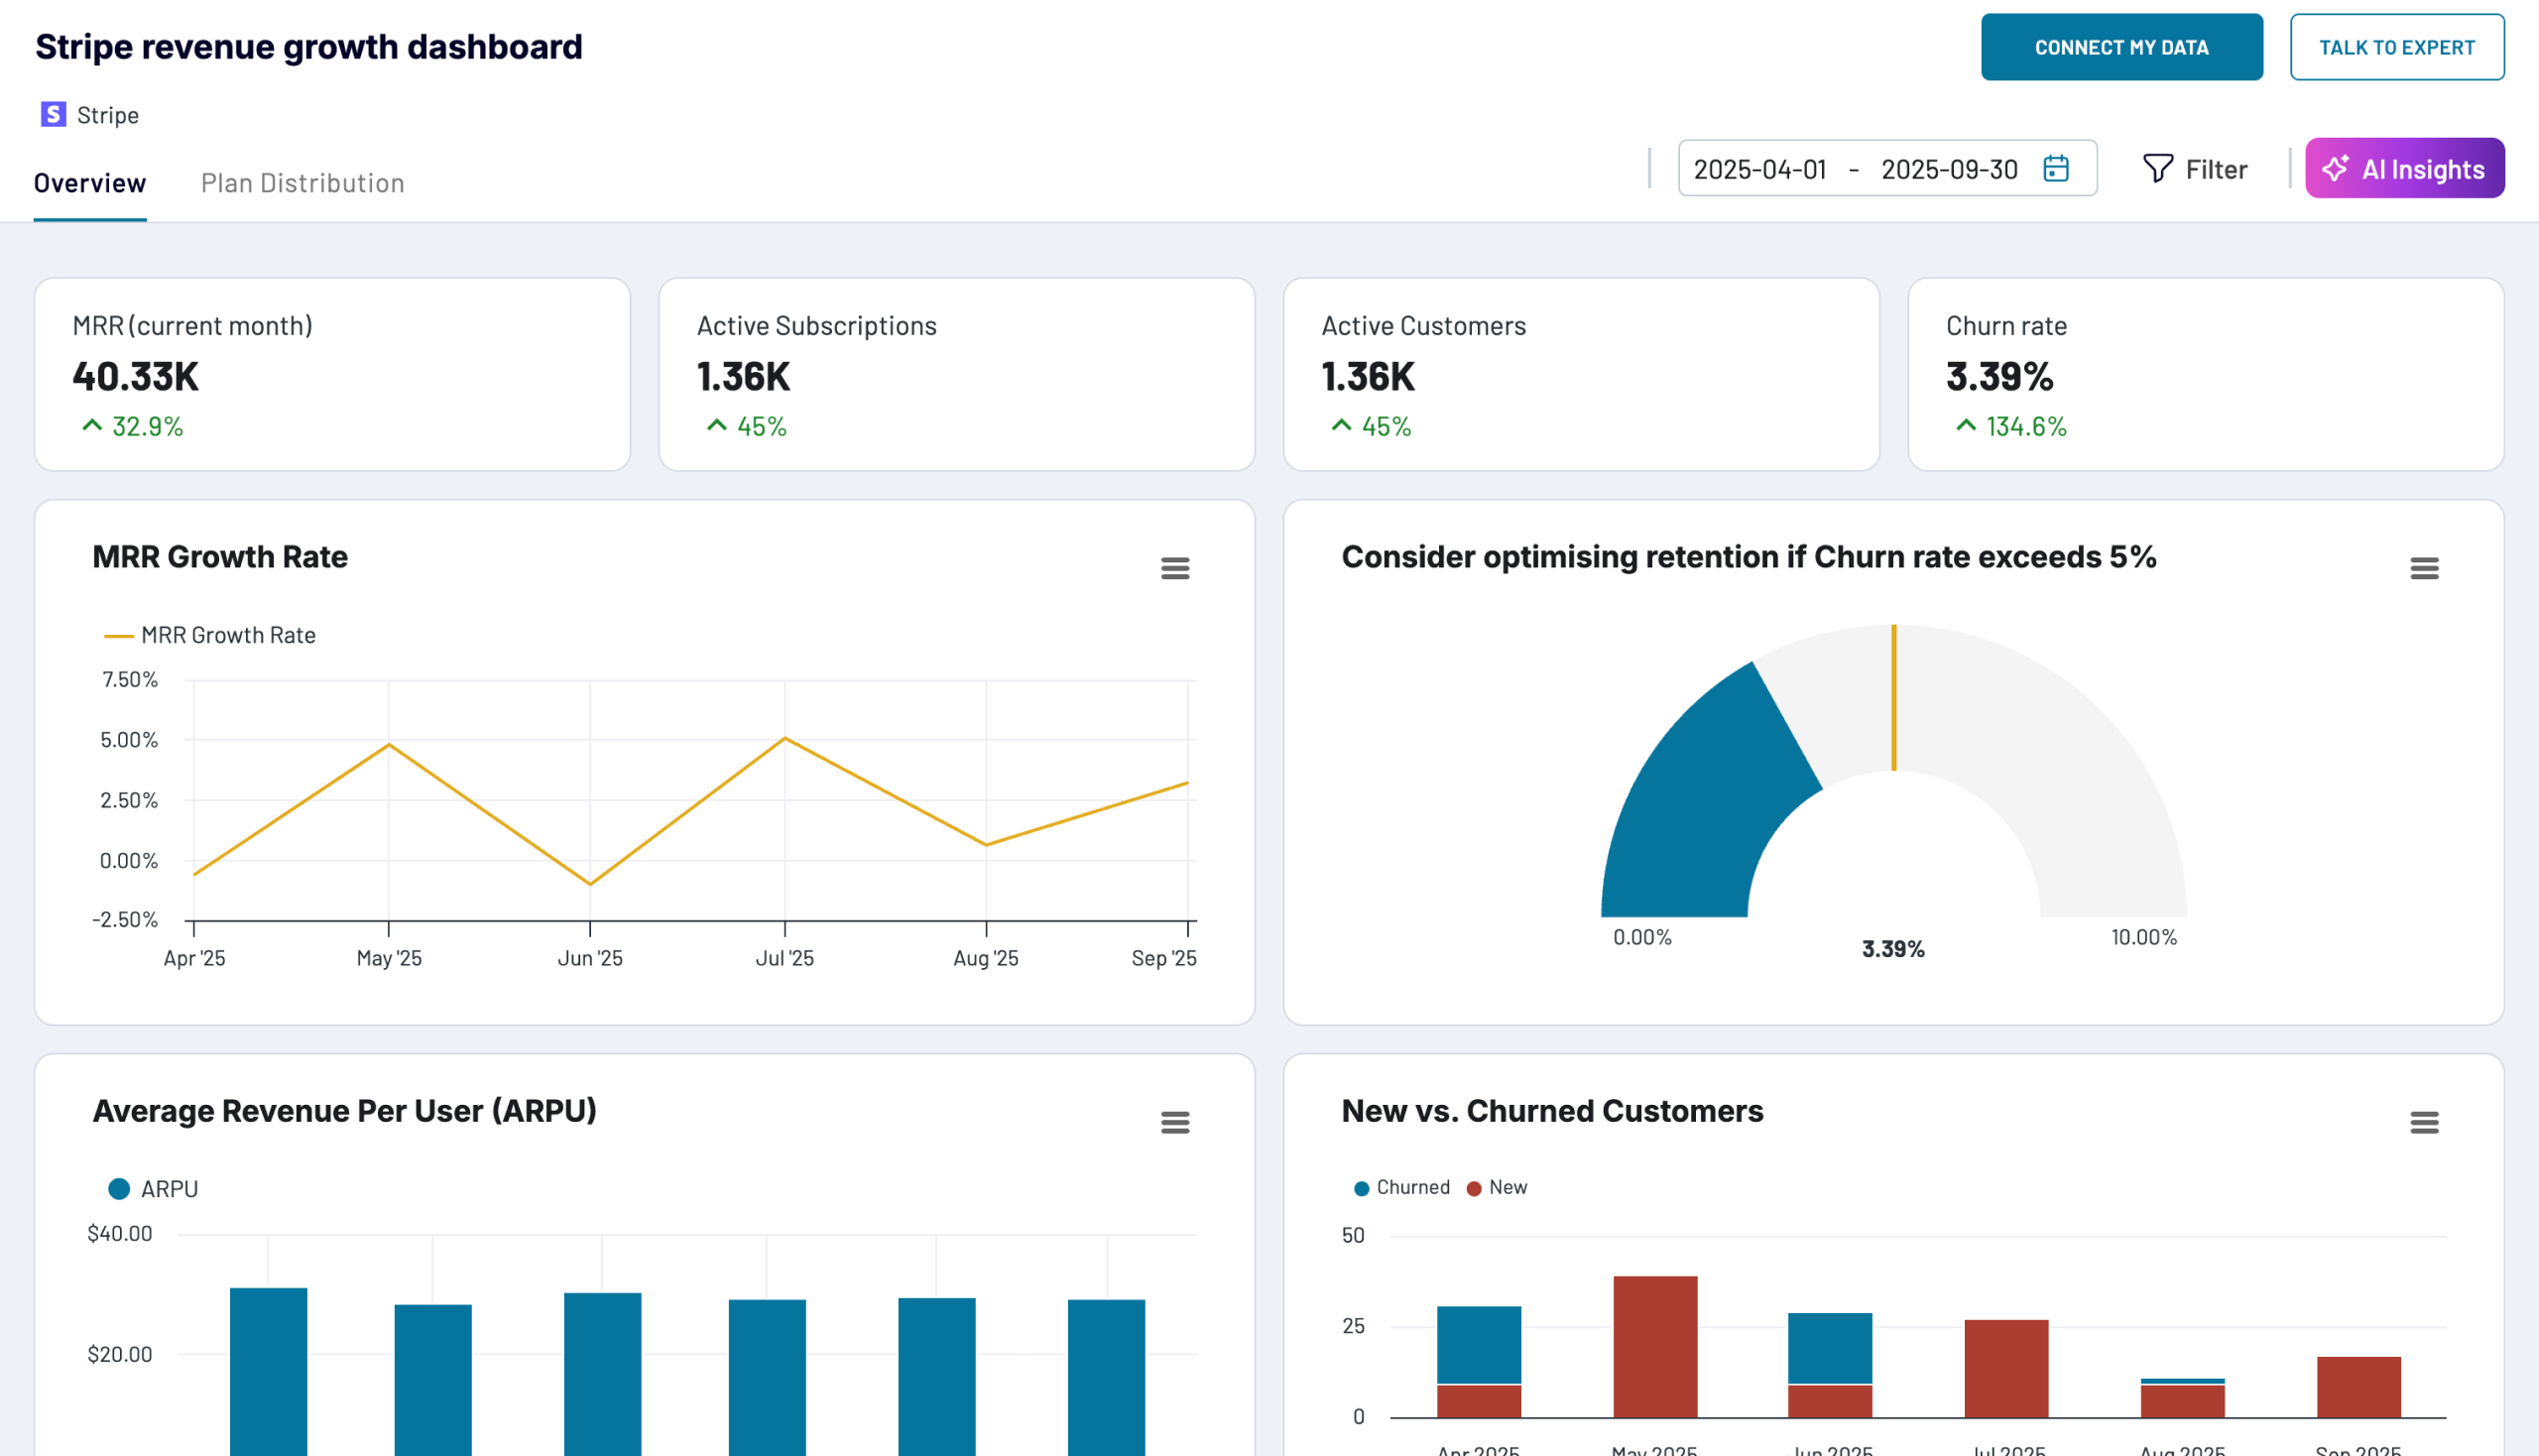
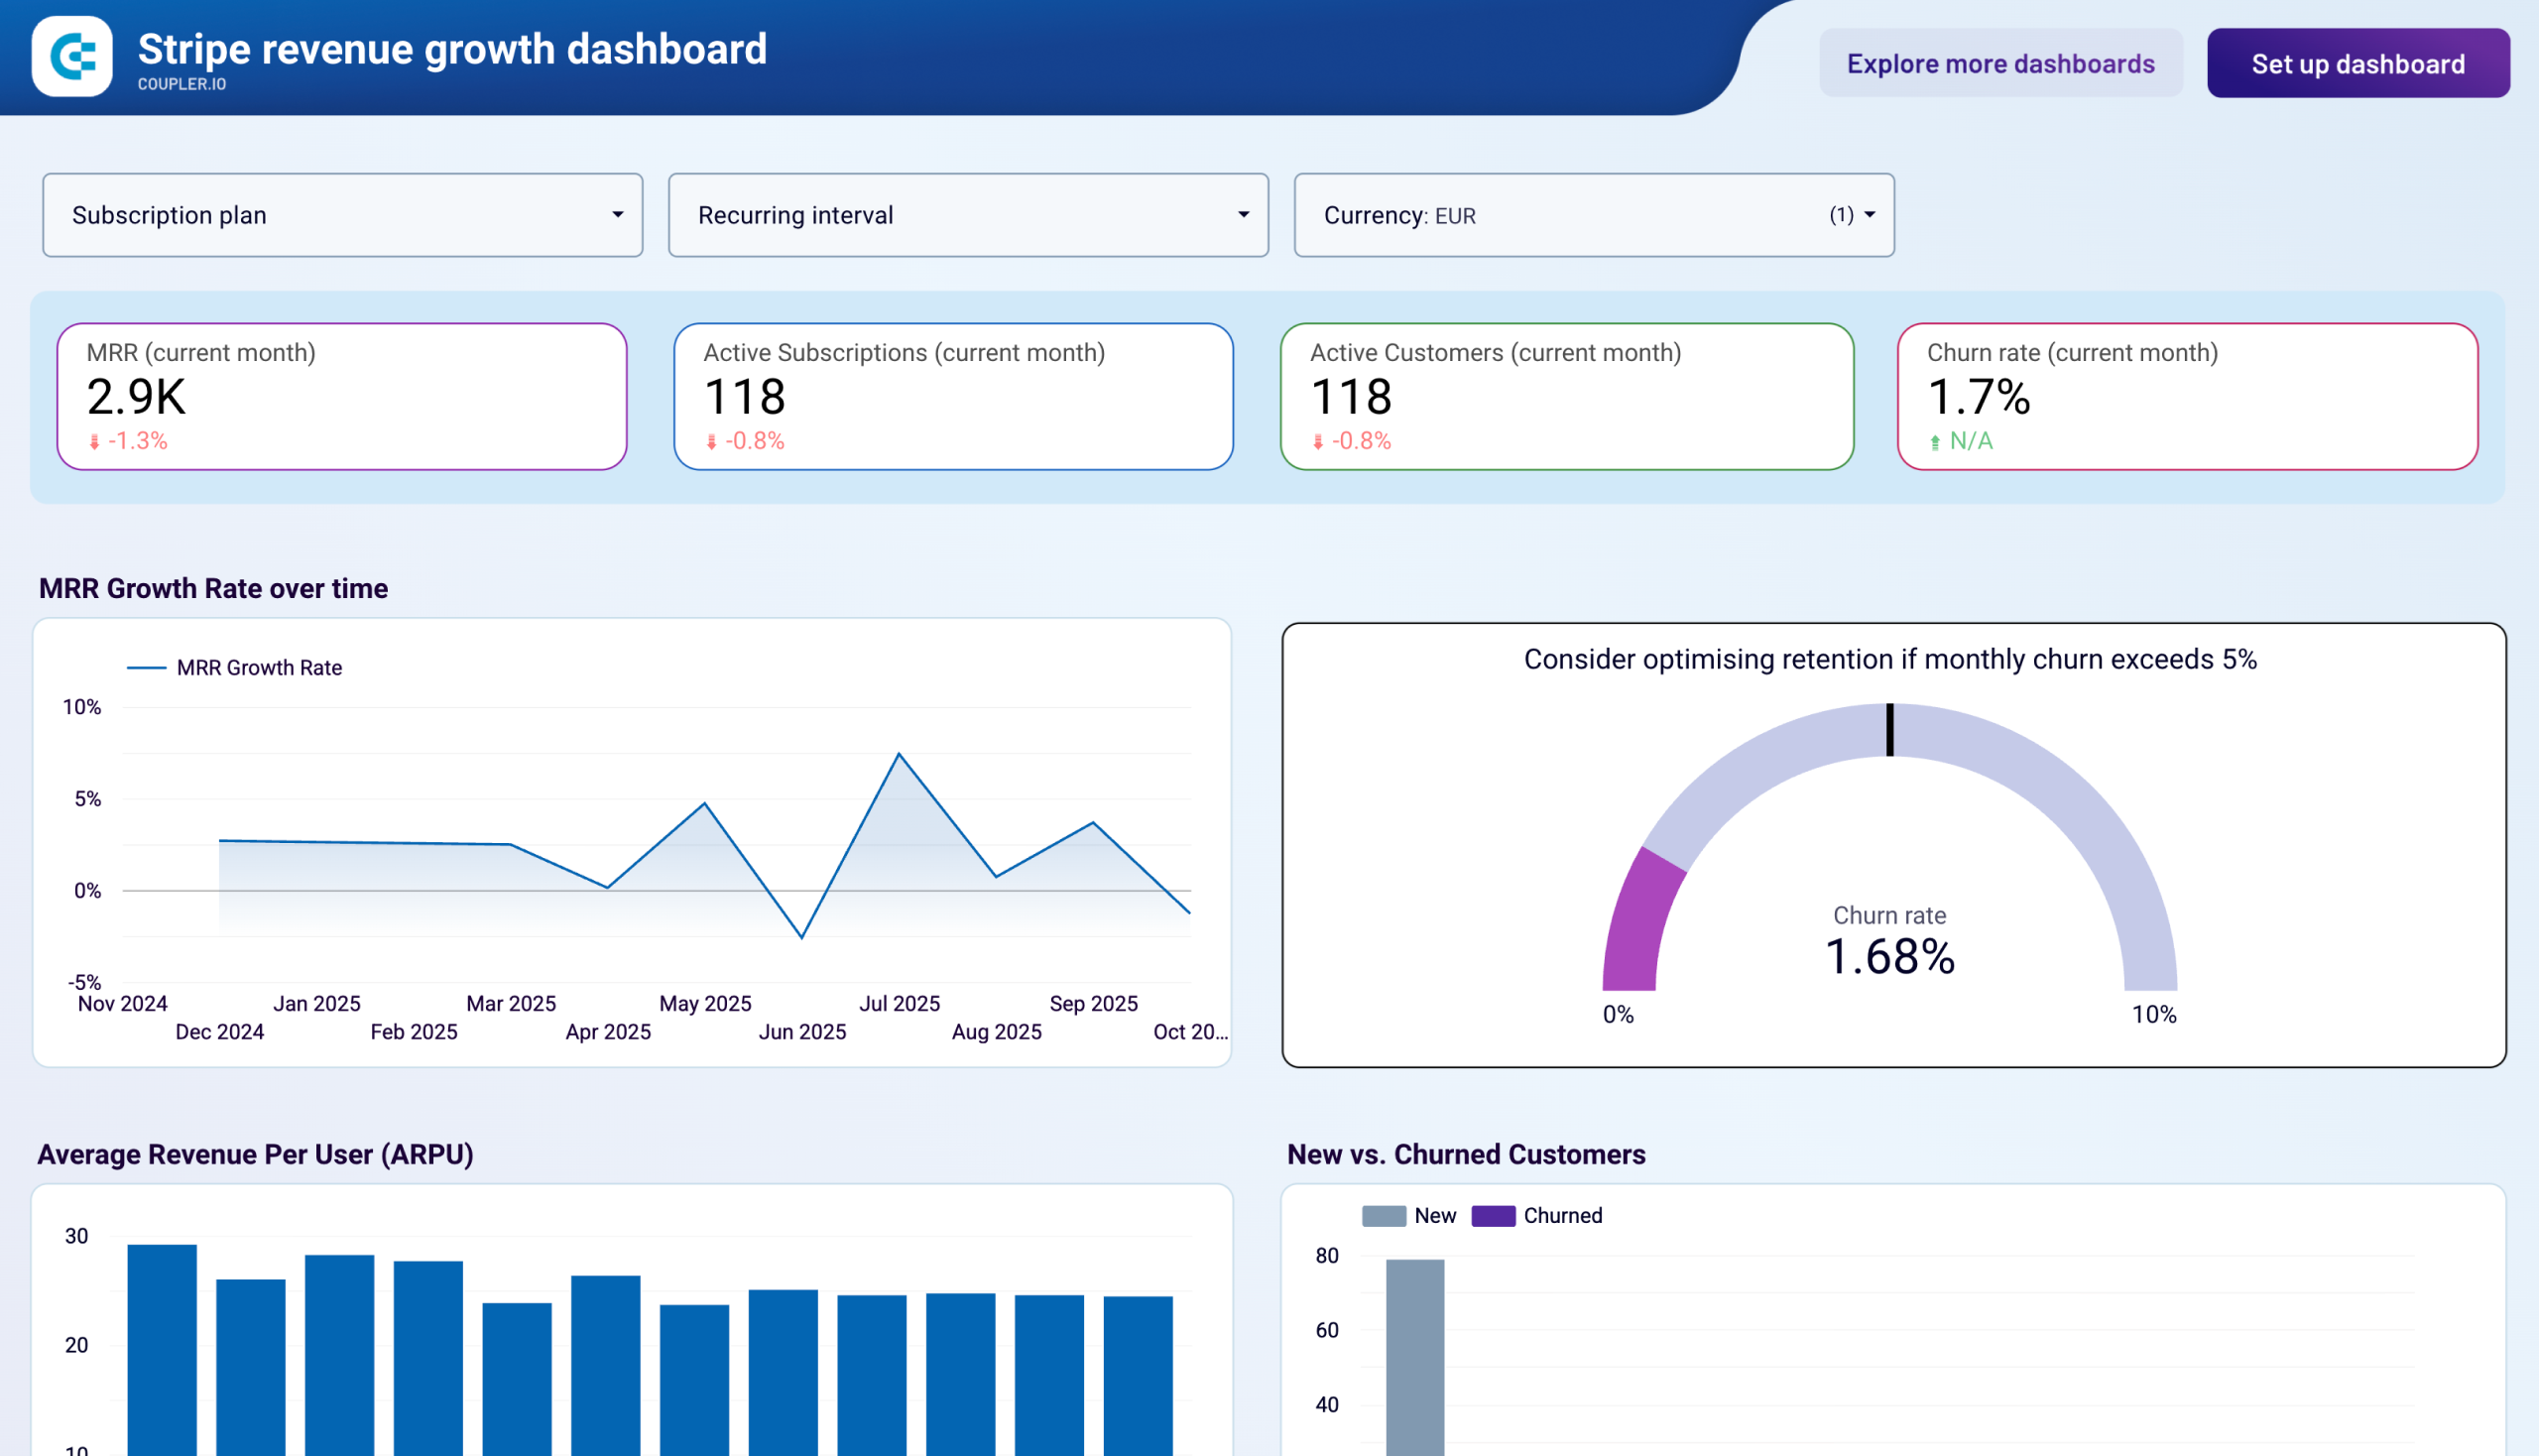
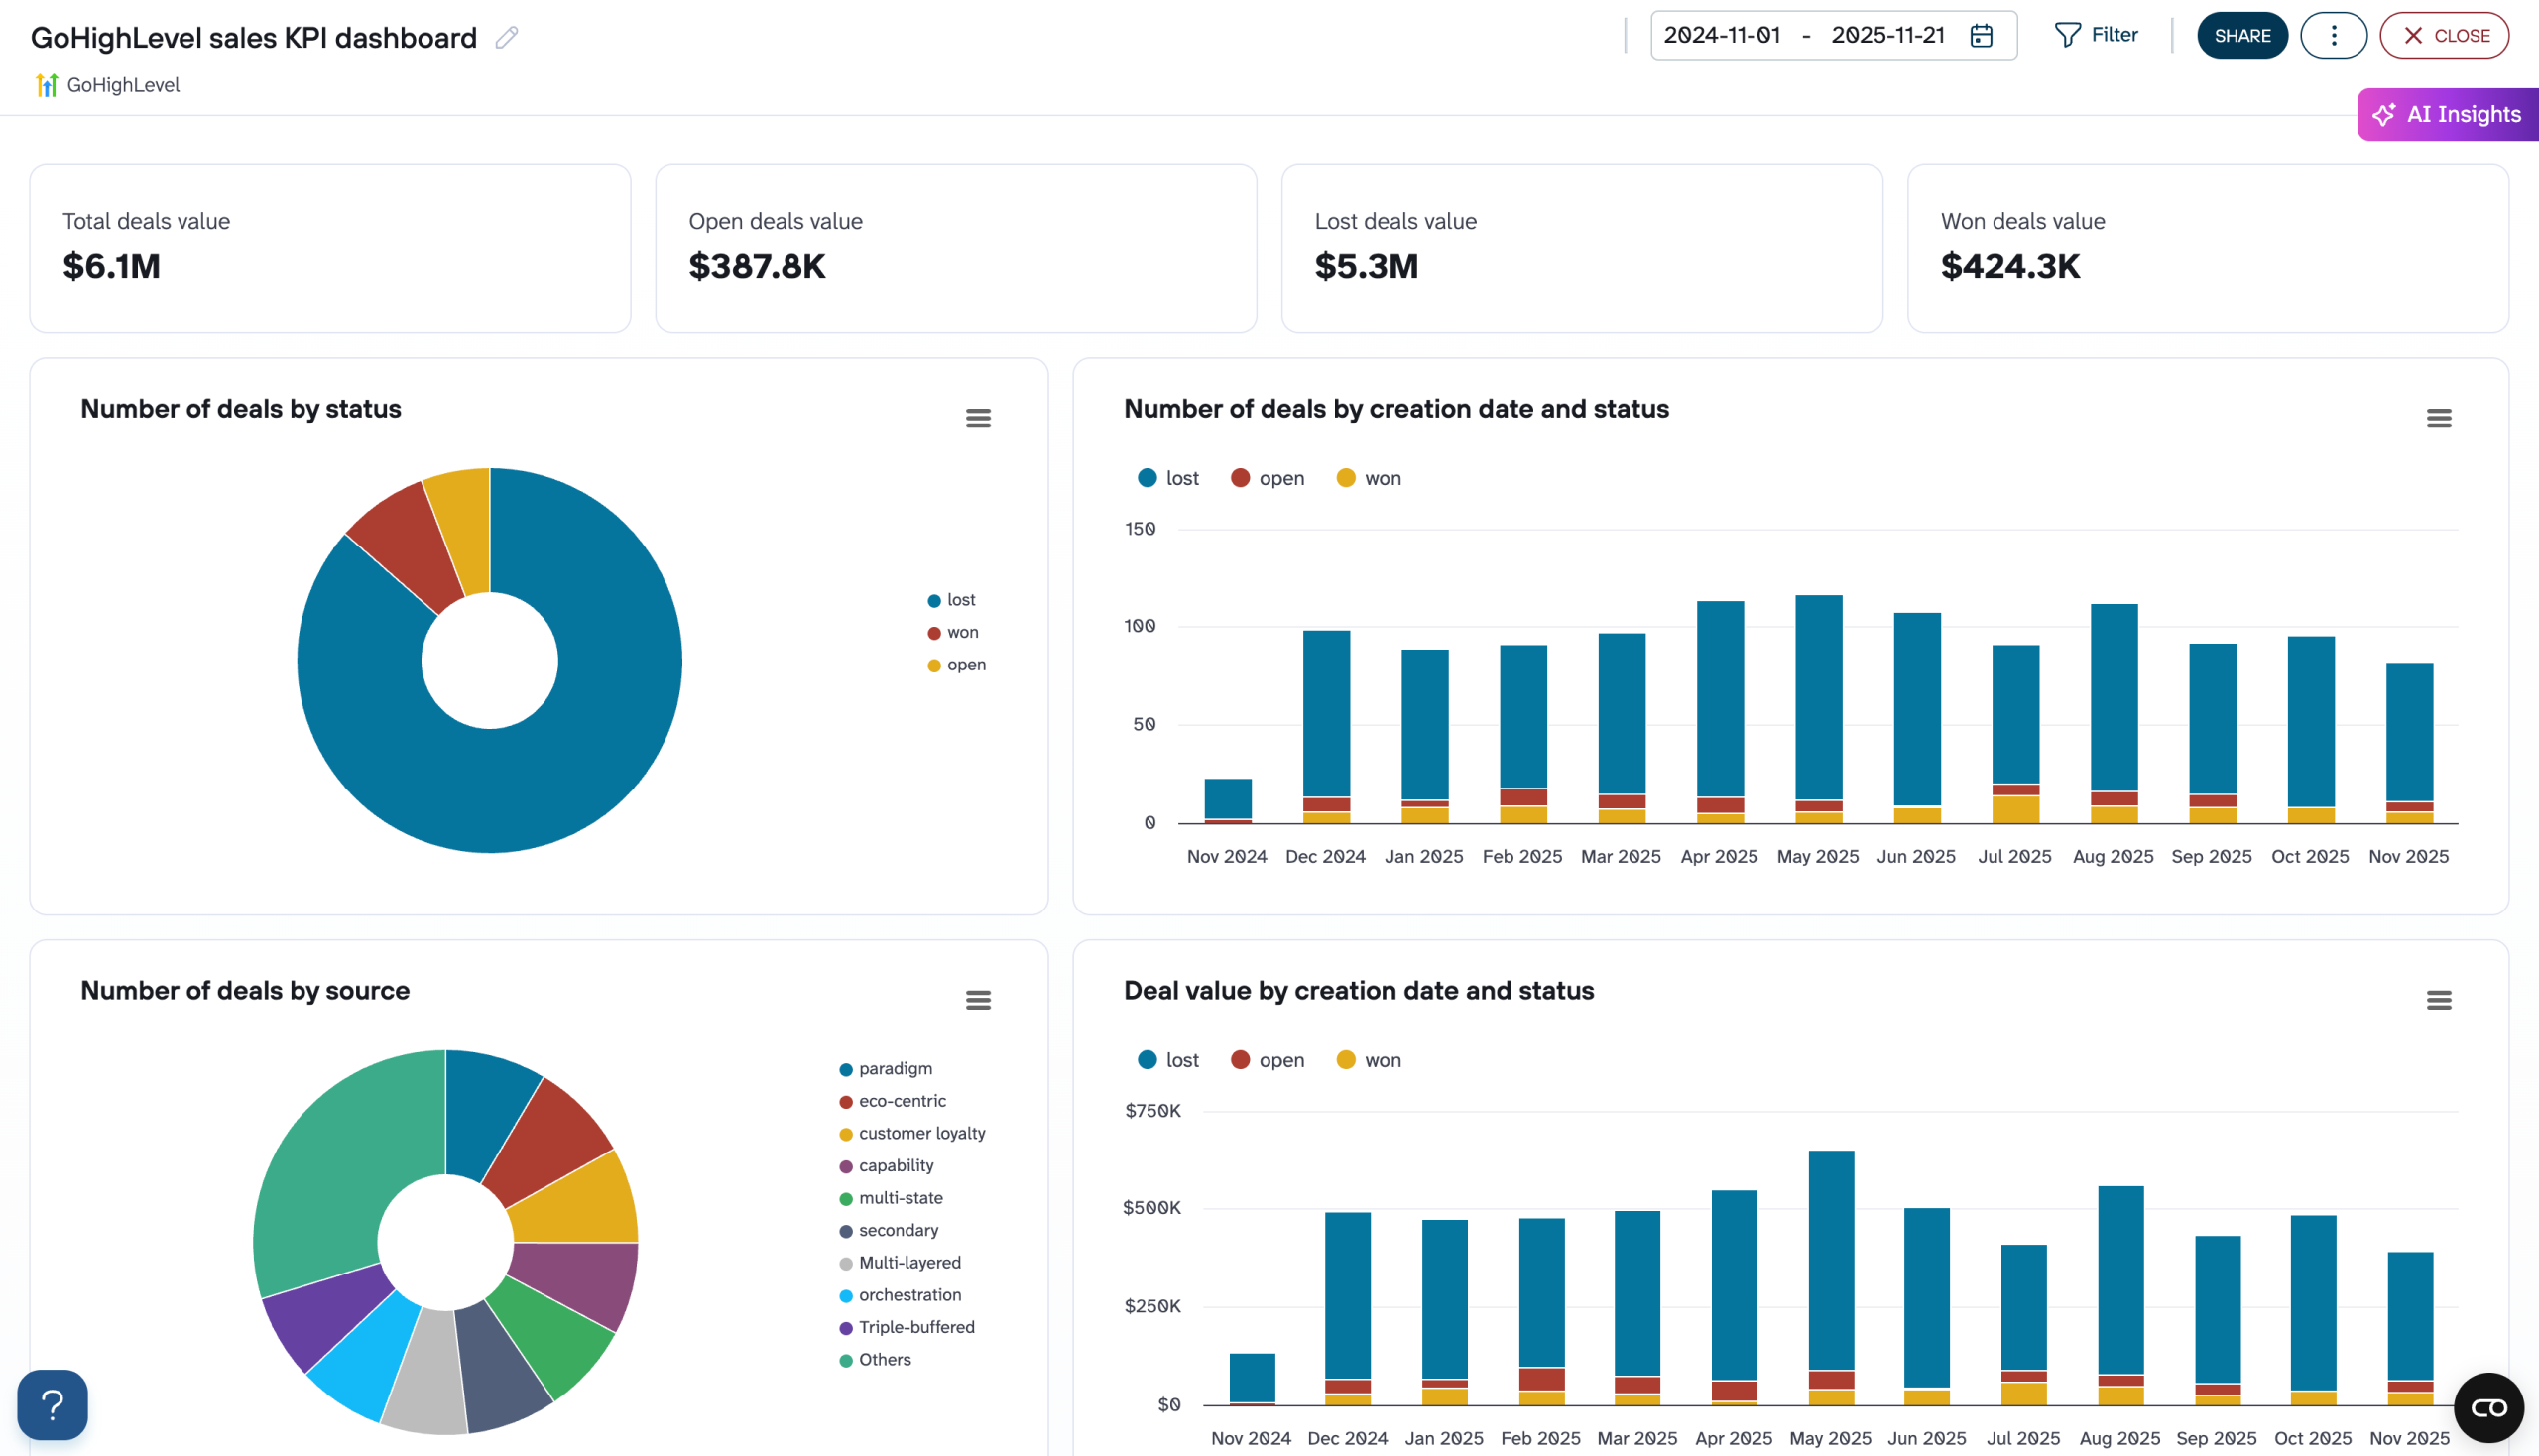
Financial performance tracking through revenue dashboards provides visibility into client monetization patterns, subscription health, and business growth metrics. The report monitors monthly recurring revenue trends, customer acquisition costs, churn rates, and average revenue per user across client accounts. For agencies managing SaaS clients or subscription-based businesses, this report connects marketing investments with actual revenue outcomes, demonstrating the tangible business impact of agency activities. The visualization includes plan distribution analysis showing which subscription tiers generate the most revenue, alongside retention metrics that indicate long-term customer value and the sustainability of growth patterns.
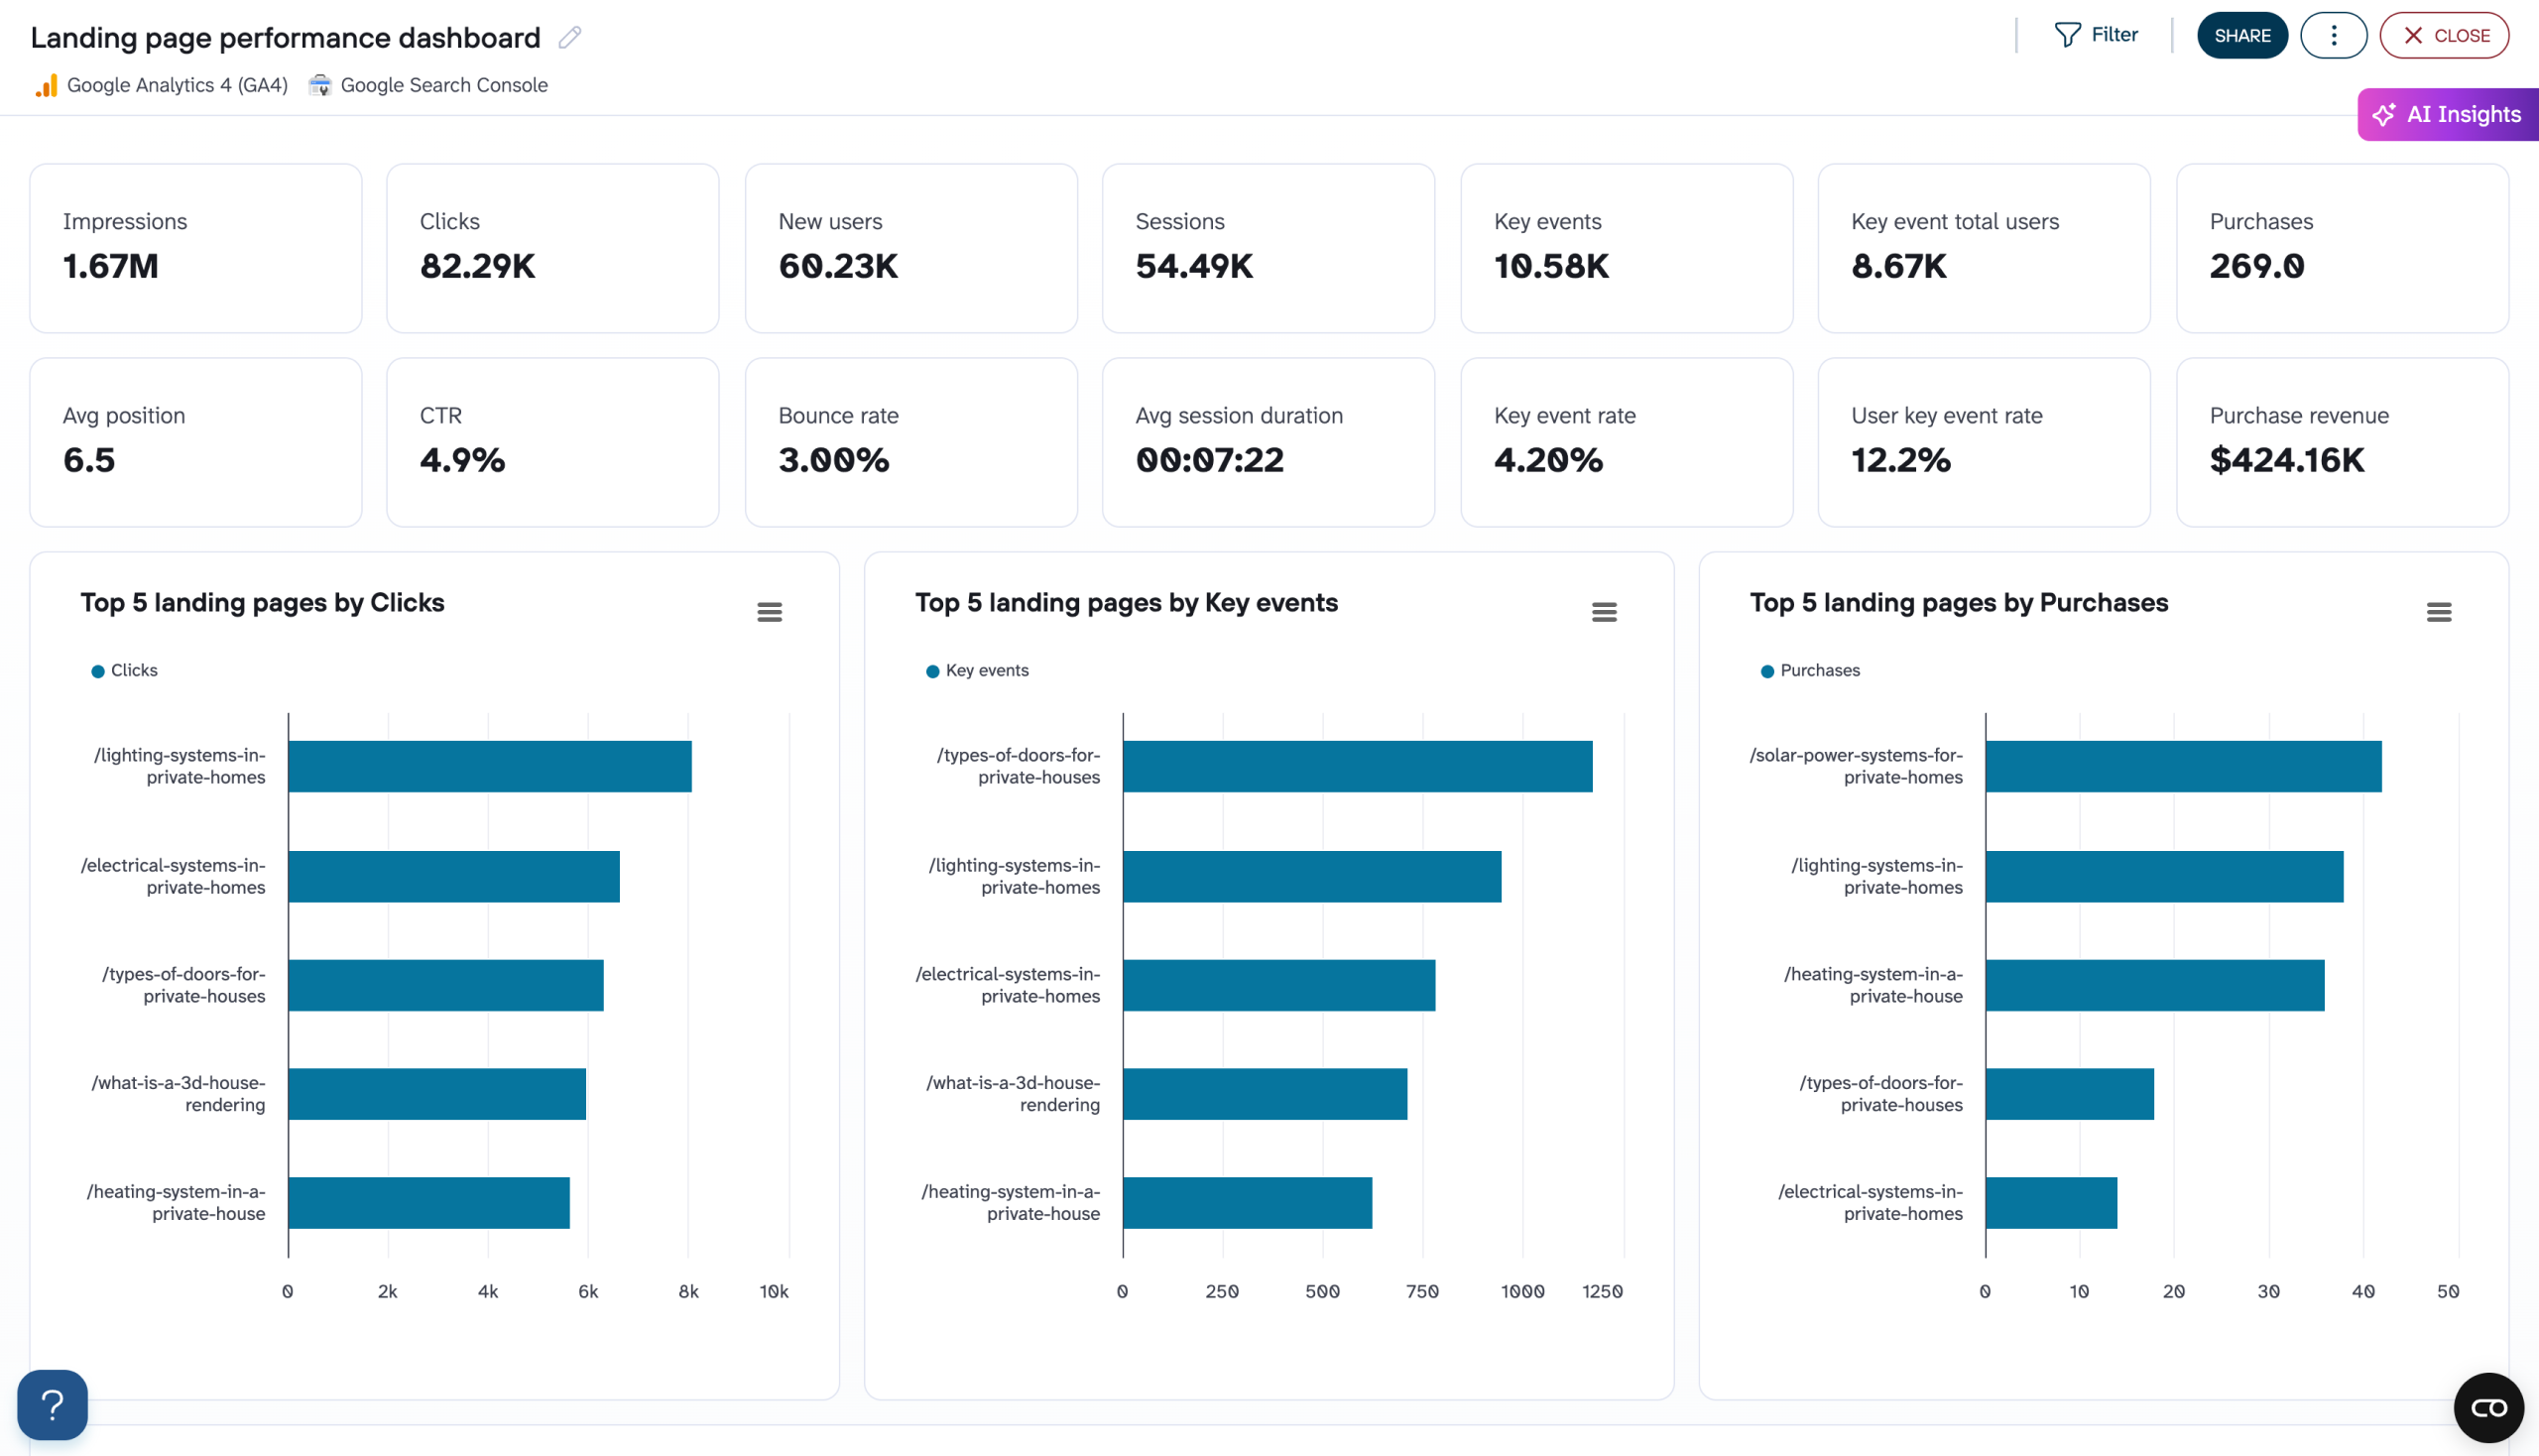
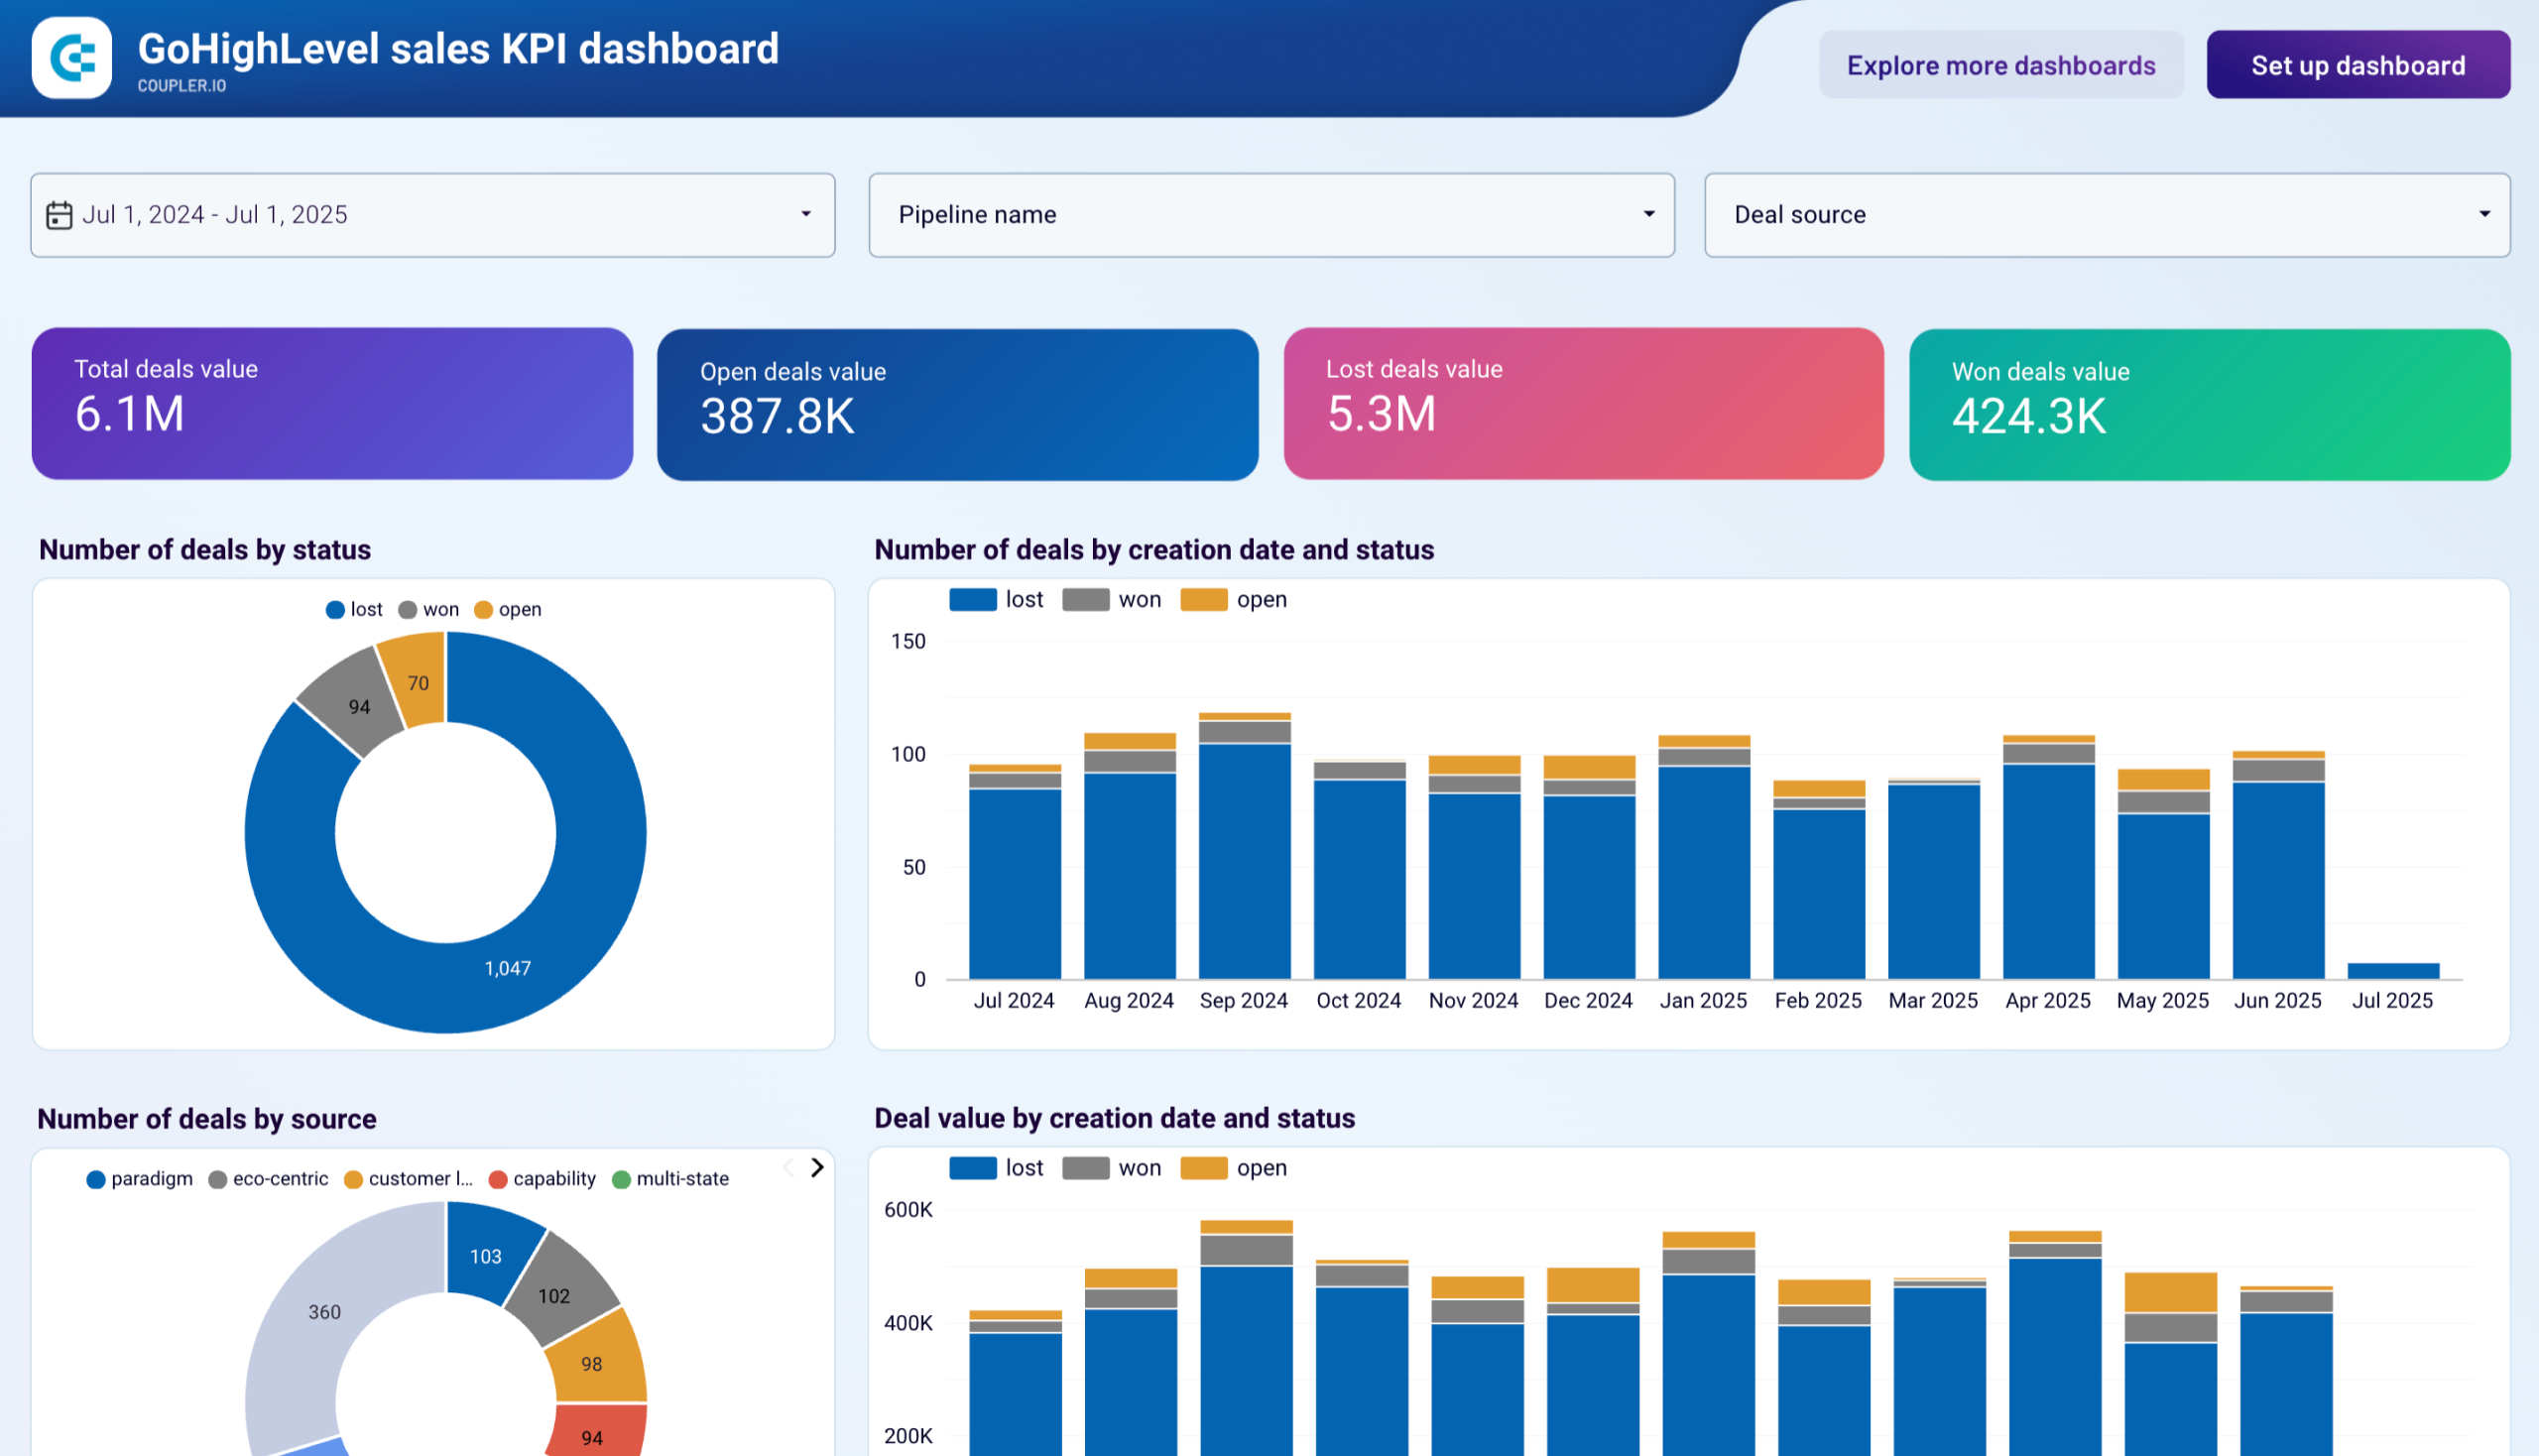
This report combines Google Search Console and Google Analytics 4 data to assess how individual landing pages perform from initial search impressions through completed conversions. It tracks search visibility metrics, including impressions, average position, and click-through rate,s alongside engagement indicators such as bounce rate, average session duration, and key event completions. The report highlights top-performing pages by clicks, conversions, and revenue while identifying underperforming assets that require optimization. For agencies producing content and managing SEO strategies, this dual-source perspective reveals whether search visibility issues stem from ranking problems or conversion barriers, directing optimization efforts toward the factors that will generate the greatest impact on client results.
What insights you can get with the agency reporting dashboard

Track monthly investment distribution across advertising platforms for your entire client roster to identify spending patterns and optimization opportunities. When platforms consistently receive disproportionate budget without corresponding results, agencies can initiate rebalancing conversations toward higher-performing channels. The temporal view exposes seasonal patterns in client spending, informing capacity planning decisions during peak periods.

Monitor combined website traffic and engagement metrics across all client properties in Google Analytics to understand portfolio health and identify cross-client performance trends. When multiple clients experience simultaneous traffic changes, agencies can quickly determine whether causes stem from algorithm updates, seasonal factors, or market shifts rather than client-specific issues. This aggregated perspective proves valuable during business development when demonstrating audience reach scale.

Understand how different pricing tiers contribute to client revenue and identify expansion opportunities. Compare plan performance over time to spot stagnation in higher-tier subscriptions or successful periods from specific initiatives. This insight becomes valuable when clients consider pricing changes, as historical plan distribution informs positioning decisions and guides upselling recommendations.
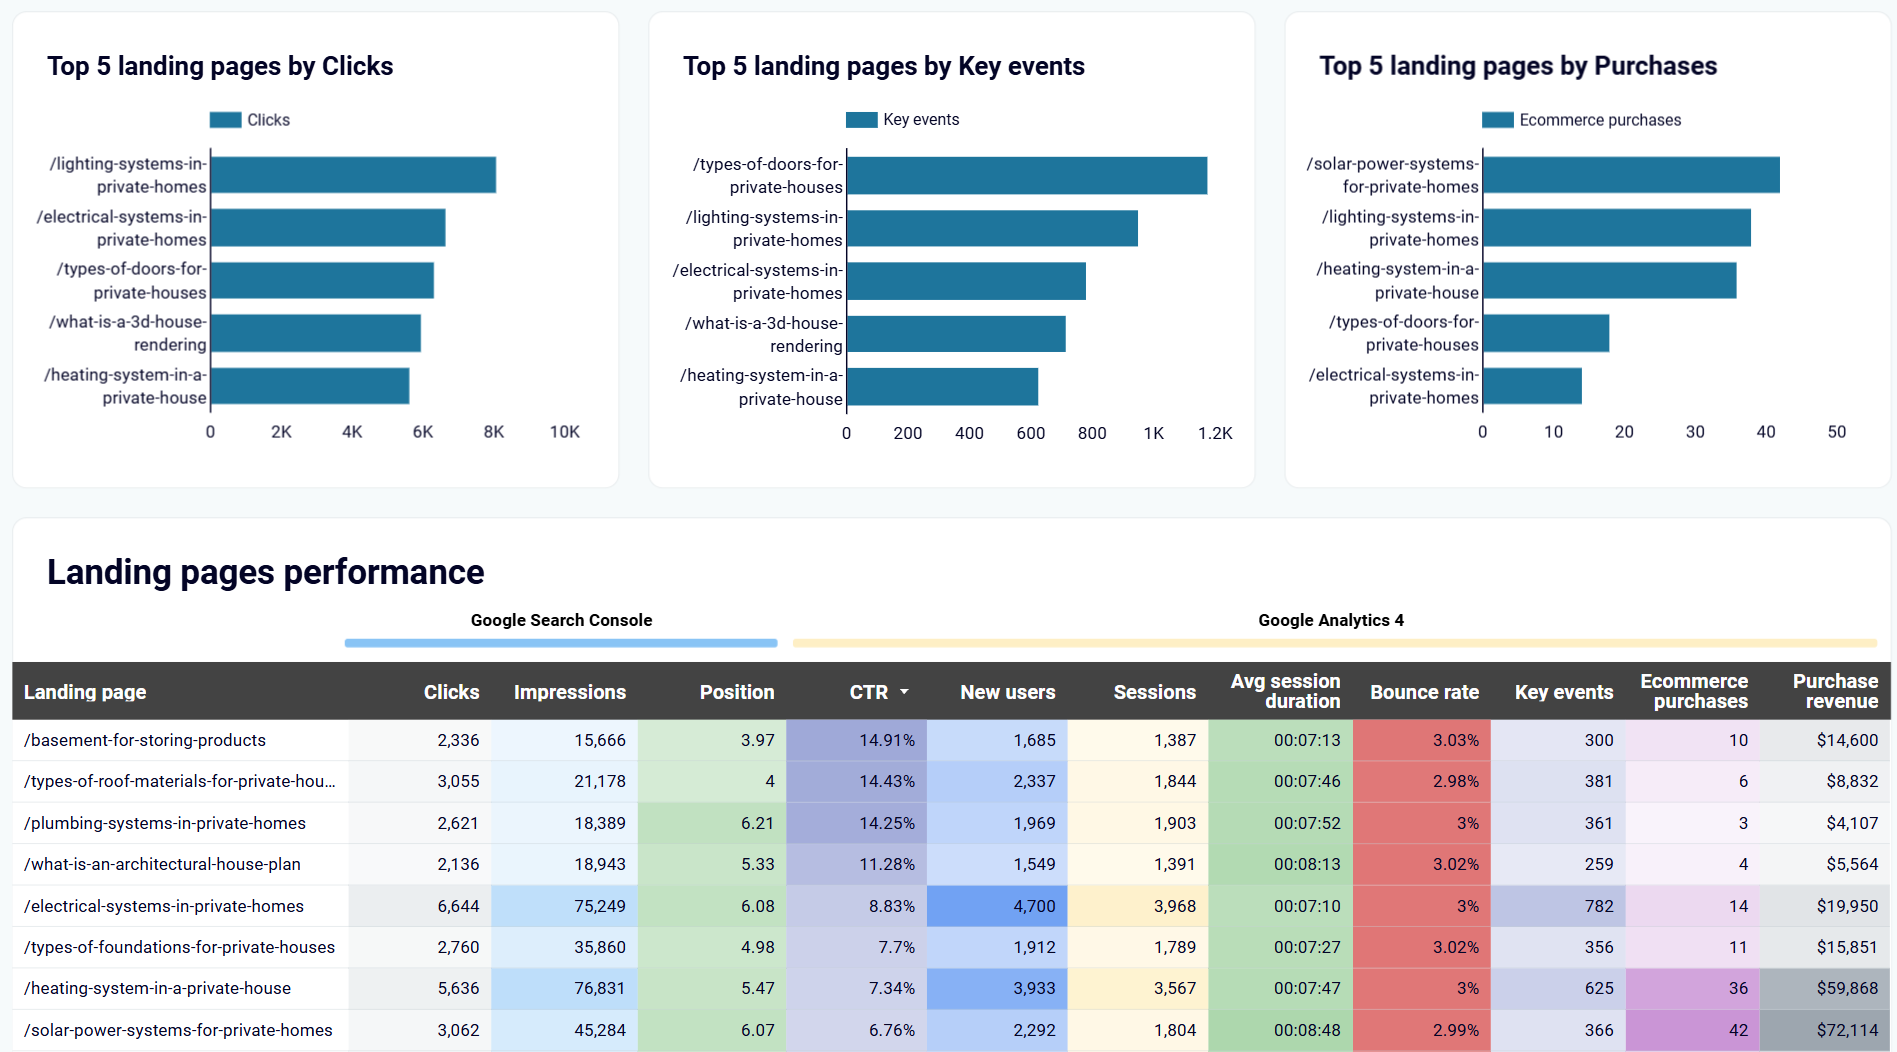
Evaluate which landing pages drive valuable traffic by combining search visibility with conversion data. Pages with high impressions but low clicks indicate meta description optimization opportunities, while strong traffic with weak conversions signals user experience problems. This prioritized view guides content production toward assets delivering the greatest measurable impact on results.
How to create an agency dashboard?

Metrics you can track with an agency dashboard template
Total advertising expenditure across all platforms and client accounts during the selected period. This metric aggregates spending from Facebook Ads, Google Ads, LinkedIn Ads, and other connected platforms, providing agencies with immediate visibility into budget utilization. Monitoring spend patterns helps identify budget overruns, underutilization of allocated funds, or unexpected cost increases that require investigation. The metric proves particularly valuable during month-end reviews when reconciling actual spending against client budgets and preparing invoices for media buying services.
The number of times advertisements appeared on users' screens across all advertising platforms. Impressions indicate the reach of advertising campaigns and serve as the top-of-funnel metric for evaluating campaign visibility. Tracking impressions helps agencies assess whether campaigns are achieving adequate exposure to target audiences and whether budget allocations are generating sufficient visibility. Significant drops in impressions may signal budget constraints, bid strategy issues, or increased competition requiring tactical adjustments to maintain campaign presence.
Total number of user interactions with advertisements across all platforms. Clicks measure the effectiveness of ad creative, targeting, and messaging in generating interest among exposed audiences. This metric serves as a bridge between visibility and website traffic, indicating how well campaigns move users from ad platforms to client websites. Analyzing click patterns helps agencies evaluate creative performance, identify high-performing audience segments, and optimize campaigns toward messages that resonate most effectively with target demographics.
The percentage of impressions that resulted in clicks, calculated as clicks divided by impressions. CTR indicates how compelling audiences find ad creative and messaging relative to the number of exposures. Higher CTRs suggest effective targeting and engaging creative, while declining CTRs signal creative fatigue or audience saturation requiring refreshed messaging. For agencies, monitoring CTR across client campaigns helps identify which creative approaches generate the strongest engagement and which campaigns need optimization to improve efficiency before exhausting budget allocations.
The average amount paid for each click on advertisements across platforms. CPC reflects competitive pressure for target audiences and the effectiveness of bidding strategies in securing cost-efficient traffic. Rising CPCs indicate increased competition or declining ad relevance scores, while decreasing CPCs suggest improved efficiency or reduced competitive pressure. Agencies use CPC trends to optimize bidding strategies, evaluate platform cost-effectiveness, and demonstrate value by securing traffic at costs below client acquisition targets or industry benchmarks.
The average cost to deliver one thousand advertisement impressions. CPM indicates the efficiency of reaching target audiences with advertising messages and varies significantly across platforms, targeting parameters, and competitive landscapes. Monitoring CPM helps agencies assess whether awareness campaigns are delivering cost-effective reach and whether budget allocations align with visibility goals. Sudden CPM increases may signal seasonality effects, increased competition, or targeting adjustments that require strategic review to maintain campaign efficiency.
The combined number of unique visitors across all client websites during the selected period. This metric aggregates traffic from all sources including organic search, paid advertising, direct visits, and referrals, providing a comprehensive view of audience reach. For agencies managing multiple client properties, total users serves as a portfolio-level indicator of aggregate traffic generation and the overall impact of marketing activities across the client base.
The number of first-time visitors to client websites during the selected period. New users indicate the effectiveness of acquisition campaigns in reaching audiences beyond existing visitors and expanding market awareness. Tracking new user acquisition helps agencies assess whether marketing efforts are penetrating new market segments or primarily re-engaging known audiences. Declining new user rates may signal saturation of current targeting parameters or the need for audience expansion strategies to maintain growth momentum.
The total number of individual visits to client websites, regardless of whether visitors are new or returning. Sessions provide a more granular view of engagement than unique users, as single users may initiate multiple sessions. High session counts relative to unique visitors suggest strong return visit patterns and effective retention of audience interest. Agencies monitor session trends to evaluate whether content strategies and remarketing efforts successfully re-engage audiences beyond initial visits.
The predictable revenue generated from active subscriptions on a monthly basis. MRR serves as the primary financial health indicator for subscription-based businesses, providing visibility into revenue stability and growth patterns independent of one-time purchases or variable income sources. For agencies managing SaaS clients, MRR tracking connects marketing activities with tangible revenue outcomes, demonstrating how acquisition campaigns, retention initiatives, and expansion strategies impact sustainable business growth. Changes in MRR signal the combined effects of new customer acquisition, existing customer churn, and pricing changes across the customer base.
The average monthly revenue generated per active customer, calculated as monthly recurring revenue divided by total active customers. ARPU indicates whether revenue growth stems from acquiring more customers or increasing the value of existing relationships through upselling, cross-selling, or price optimization. Rising ARPU suggests successful expansion strategies and increasing customer value, while declining ARPU indicates downgrade patterns or acquisition of lower-tier customers. Agencies use ARPU trends to guide recommendations about customer segmentation, pricing strategy, and the balance between acquisition and expansion investments.