WooCommerce dashboard examples and reporting templates
Transform your e-commerce data into actionable insights with automated WooCommerce reporting dashboards. Connect your store, Google Analytics, and advertising platforms to track sales performance, monitor customer behavior, and optimize marketing spend—all in one centralized view powered by Coupler.io.
WooCommerce dashboard examples for every need


 +4
+4
about your case. It doesn't cost you a penny 😉
Choose your white label WooCommerce dashboard to kick off
What is a WooCommerce dashboard?
Our WooCommerce dashboard templates serve store owners, marketing managers, and e-commerce analysts who need to understand the complete customer journey—from initial ad impression through website visit to final purchase. Rather than switching between multiple platforms to gather performance data, you access sales trends, conversion rates, customer acquisition costs, and traffic sources in one location. This consolidated view enables faster decisions about budget allocation, product strategy, and conversion optimization.

What reports should be included in WooCommerce dashboards?
Effective WooCommerce dashboards should integrate multiple data perspectives to provide complete visibility into your e-commerce performance. Drawing from real-world implementations, these four report categories form the foundation of meaningful analysis.
The marketing funnel report combines advertising spend from multiple platforms with website traffic and sales conversion data to reveal how marketing investments drive actual orders. This report tracks the complete acquisition journey, from ad impressions and clicks through website visitors to new customers, with calculated metrics including ROI, cost per order, and conversion rates at each stage. Weekly performance breakdowns enable you to identify optimal periods for scaling advertising spend and pinpoint where potential customers exit the funnel.
The traffic source report breaks down visitor behavior by channel—organic search, paid advertising, direct visits, email campaigns, and social media—revealing which sources drive engaged users versus just volume. Beyond simple visit counts, this report displays session engagement rates, average session duration, and conversion performance per source. You can identify channels that generate high traffic but poor conversions, signaling optimization opportunities in landing pages or audience targeting.
The order analysis report visualizes purchasing patterns by customer type, separating transactions from registered customers versus guest checkouts over time. This temporal view reveals whether business growth stems from customer retention or depends heavily on one-time buyers, informing loyalty program investments and registration optimization efforts. In the WooCommerce order management dashboard, you can track order value trends, completion times, and order status distribution, highlighting fulfillment bottlenecks or unusual refund patterns that require investigation.
The geographic report goes beyond simple revenue mapping to include engagement metrics like session-to-order conversion rates, average session duration, and sales per session for each country. This multidimensional view in the WooCommerce customer dashboard identifies high-value markets where visitors convert efficiently versus regions with engagement or conversion challenges despite significant traffic. You can spot countries where advertising spend generates visits but poor sales outcomes, suggesting pricing issues, shipping costs, or localization gaps.
What insights you can get with the WooCommerce reporting dashboard
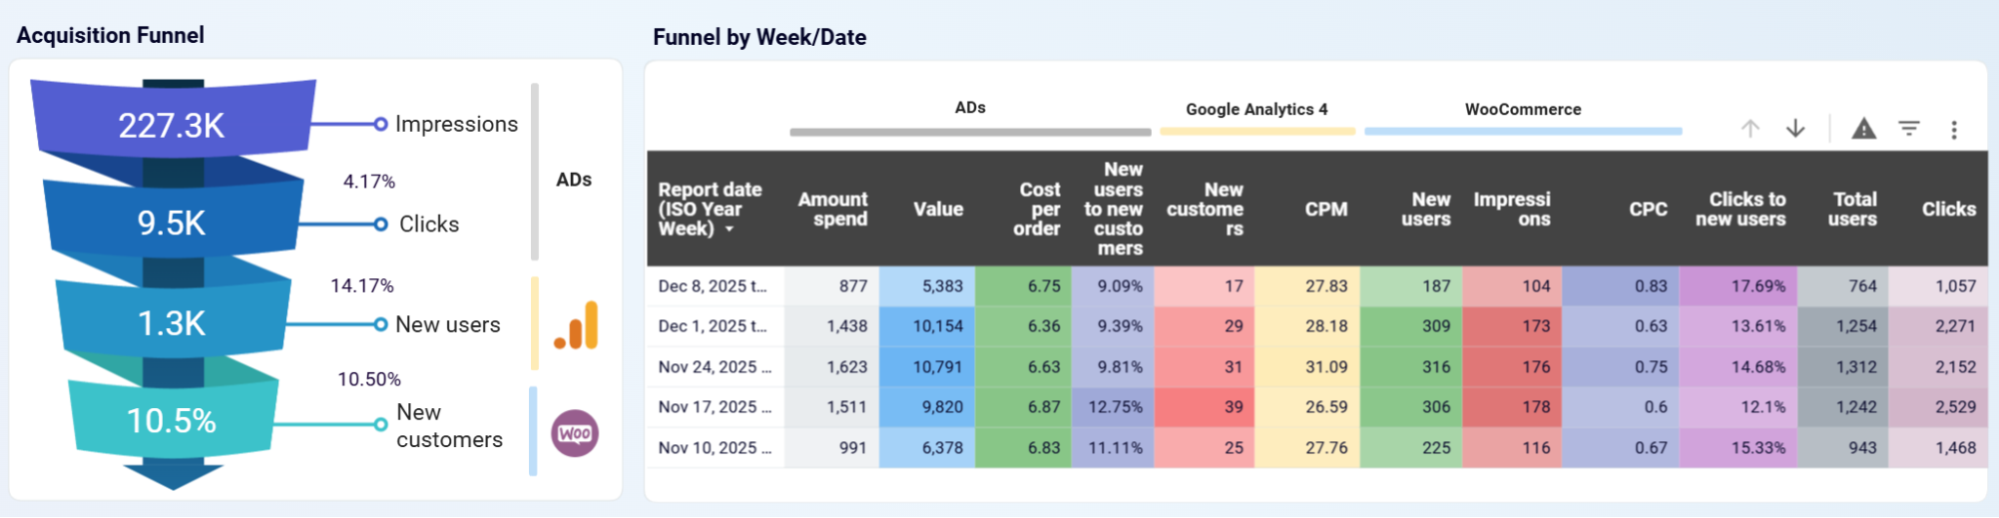
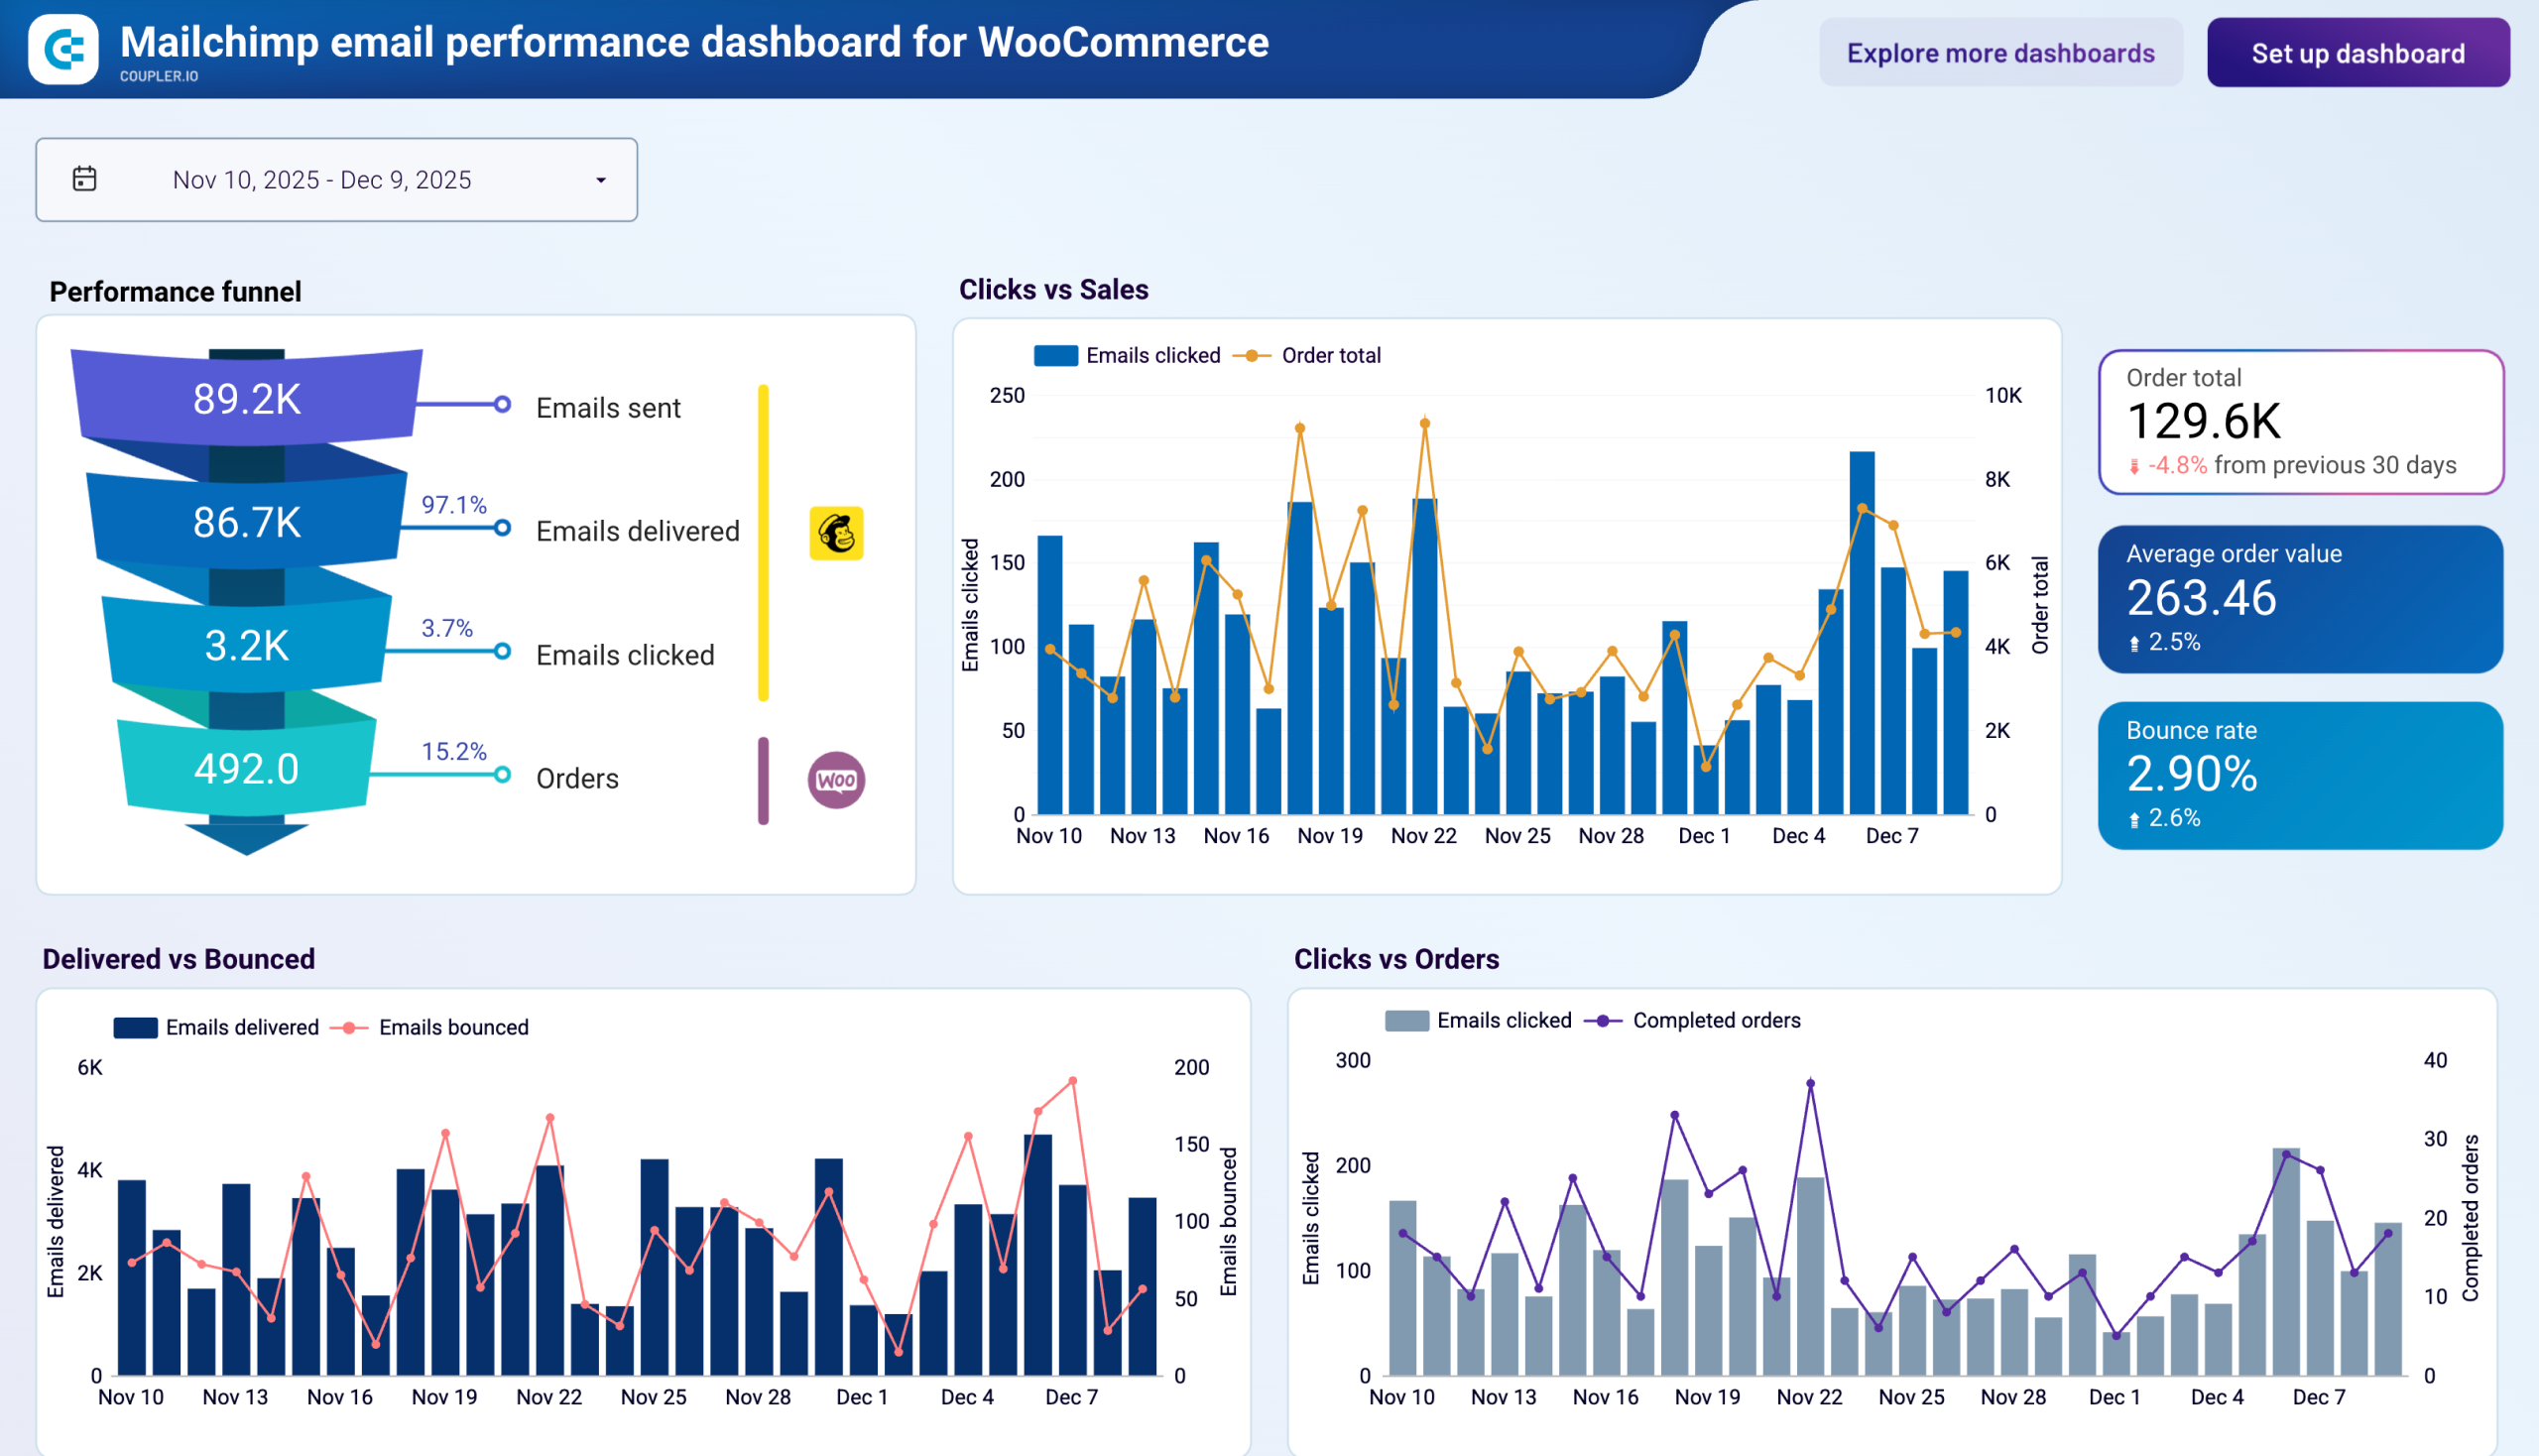
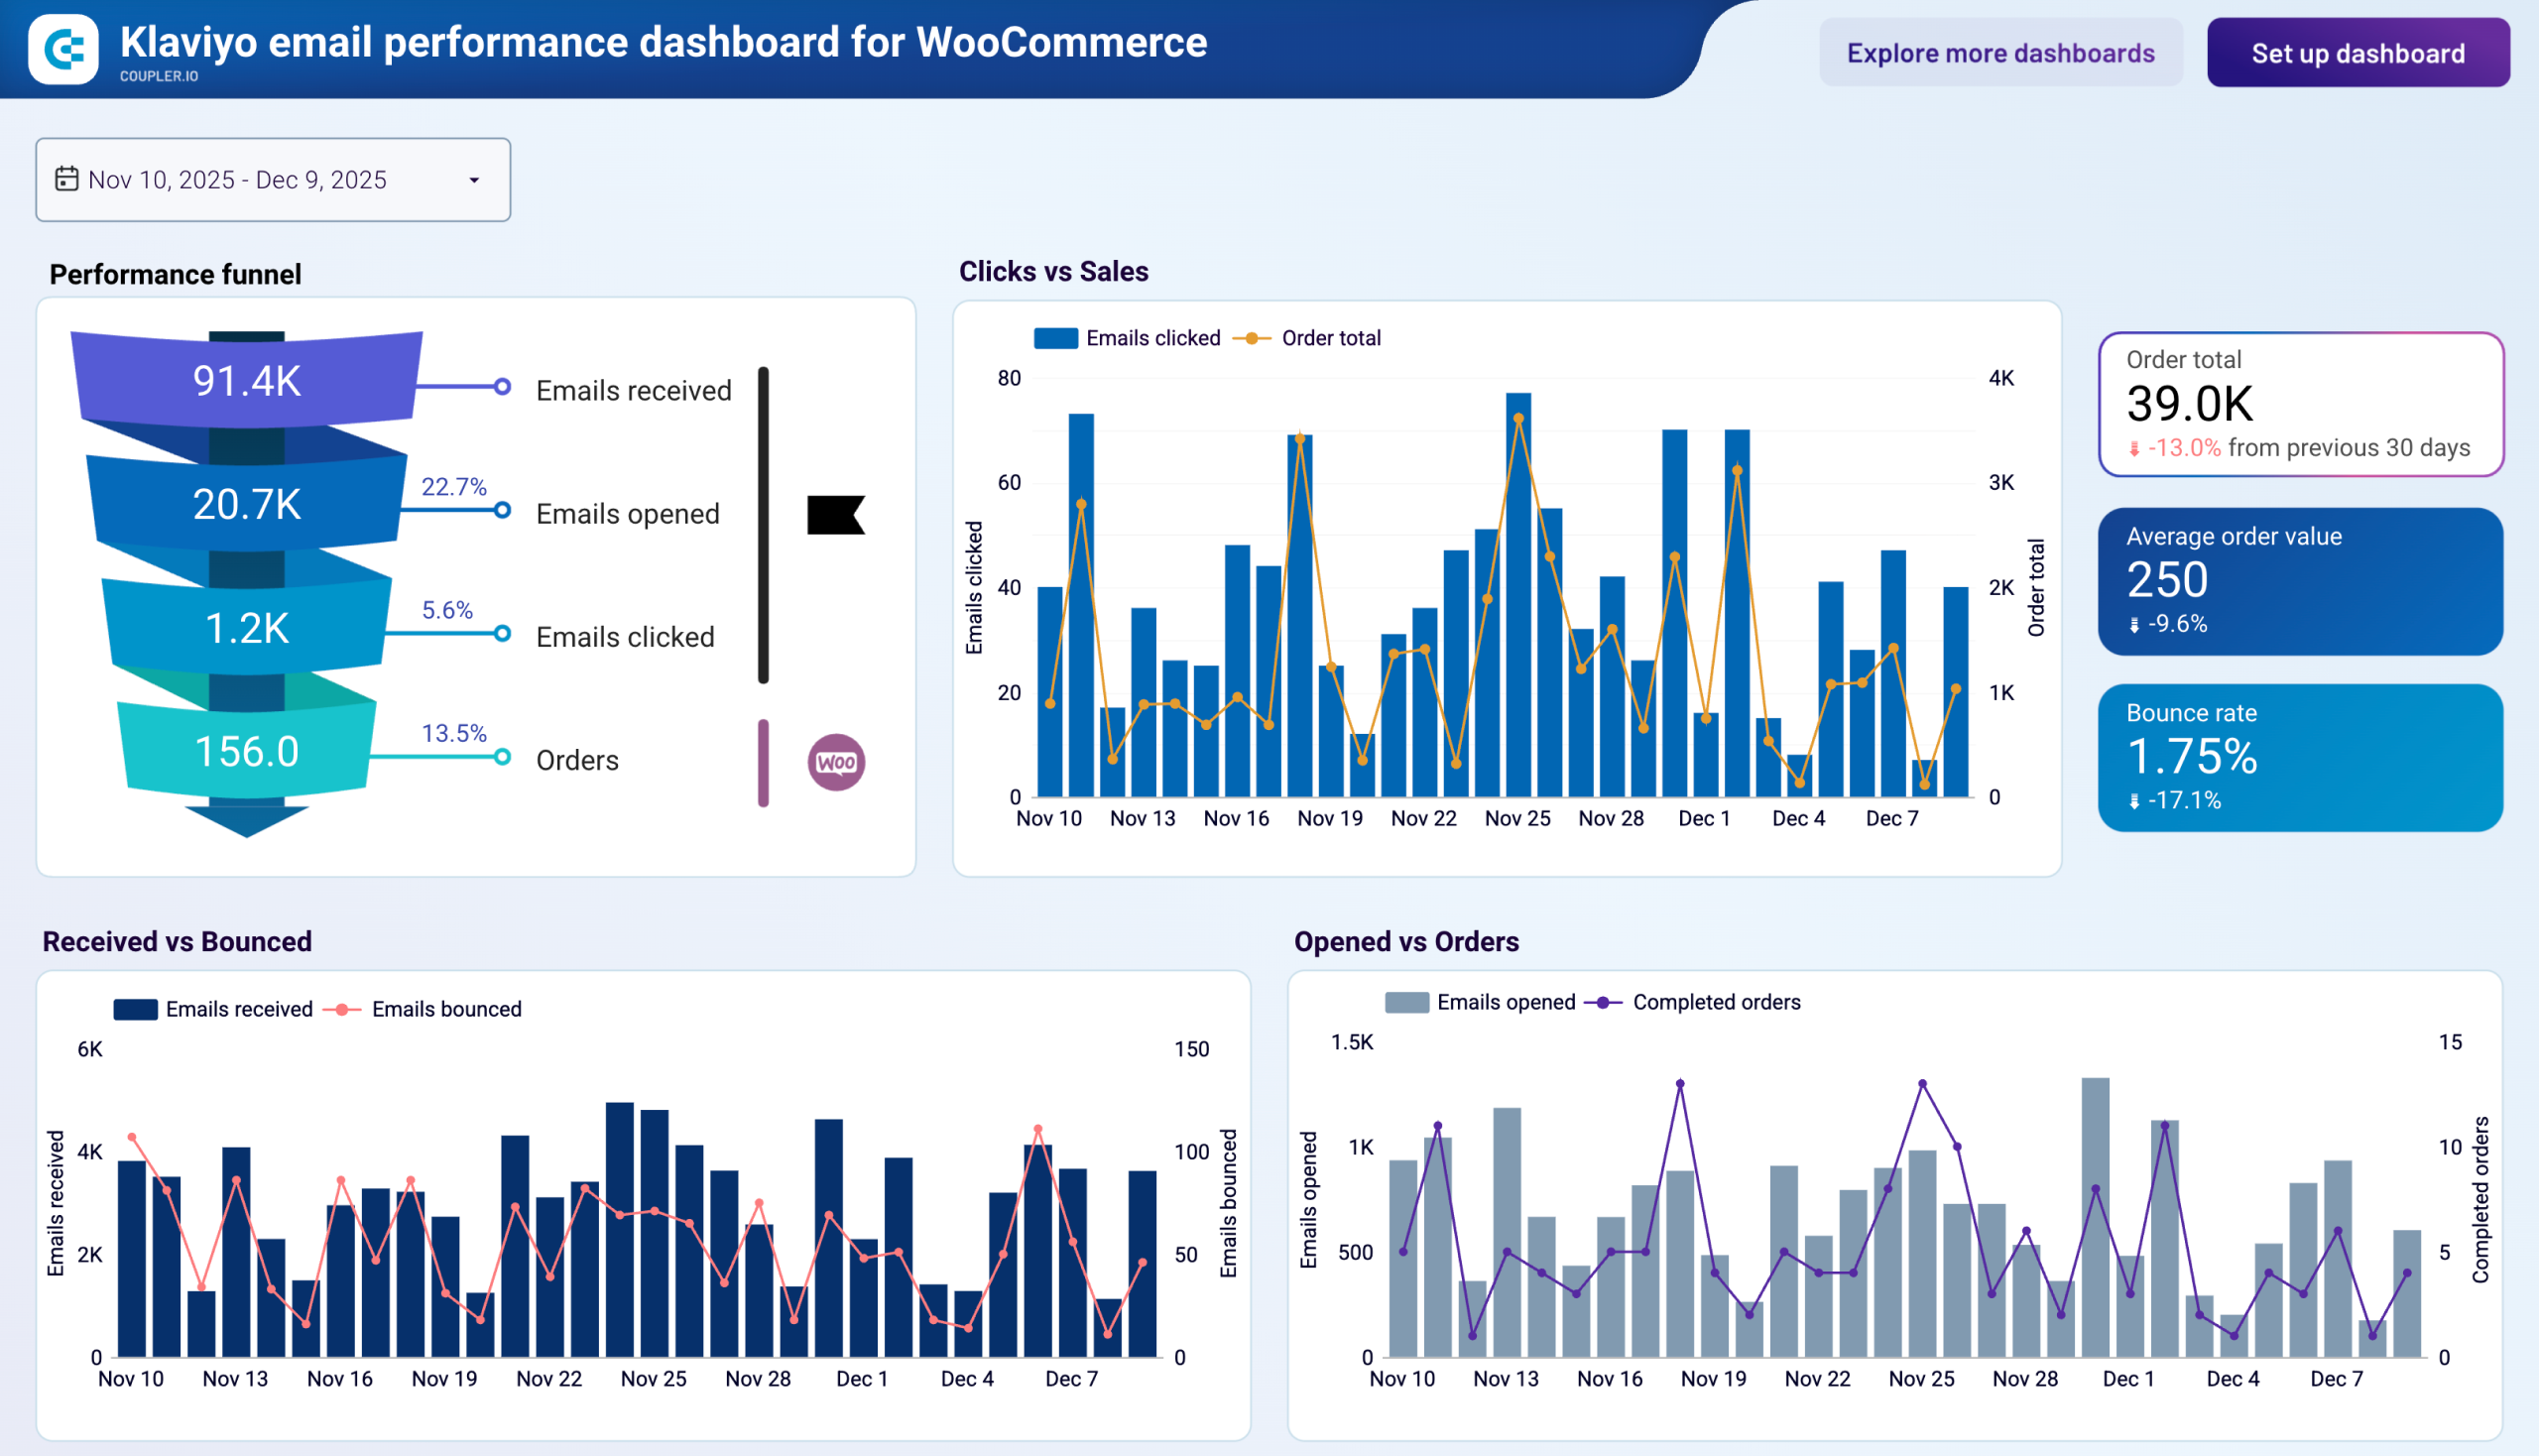
The acquisition funnel visualizes your complete customer journey from advertising impressions through clicks, website users, and ultimately to new customers, displaying conversion rates at each critical transition point. The weekly breakdown table consolidates advertising spend, impressions, clicks, and CTR from all connected platforms alongside Google Analytics 4 user data and WooCommerce sales, orders, and new customer counts. This integrated view in the WooCommerce sales dashboard enables you to get week-over-week performance comparisons that reveal optimal periods for increasing ad budgets and identify bottlenecks where prospects abandon the purchase path.
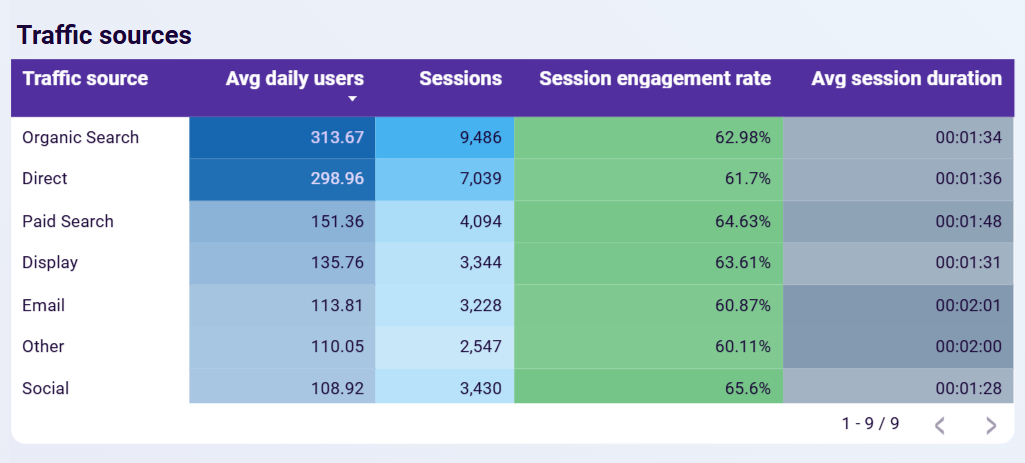
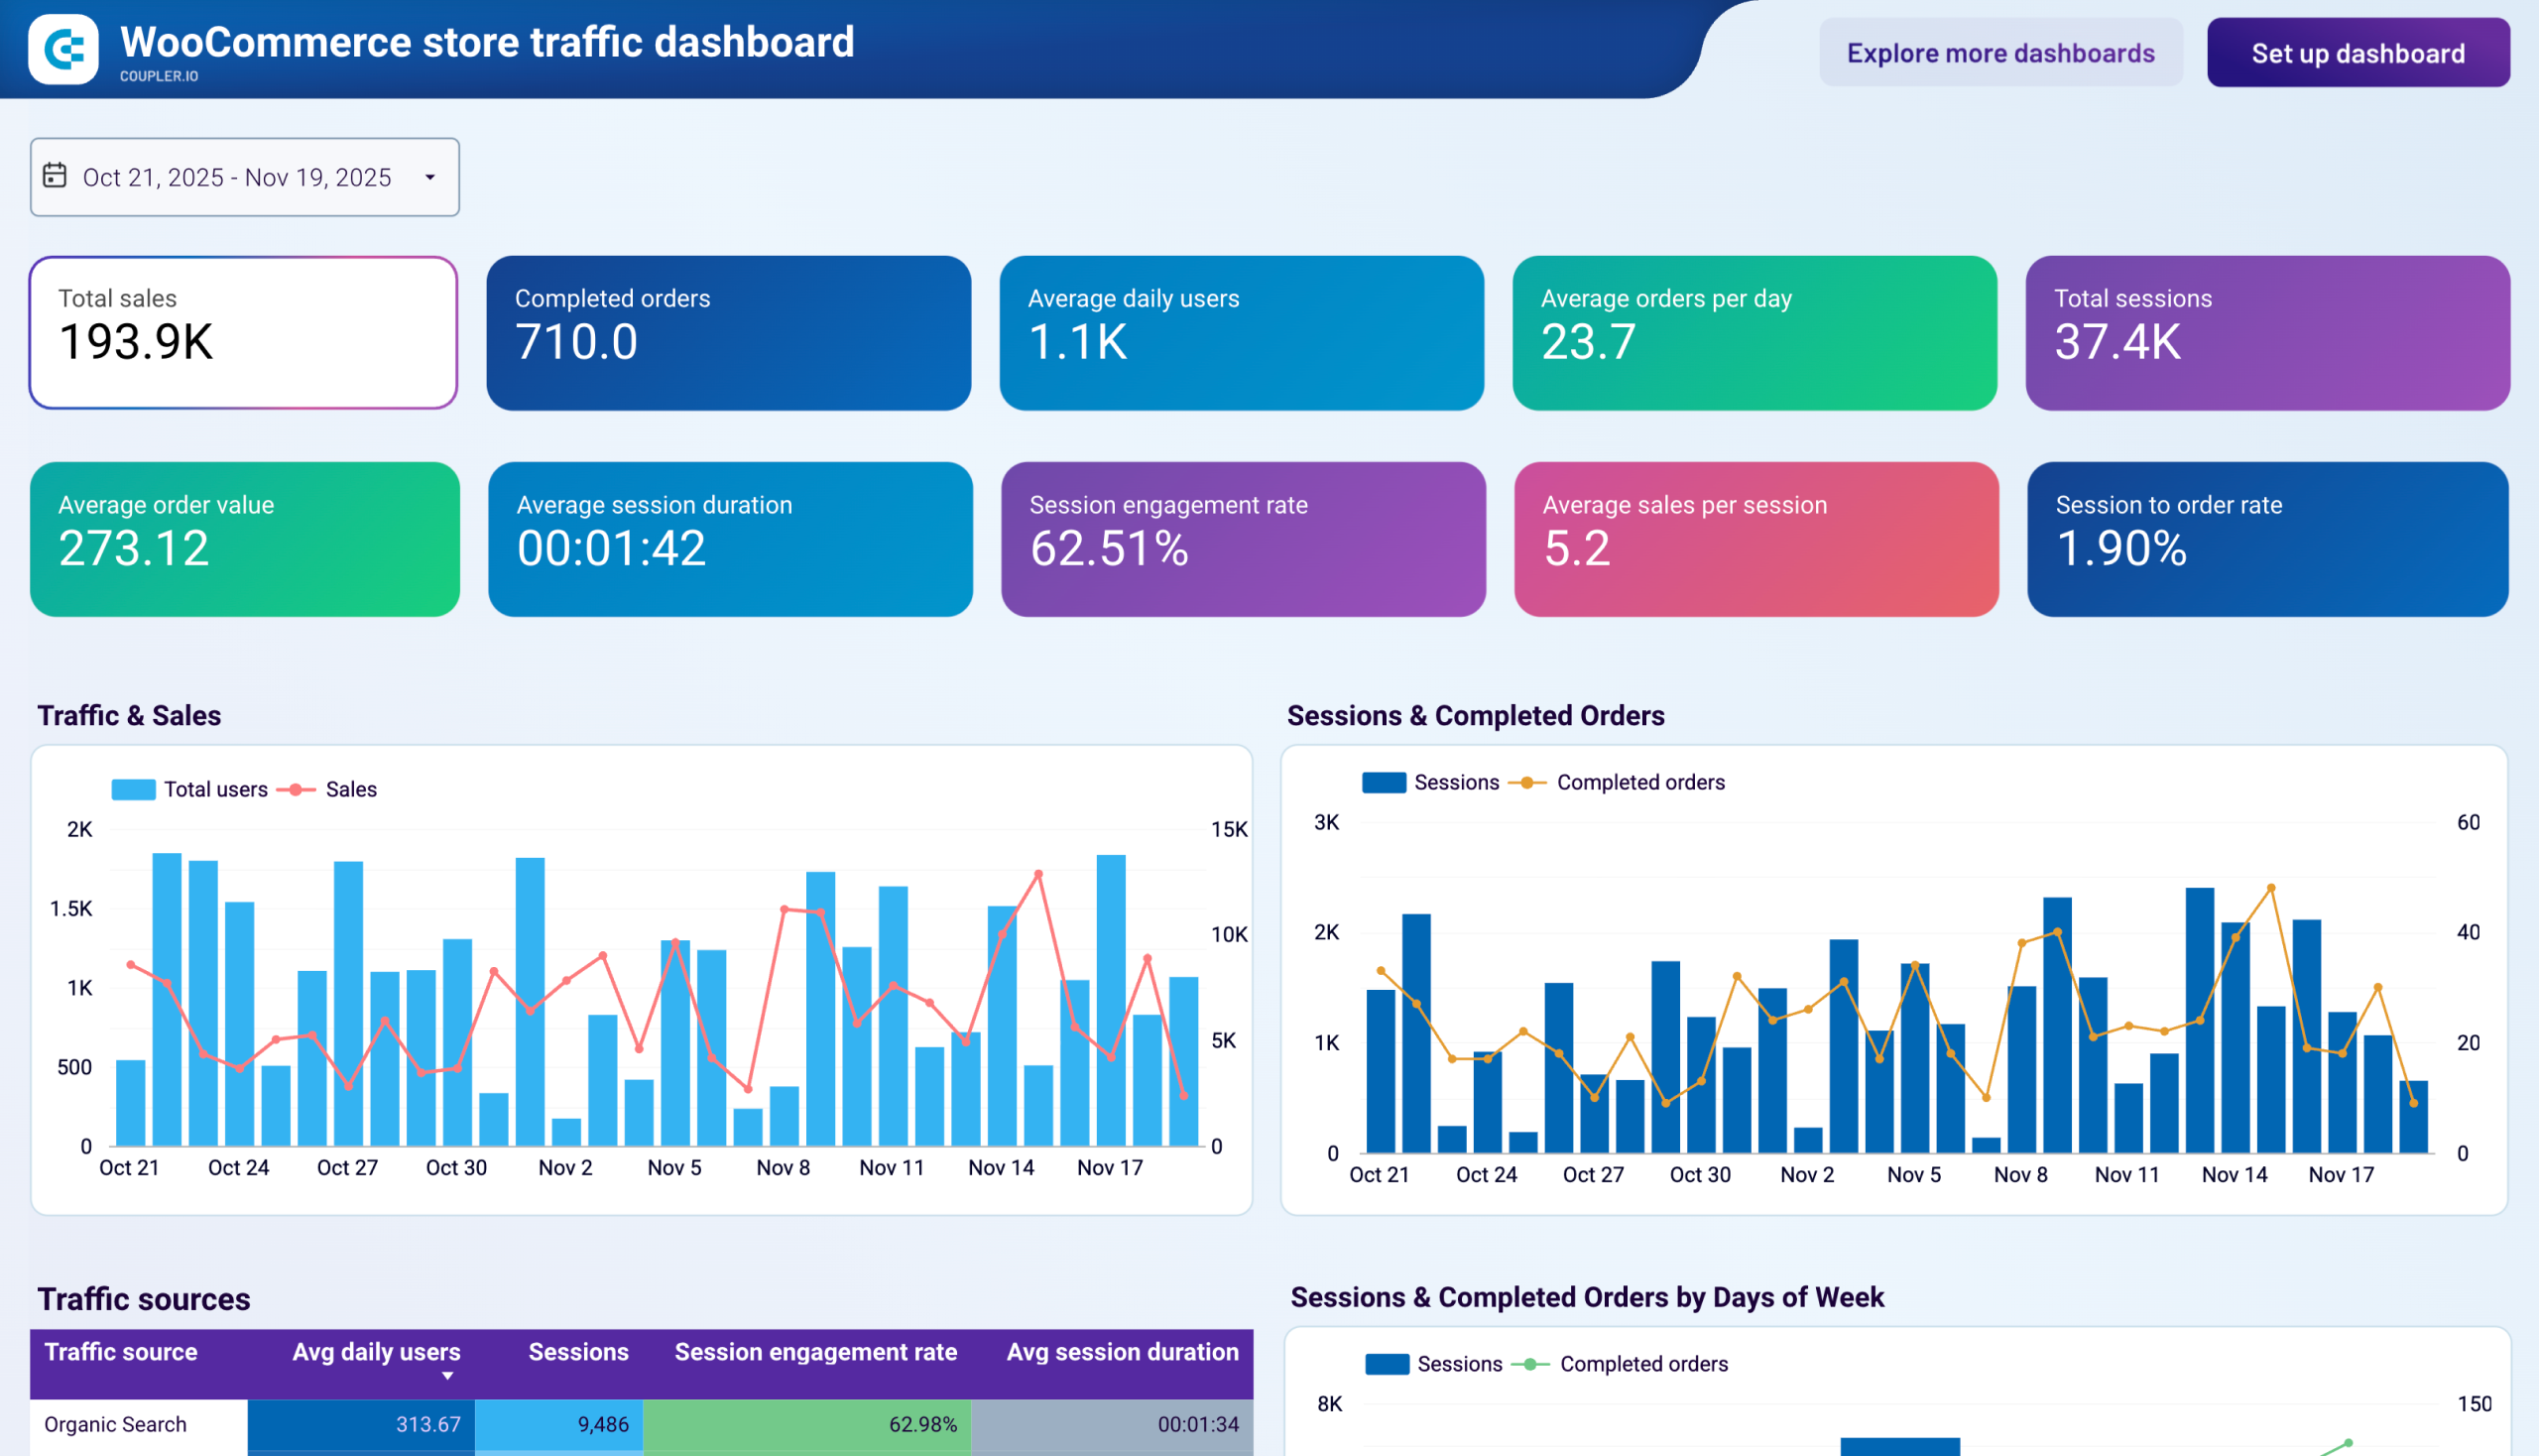
The traffic source breakdown reveals which marketing channels—organic search, direct traffic, paid search, display advertising, email campaigns, social media, and referrals—drive the most visitors alongside engagement quality metrics for each source. You see average daily users, total sessions, session engagement rates, and average session duration per channel, distinguishing between sources that generate high-volume but disengaged traffic versus those bringing smaller audiences with strong purchase intent. This table highlights efficient sources deserving increased investment based on actual engagement and sales outcomes rather than vanity metrics like total clicks.
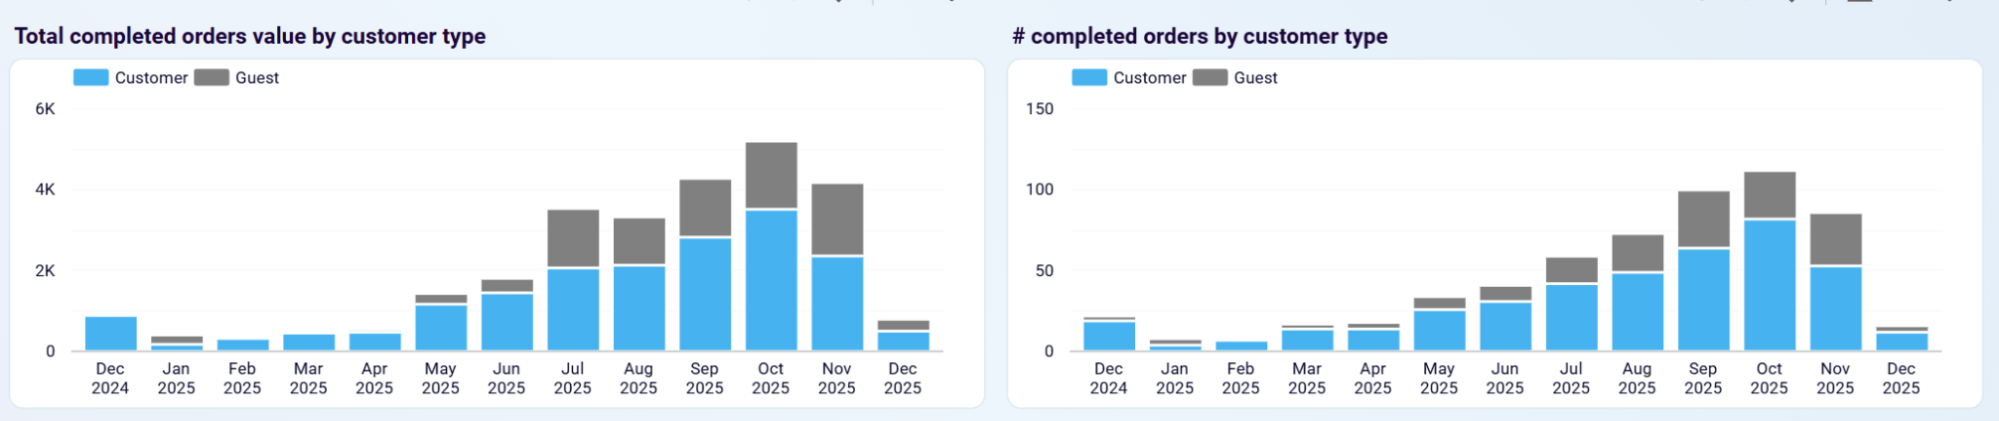
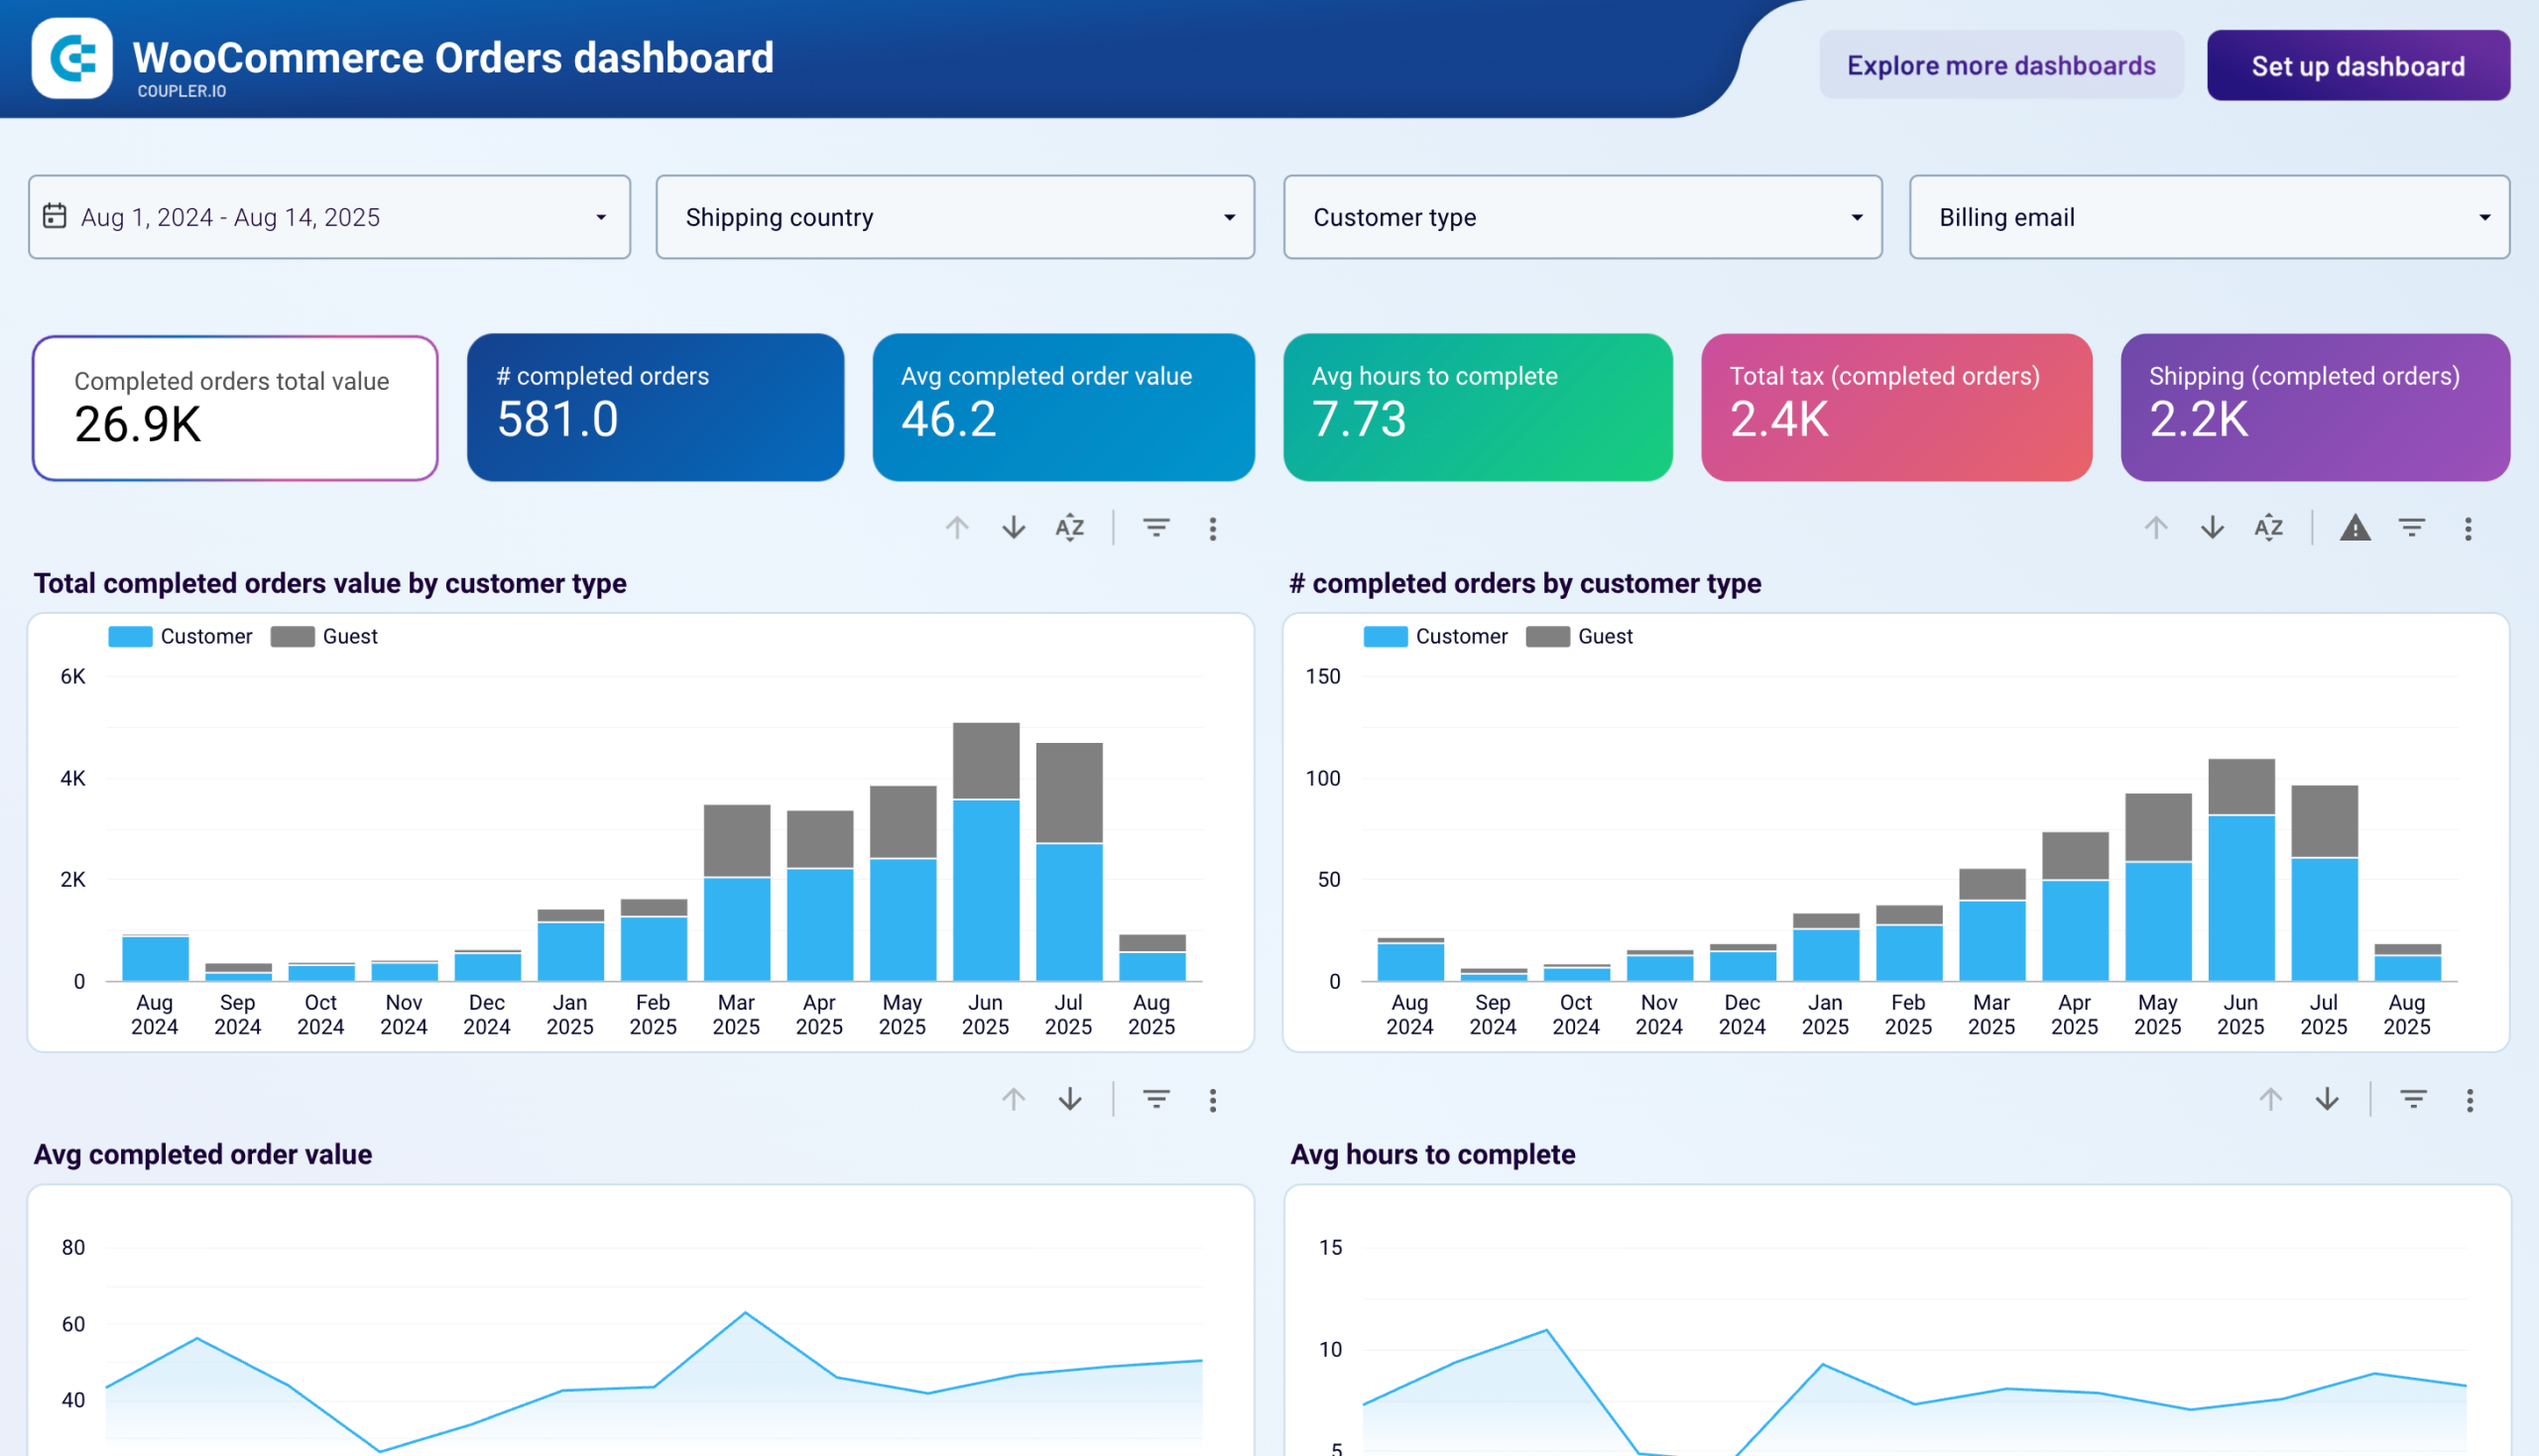
Stacked visualizations display completed order values and volumes separated between registered customers and guest users across weekly or monthly timeframes, revealing the balance between customer acquisition and retention in your business model. Periods where guest checkout dominates signal opportunities to optimize account registration benefits or streamline the checkout experience, while declining repeat customer percentages indicate retention challenges requiring loyalty program adjustments. This longitudinal customer type analysis shows whether revenue growth comes from expanding your customer base or increasing purchase frequency among existing buyers.
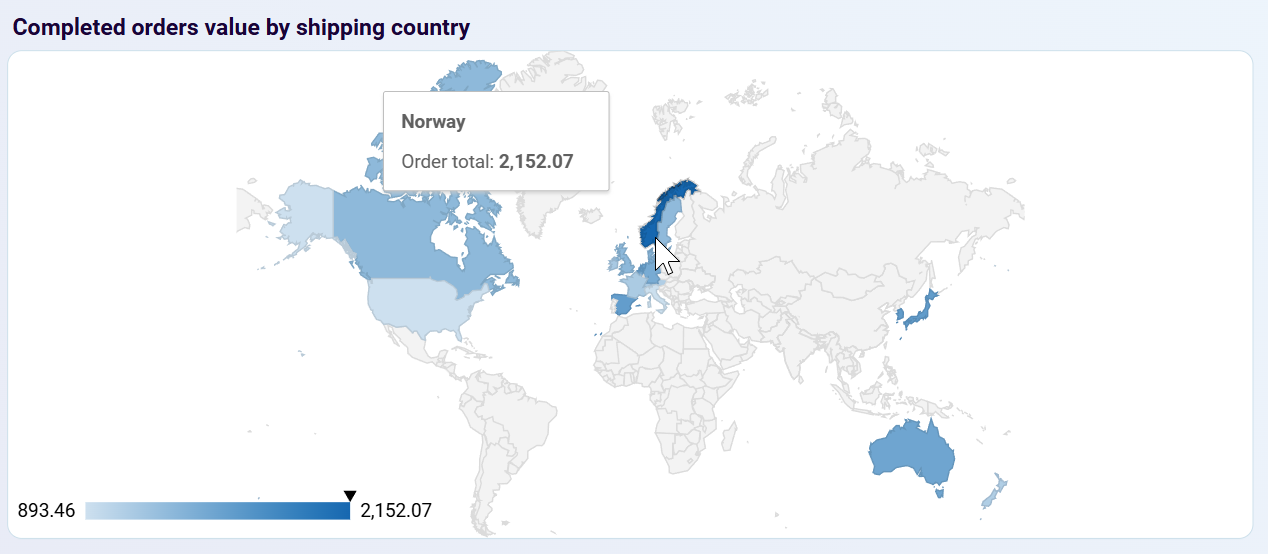
The detailed country-level breakdown combines revenue and order volume with behavioral metrics, including sessions, engagement rates, session-to-order conversion rates, and average session duration for each market. This comprehensive view in the WooCommerce shop manager dashboard identifies countries generating substantial traffic with poor conversion rates—indicating pricing, shipping cost, or payment method barriers—versus high-value markets where visitors convert efficiently. You can spot geographic regions where marketing spend drives visits but yields minimal revenue, guiding decisions about whether to adjust localization, revise shipping strategies, or reallocate advertising budgets to markets with stronger return on investment and genuine purchase intent.
How to create WooCommerce dashboards?

Metrics you can track with a WooCommerce dashboard template
Monitor your store's gross sales across all products and orders with breakdowns by time period. Track daily, weekly, or monthly revenue to identify seasonal patterns and evaluate the impact of marketing campaigns on overall sales performance.
Track the total number of successfully fulfilled orders to understand transaction volume independent of order values. Combined with revenue data, this metric enables average order value calculations and identifies periods of unusually high or low ordering activity.
Calculate the mean purchase amount across all completed transactions to understand typical customer spending behavior. This metric reveals whether revenue increases stem from more orders or higher per-transaction spending, informing decisions about pricing and promotional strategies.
Monitor first-time purchasers to understand customer acquisition performance and evaluate marketing campaign effectiveness. The ratio of new to total customers reveals whether your store depends too heavily on acquisition versus retention, informing budget allocation decisions.
Track the number of unique visitors to your store from Google Analytics 4 to understand traffic volume and audience reach. Comparing total users to completed orders shows your store's efficiency at converting browsers into buyers.
Measure the percentage of website sessions where visitors actively interact with your content through scrolling, clicks, or extended time on site. Low engagement rates despite high traffic volumes signal issues with audience targeting or landing page relevance.
Calculate total advertising spend divided by completed orders to understand customer acquisition efficiency across all marketing channels. Tracking cost per order trends identifies when advertising becomes less efficient, signaling the need for campaign optimization or budget reallocation.
Track total advertising investment across all connected marketing platforms to monitor budget allocation and spending patterns over time. Monitoring advertising spend alongside revenue and order metrics enables you to identify when marketing costs increase without proportional sales growth.
Track the percentage of website sessions that result in completed purchases to measure how effectively your store converts visitors into buyers. Comparing conversion rates across traffic sources and countries identifies optimization opportunities for checkout flow and product presentation.
Monitor how long visitors spend on your store during each visit to understand engagement depth and content effectiveness. This metric provides context for conversion analysis—high conversion with short sessions indicates streamlined purchasing, while low conversion with long sessions signals unclear calls-to-action.