Website dashboard examples and reporting templates
Gain complete visibility into your website performance with automated website dashboards that consolidate data from Google Analytics 4 and Google Search Console. Track traffic patterns, analyze user behavior, monitor landing page effectiveness, and make data-driven decisions based on real-time insights from your analytics platforms.
Website dashboard examples for every need


about your case. It doesn't cost you a penny 😉
Choose your white label website dashboard template to kick off
What is a website dashboard?
Website dashboards reveal traffic sources, engagement patterns, landing page effectiveness, and conversion paths. With automated data refreshing through Coupler.io, these dashboards ensure you're working with up-to-date information without manual exports or data consolidation.

What reports should be included in website dashboards?
An effective website dashboard should include several analytics reports that provide complete visibility into your site's performance. Based on our analysis of GA4 and Search Console dashboards, we recommend incorporating these four report types:
The traffic patterns report tracks visitor volume across daily, weekly, and monthly timeframes, revealing how your audience grows over time. This report includes metrics like total users, new users, active users, and sessions that show both immediate trends and long-term trajectory. It helps you identify traffic spikes, seasonal variations, and the impact of marketing campaigns. The visualization of traffic by channels (organic search, paid search, direct, referral, social) shows which sources drive the most visitors.
The acquisition insights report reveals where your audience originates, including traffic sources, countries, and referral channels. It breaks down user acquisition patterns by medium (organic, paid, social, email) and shows geographic distribution of visitors. This report includes metrics like source/medium combinations, country-level traffic, and channel groupings that demonstrate how different marketing efforts contribute to your overall traffic.
The behavior and engagement report provides visibility into how visitors interact with your website once they arrive. It tracks average engagement time per session, average engagement time per user, views, views per user, and engaged sessions per user. This report reveals which content captures attention, how deeply users explore your site, and whether they're finding value in their visits.
The conversion tracking report shows how users move through your website toward valuable actions. It monitors conversion rate, total conversions, total purchases, and total revenue to demonstrate how effectively your site turns visitors into customers or leads. This report includes key events that you've defined as important (form submissions, downloads, sign-ups) and shows which pages or sources drive the most conversions.
What insights you can get with a website reporting dashboard
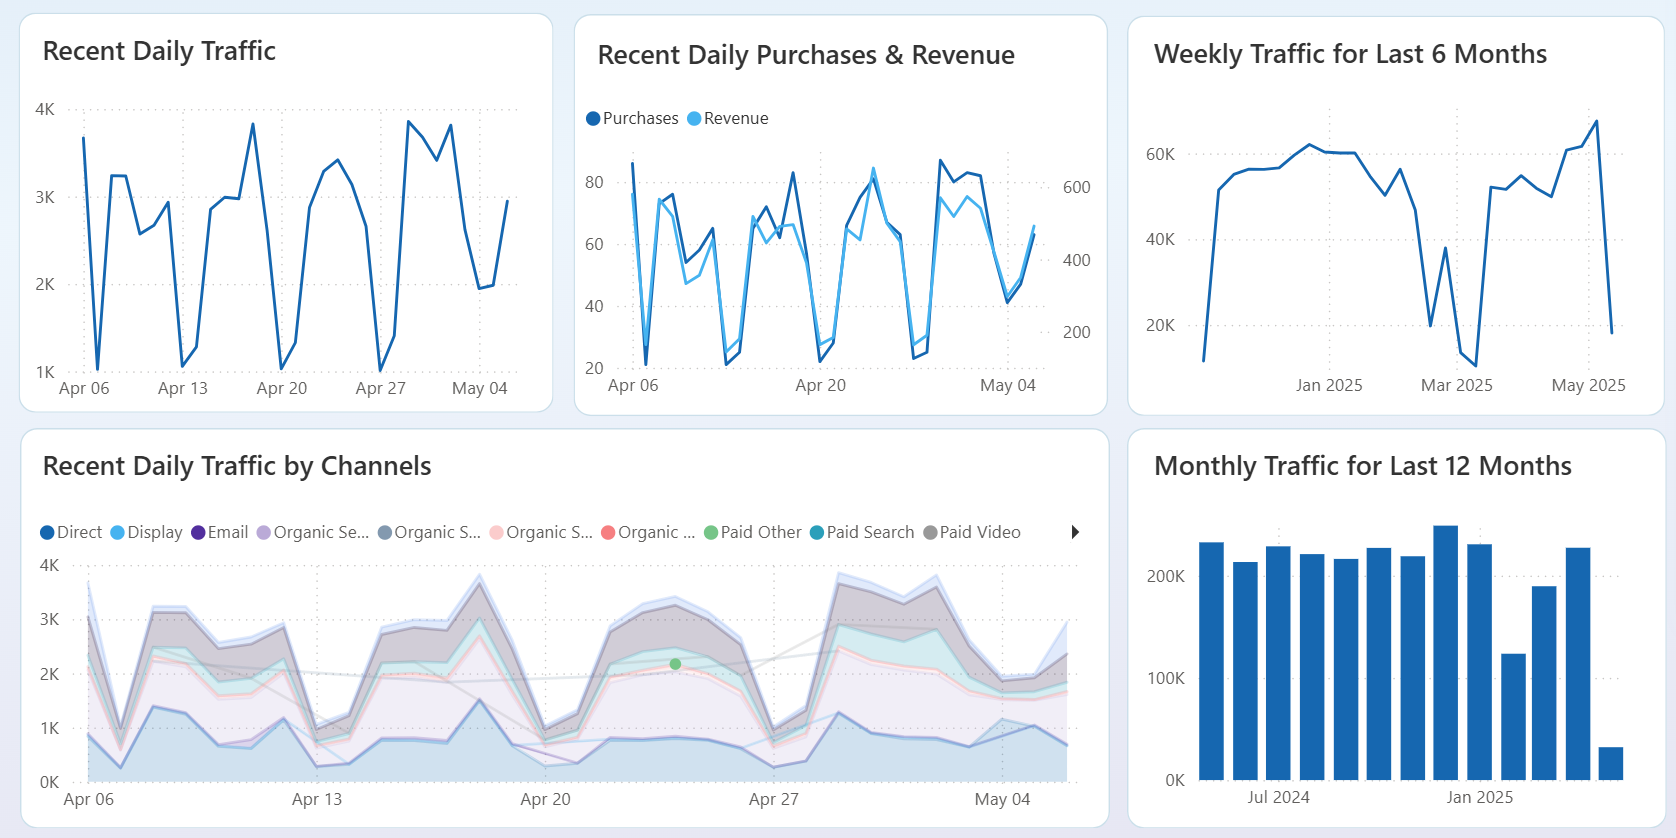
Visualize how your visitor volume changes across days, weeks, and months to spot trends that matter for your business. You'll see when traffic spikes occur and can connect them to specific campaigns or content launches, recognize declining trends before they impact revenue, and understand seasonal variations in audience behavior. Whether you need to assess yesterday's performance or analyze six months of growth, the multi-timeframe view shows both immediate wins and long-term trajectory so you can adjust strategies proactively.
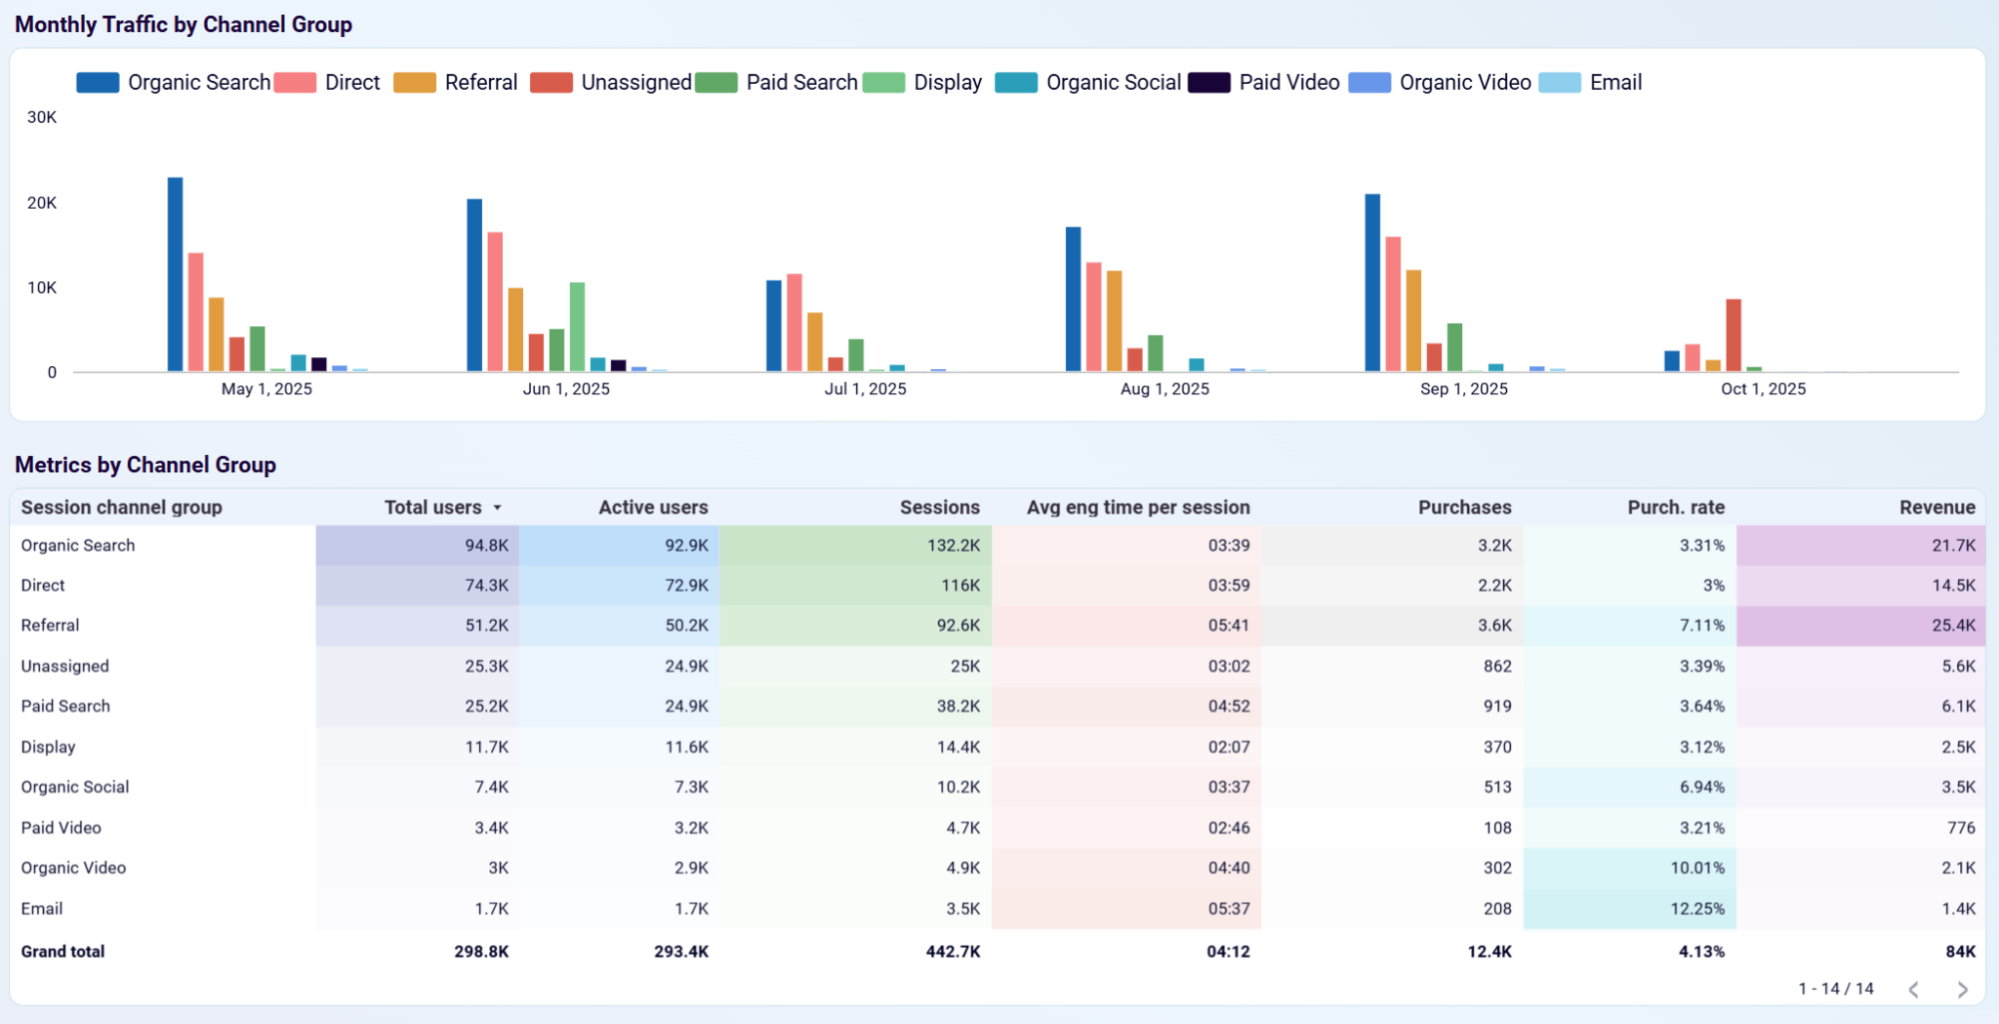
See exactly where your visitors come from and how each acquisition source performs over time. The dashboard reveals whether organic search, paid advertising, social media, or referrals bring the most engaged audiences to your site. You can pinpoint which channels are growing stronger and which are losing effectiveness, spot opportunities to diversify beyond your current top sources, and make informed decisions about where to invest marketing resources for maximum impact.
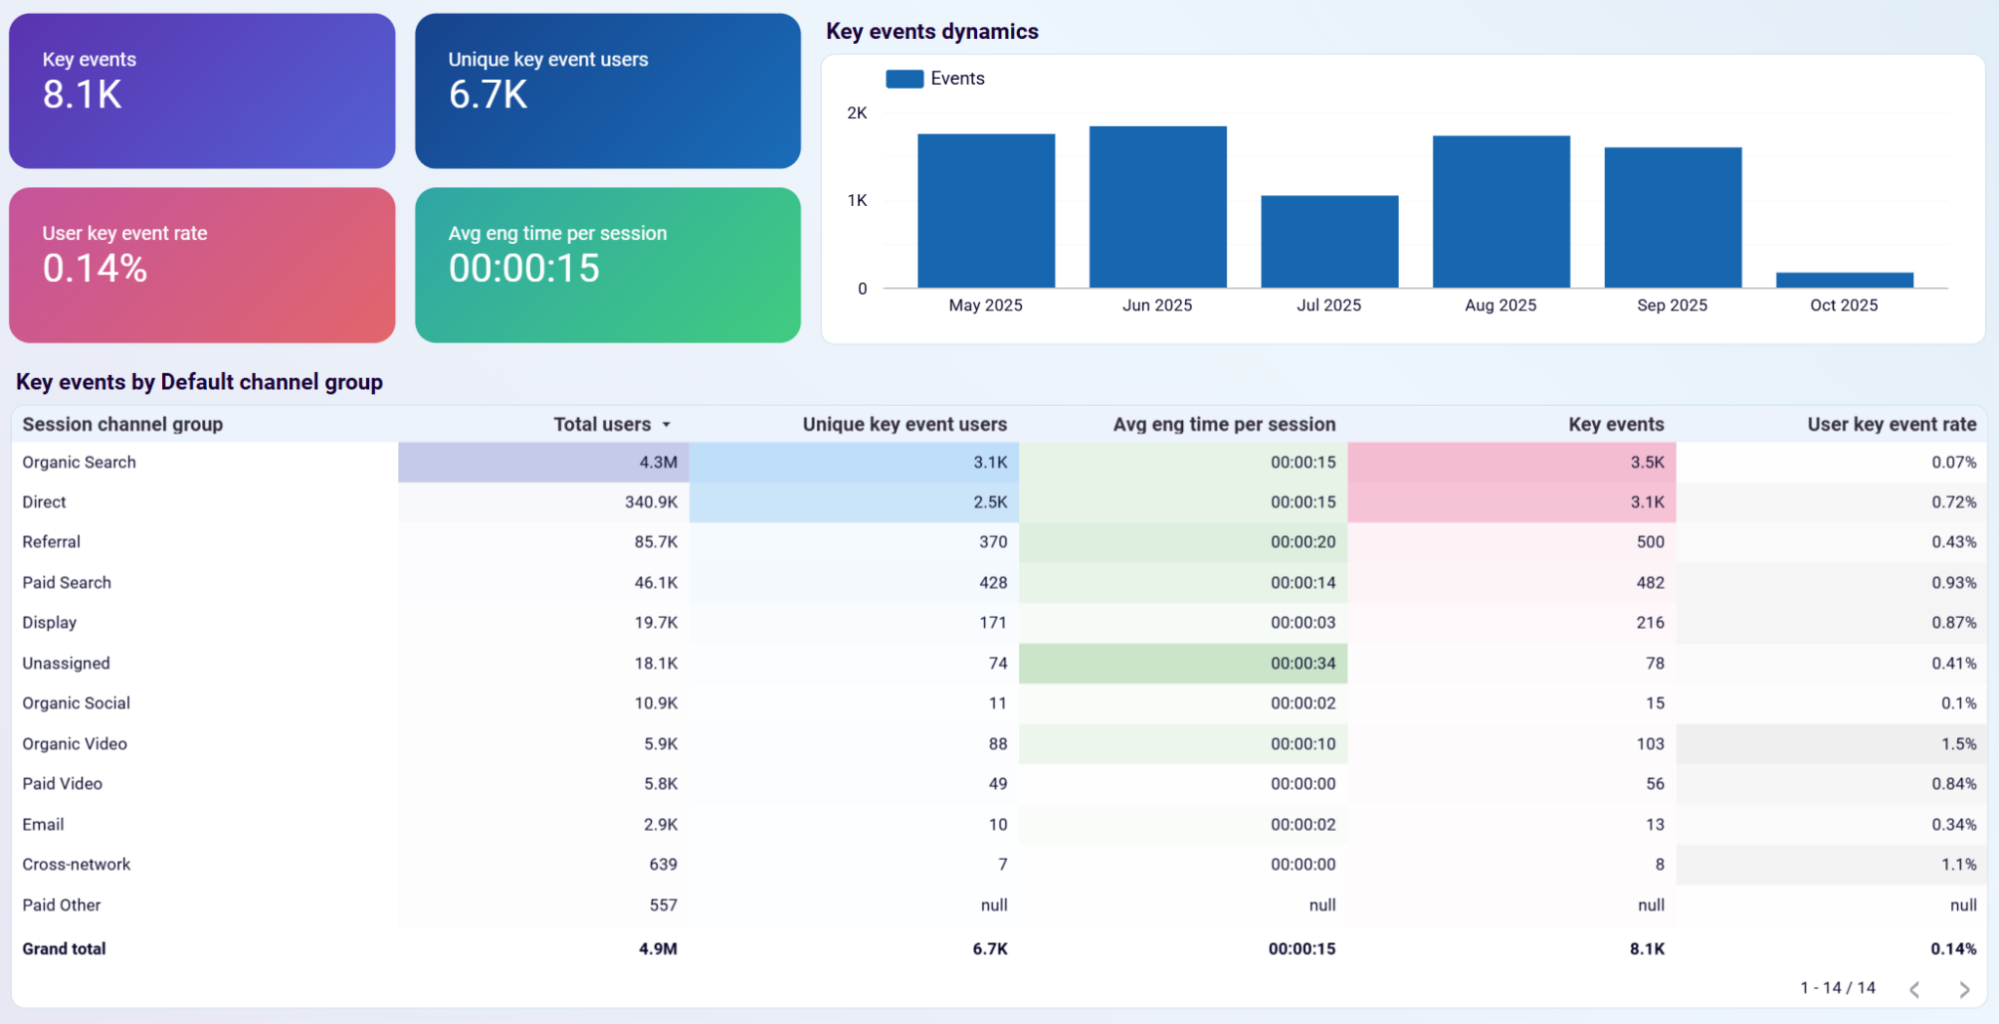
Understand how visitor activity translates into actual business results by tracking conversions and revenue generation. You'll see which traffic sources or content types produce the highest conversion rates, identify periods when your site converts visitors most efficiently, and calculate the true value of your marketing efforts. This connection between traffic metrics and financial outcomes helps you prioritize optimization work on the pages and channels that matter most to your bottom line.
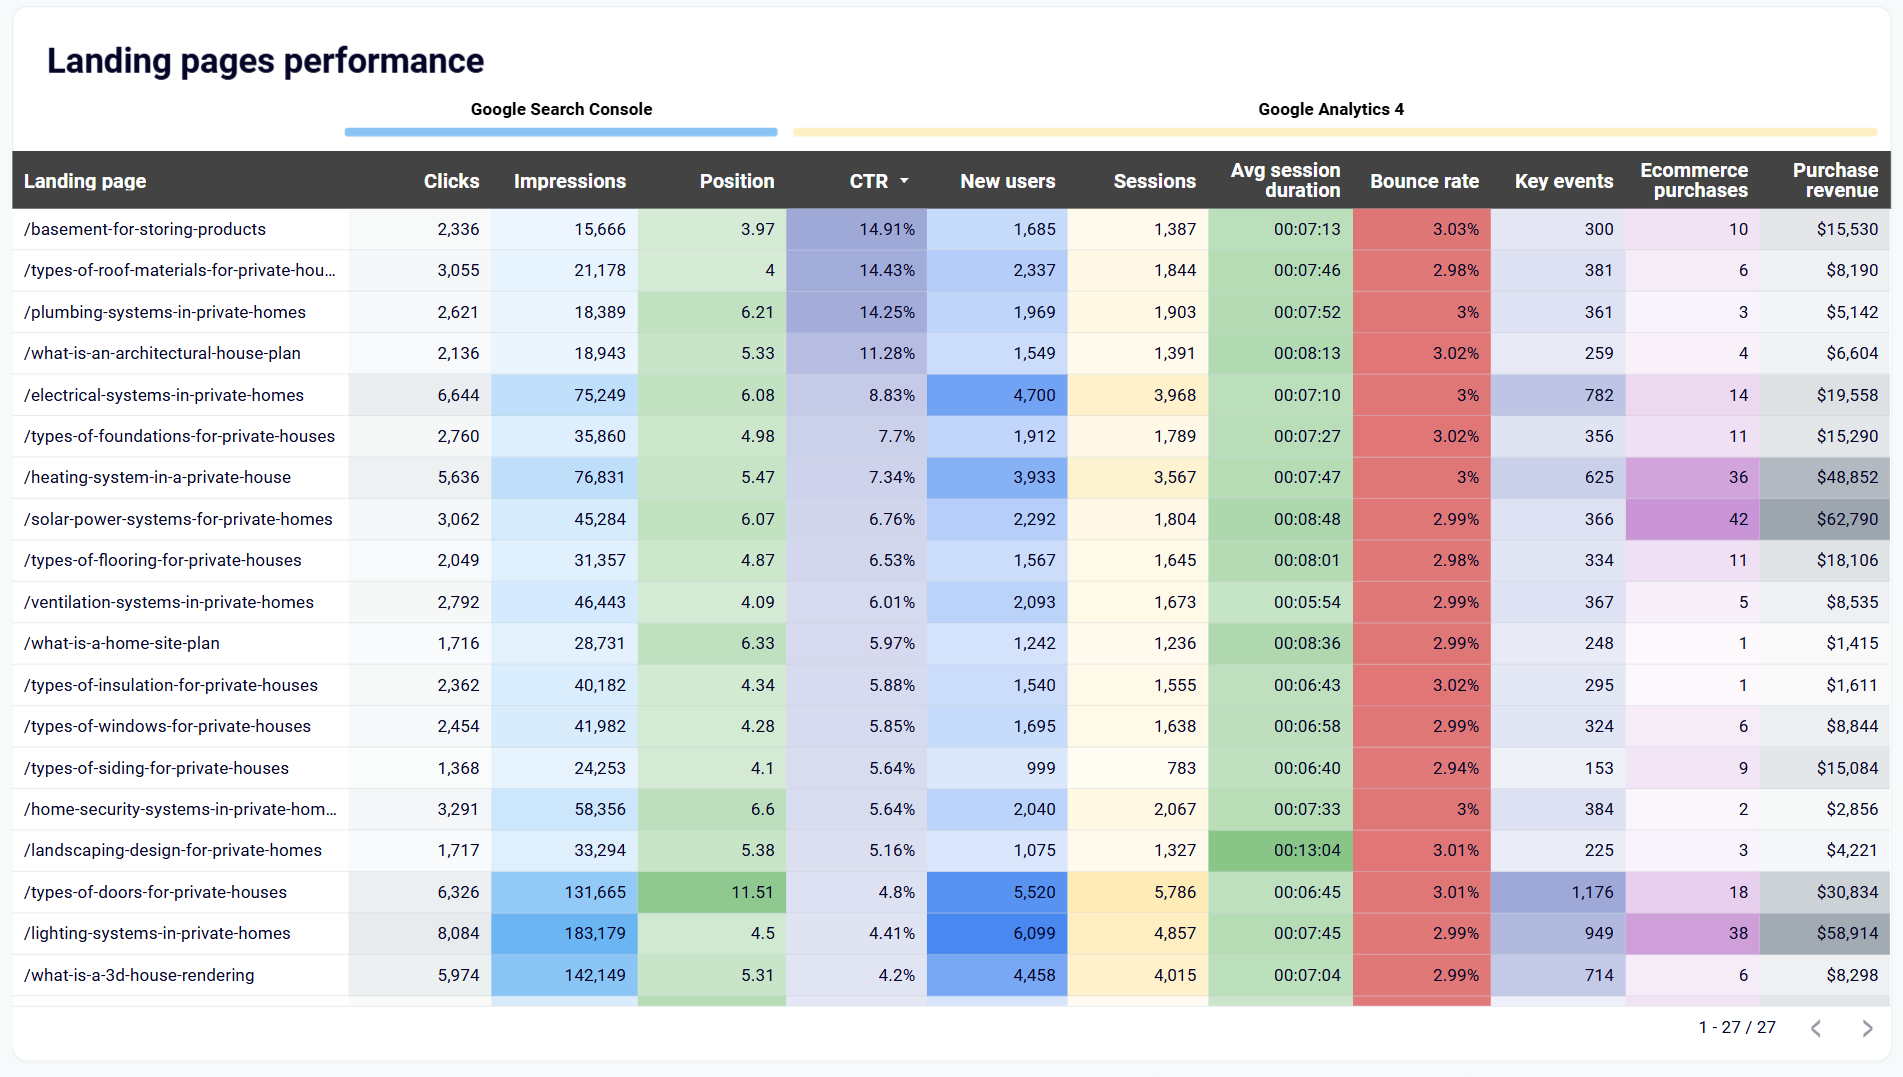
Understand the complete performance story for each landing page from search appearance to final purchase. You'll identify pages that rank well in search but fail to attract clicks due to weak titles or descriptions, discover pages that generate strong traffic but lose visitors due to poor user experience, and find your star performers so you can replicate their success across other content. This dual-source view eliminates blind spots and shows exactly where optimization efforts will have the biggest impact.
How to create a website dashboard?

Metrics you can track with an website dashboard template
The complete count of visitors who accessed your website during the selected period, including both new and returning visitors. This metric provides the broadest measure of your site's reach and helps you understand the overall size of your audience across all traffic sources and devices.
The number of visitors accessing your website for the first time during the selected period. This metric indicates the effectiveness of your acquisition efforts and shows how successfully you're expanding your audience beyond existing visitors, which is crucial for growth.
The total number of individual visits to your website, where each session represents a continuous period of user activity. This metric helps you understand engagement frequency and shows how often visitors return to interact with your content, revealing patterns in user behavior.
The total number of times users completed actions you've defined as valuable, such as purchases, form submissions, or downloads. This metric directly measures how effectively your website drives desired outcomes and demonstrates the business impact of your traffic.
The percentage of sessions that result in a conversion, calculated by dividing total conversions by total sessions. This metric reveals how efficiently your website turns visitors into customers or leads, helping you benchmark performance and identify optimization opportunities.
The complete monetary value generated through purchases on your website during the selected period. This metric connects website performance directly to financial outcomes and helps you calculate the return on investment for your marketing and optimization efforts.
The average duration visitors actively interact with your website during each session, measured by time spent viewing content. This metric indicates content quality and relevance, showing whether visitors find enough value to spend meaningful time exploring your site.
The percentage of sessions where visitors view only one page before leaving your website. This metric identifies potential user experience issues or content misalignment, with high bounce rates suggesting that landing pages aren't meeting visitor expectations or needs.
The total number of times your website pages appeared in Google search results, regardless of whether users clicked. This metric from Search Console shows your search visibility and indicates the potential reach of your content in organic search.
The number of times users clicked through to your website from Google search results. This metric demonstrates how effectively your titles and descriptions attract searchers and shows which pages successfully convert search visibility into actual traffic.
The typical ranking position of your website pages in Google search results for relevant queries. This metric helps you understand your competitive standing in search, with lower numbers indicating higher rankings that typically generate more clicks and traffic.
The percentage of impressions that result in clicks to your website from search results. This metric reveals how compelling your search listings are and helps identify pages where improved titles or descriptions could generate more traffic from existing search visibility.