Startup dashboard examples and reporting templates
Navigate the chaos of early-stage business with intelligent startup dashboard solutions that turn raw data into your competitive advantage. Cut through uncertainty by gaining real-time visibility into your team's performance, financial health, and growth potential.
Startup dashboard examples for every need


 +1
+1


 +3
+3


about your case. It doesn't cost you a penny 😉
Choose your white label Startup dashboard to kick off
What is a startup dashboard?
By integrating data from multiple sources, a startup metrics dashboard reveals the hidden interconnections between team productivity, sales performance, and resource allocation. Automated updates through Coupler.io ensure you're always looking at a real-time snapshot of your business's true health. This means founders can spot potential issues before they become critical, identify emerging opportunities, and make decisive moves with confidence.

What reports should be included on a Startup dashboard?
Effective startup performance tracking goes beyond surface-level metrics. The most impactful startup KPI dashboard provides deep, interconnected insights that tell the full story of your business's potential and challenges.
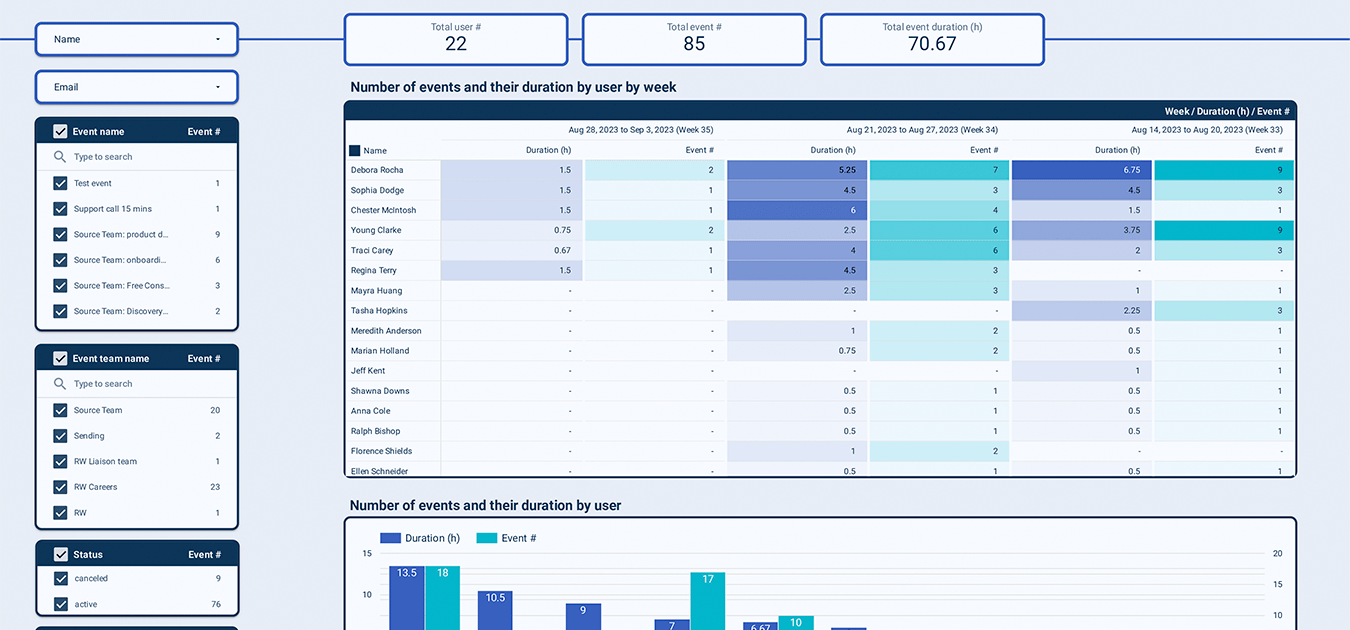
This isn't just about hours worked—it's about understanding how your team's energy translates into real business value. Track not just time spent, but the actual impact of each hour. Identify productivity patterns, detect potential burnout risks, and optimize your most critical resource: human potential.
Forget vanity metrics. This report reveals the brutal truth of your sales ecosystem. It tracks the entire customer journey from first contact to conversion, showing exactly where potential customers slip away. Understand your true customer acquisition costs, conversion rates, and the precise levers you can pull to accelerate growth.
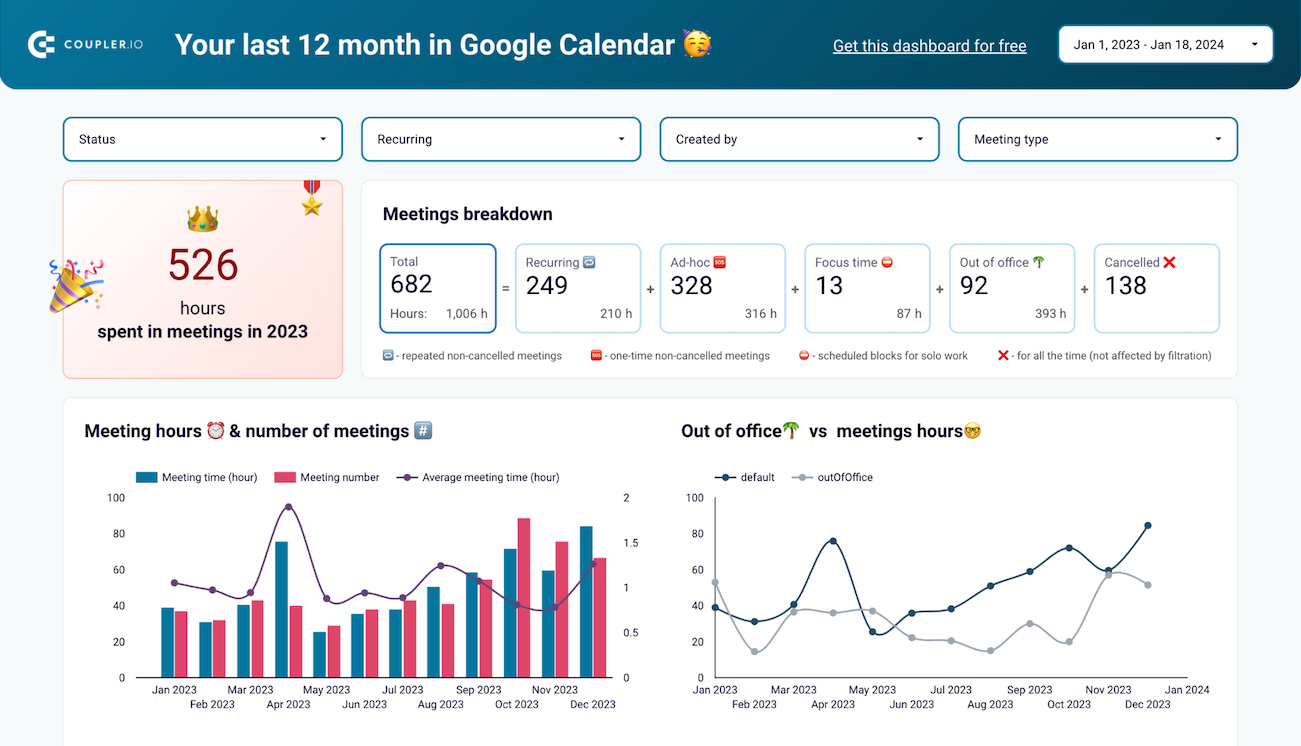
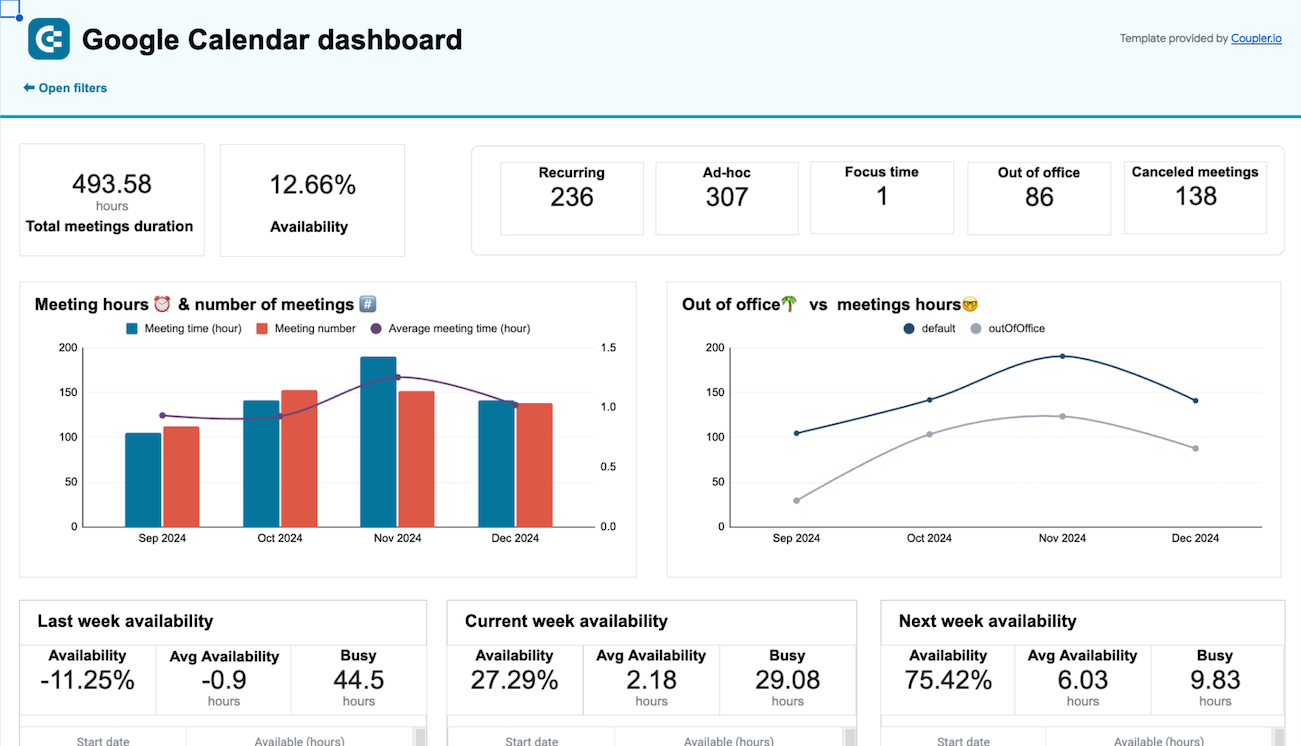
Time is your most finite resource. This report goes beyond simple meeting tracking, revealing how your team's collective energy is actually being deployed. Identify time-wasting activities, optimize collaborative efforts, and create space for deep, strategic work that moves the needle.
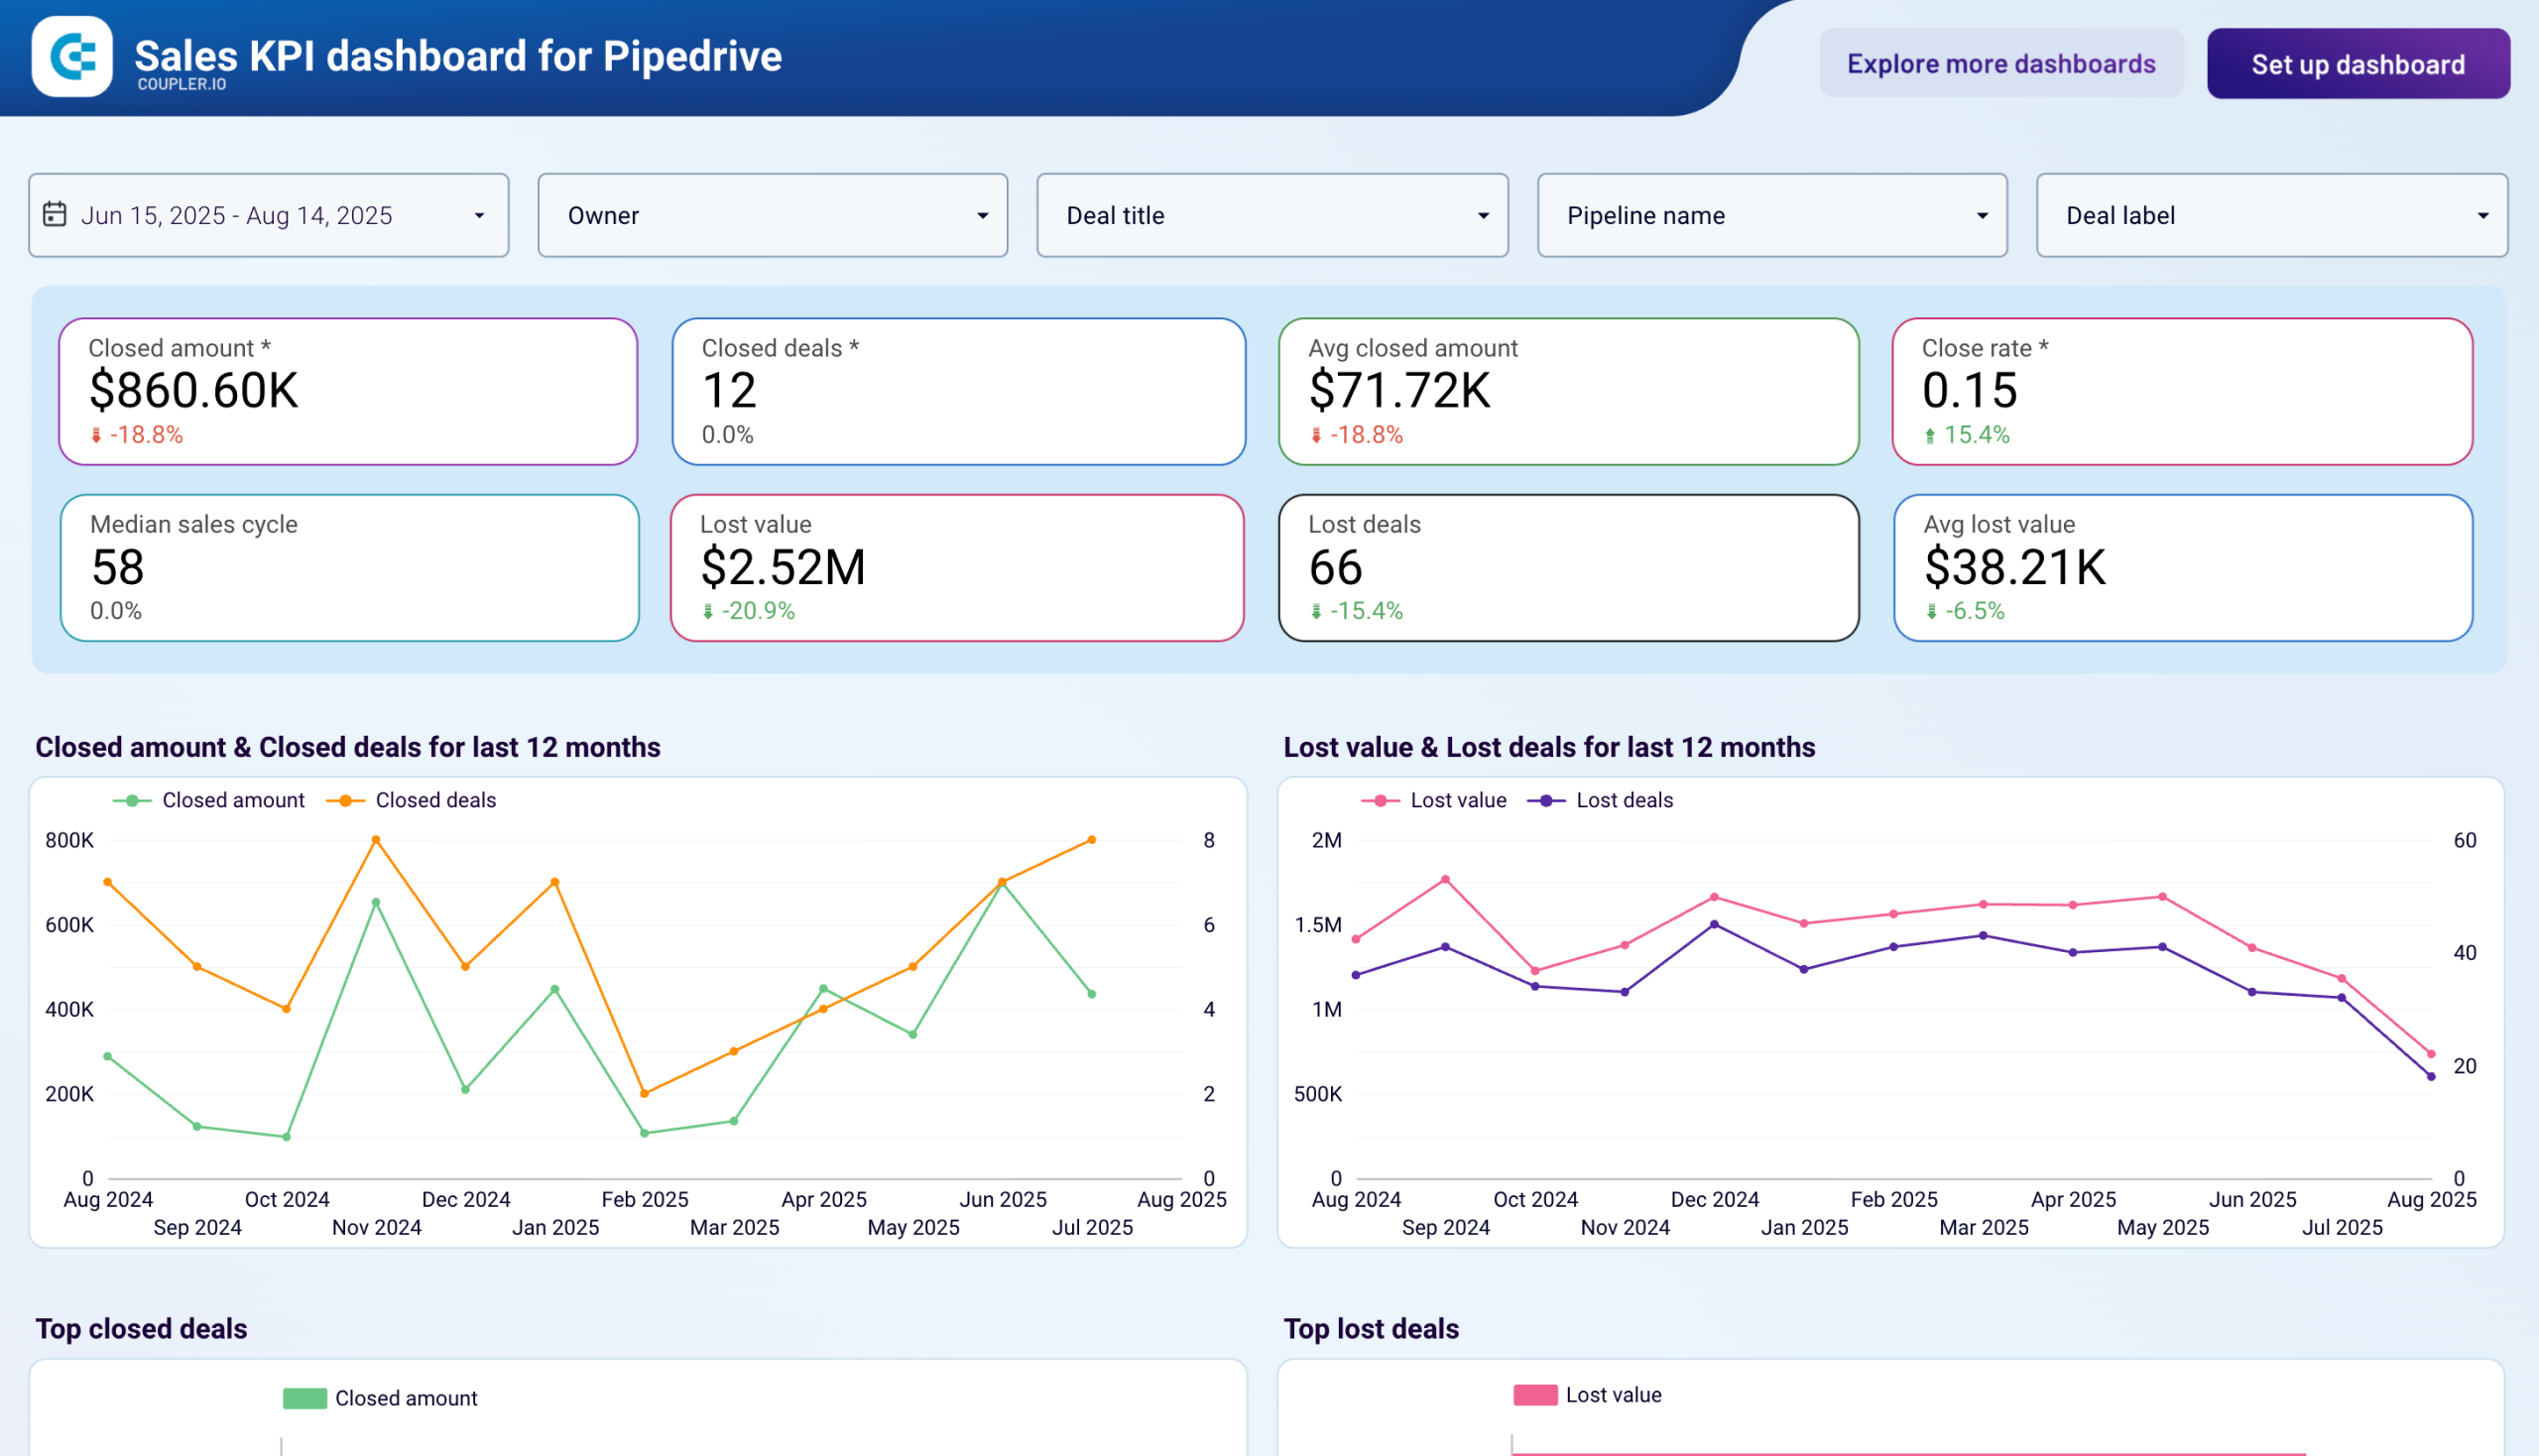
A microscope for your sales pipeline, this report dissects every aspect of your potential opportunities. Track deal sizes, conversion rates, and time-to-close with surgical precision. Understand which types of deals drive your business forward and where to focus your limited resources.
What insights you can get with the startup dashboard
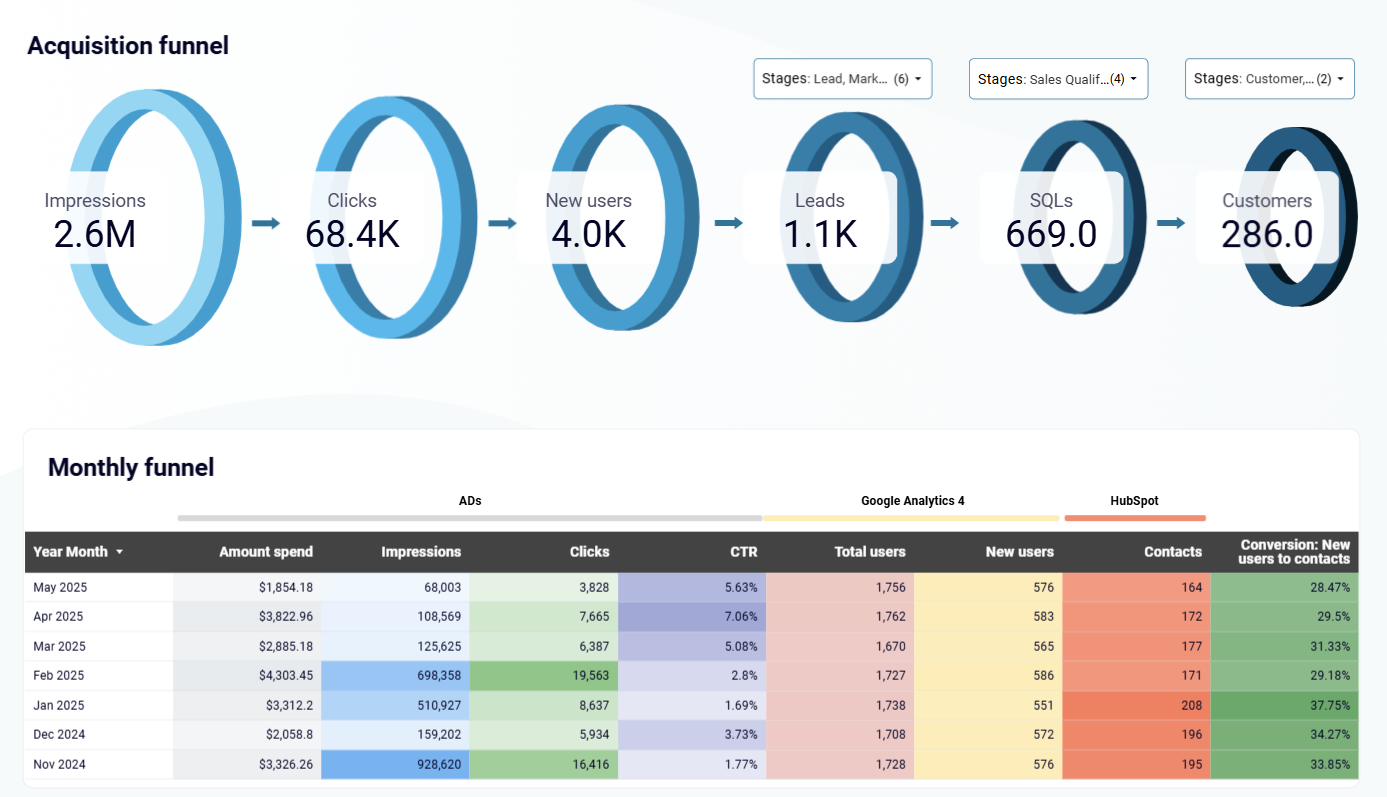
Gain a comprehensive view of your entire lead generation journey by tracking conversion rates across different channels. The dashboard reveals critical performance fluctuations that impact your growth potential. It helps you understand exactly where potential customers drop off and how to optimize each stage of your sales process. By providing granular insights into lead progression, this tool enables startups to make data-driven decisions that can dramatically improve conversion rates and accelerate revenue growth.
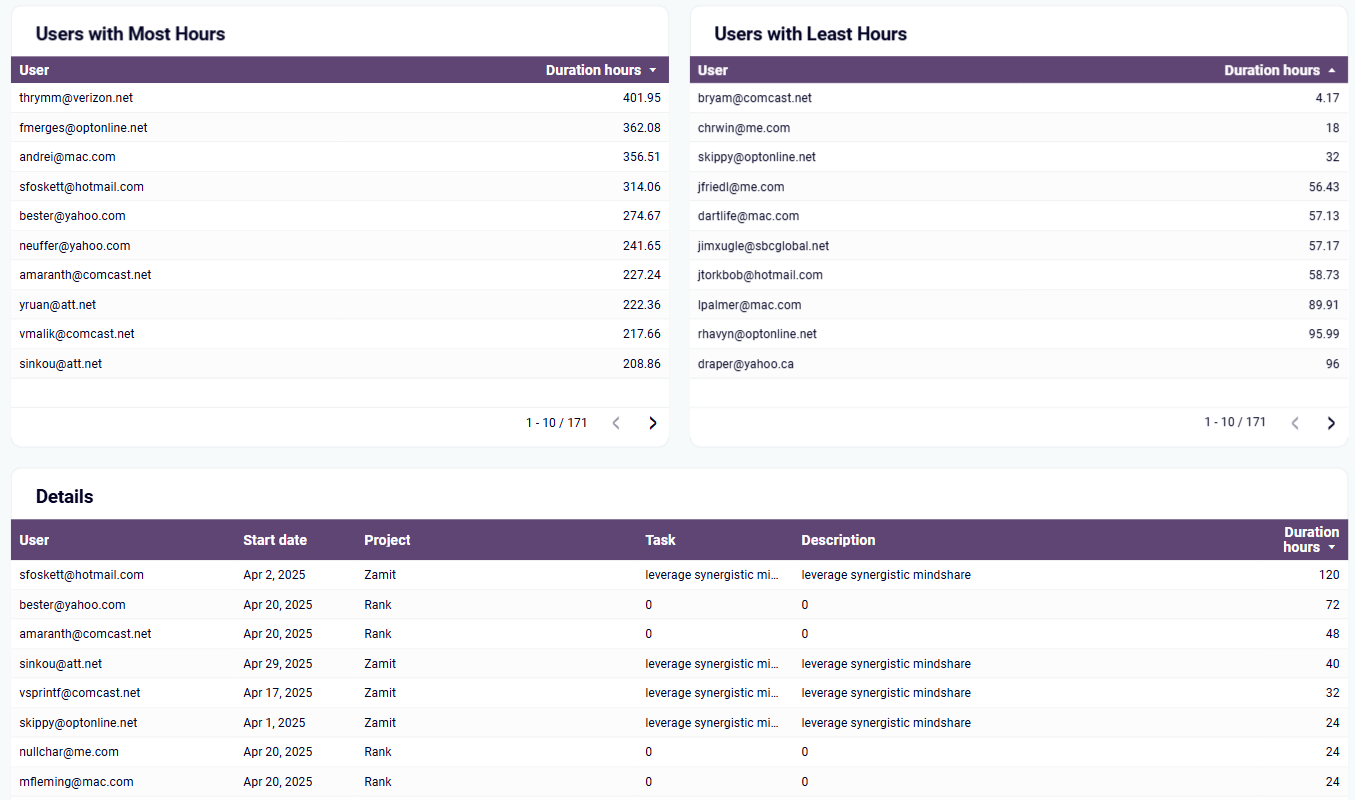
Dive deep into your team's performance with a sophisticated analysis of time efficiency and project output. This insight goes beyond simple time tracking, revealing the intricate relationship between hours worked and actual business value created. By identifying productivity patterns, uncovering potential inefficiencies, and highlighting top-performing team members, the dashboard provides a comprehensive view of your team's capabilities. Startups can use these insights to optimize workflows, balance workloads, and ensure that every hour contributes meaningfully to company objectives.
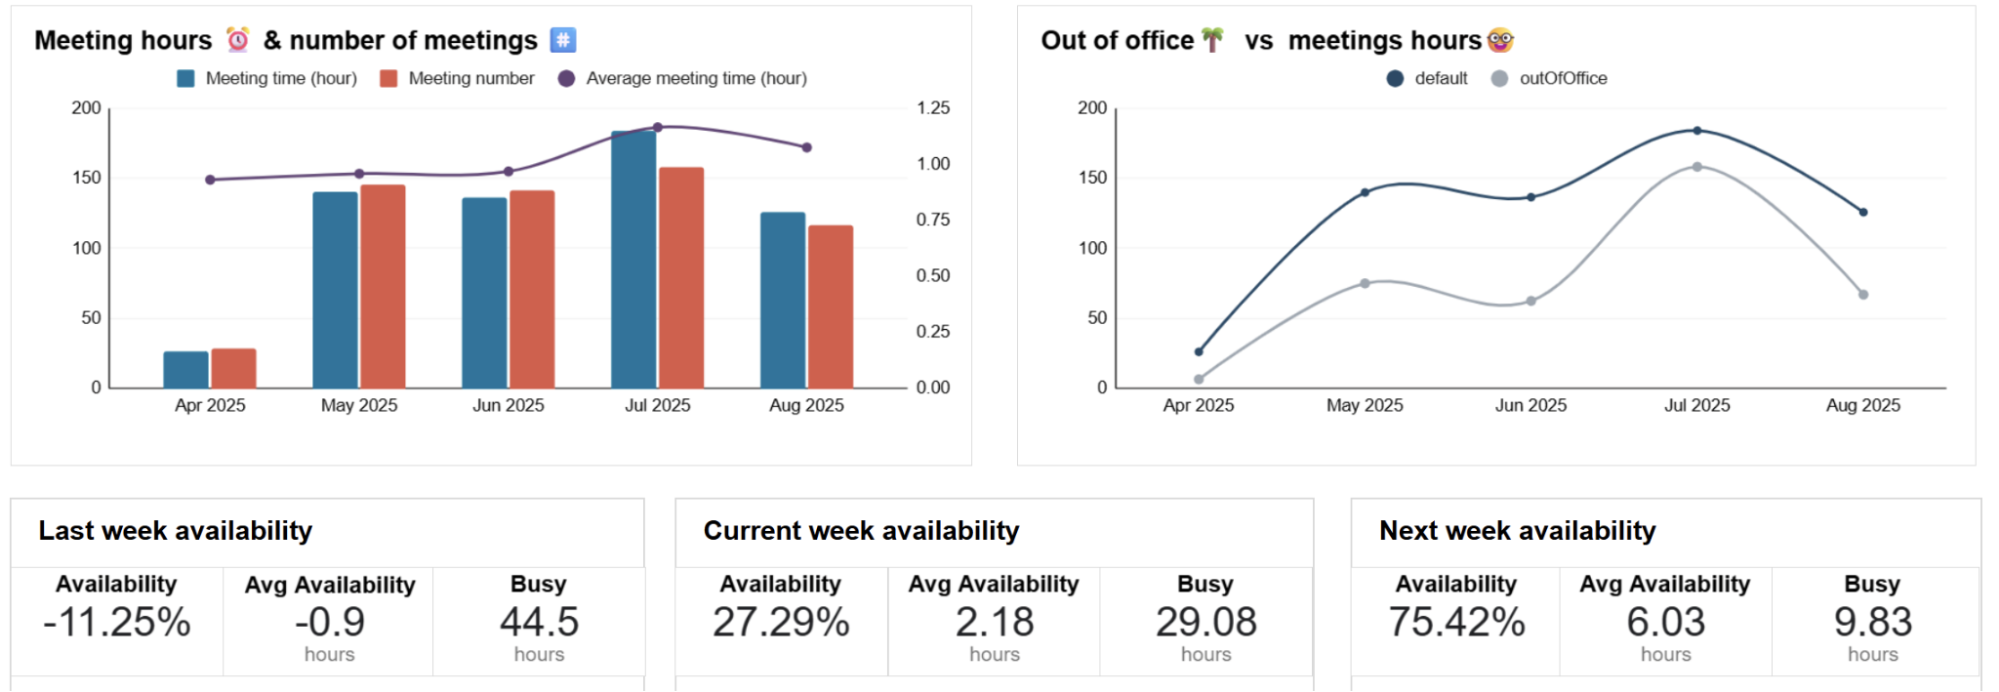
Transform how your organization approaches time and collaboration by gaining unprecedented visibility into meeting dynamics. This insight reveals the true impact of meetings on your team's productivity, tracking not just time spent, but the strategic value of each interaction. Understand which meetings drive progress, which drain resources, and how to create more space for deep, strategic work. By balancing meeting frequency, duration, and outcomes, startups can optimize team energy and focus on high-impact activities that truly move the needle.
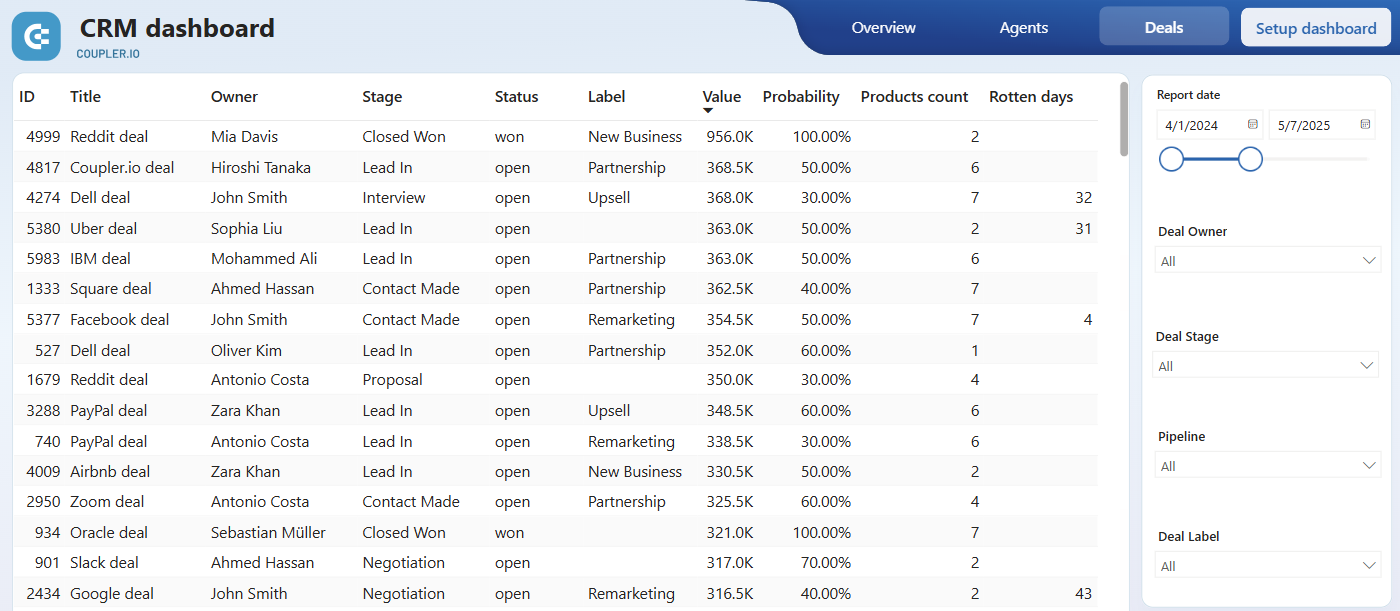
Unlock a microscopic view of your sales pipeline that goes beyond surface-level metrics. This insight provides a comprehensive analysis of deal characteristics, tracking the entire journey from initial contact to closed opportunity. Understand the precise factors that influence deal success, identify critical time thresholds, and develop a data-driven approach to sales strategy. By revealing the nuanced dynamics of your sales process, the dashboard empowers startups to refine their approach, prioritize high-potential opportunities, and consistently improve conversion performance.
How to create a performance marketing dashboard?

Metrics you can track with a startup dashboard template
Measure the number of unique individuals engaging with your business across different platforms. This metric provides a clear view of your potential market reach and helps track overall business visibility and growth potential.
Track the percentage of leads or opportunities that transform into actual sales. Understanding this metric helps you optimize your sales funnel, identify effective marketing strategies, and improve your overall business conversion efficiency.
Quantify the potential revenue from current sales opportunities. This metric gives you a real-time snapshot of your pipeline's financial potential, helping you forecast revenue and prioritize high-value prospects.
Measure the productive time that directly contributes to your business revenue. This metric helps you understand team efficiency, optimize resource allocation, and ensure that time investments translate into tangible business value.
Analyze the total time spent in meetings versus available productive time. This metric helps you identify potential time-wasting activities, optimize team collaboration, and create more space for strategic work.
Monitor the number of new potential customers or leads acquired. This metric is crucial for understanding your business's growth rate, marketing effectiveness, and ability to expand your customer base.
Calculate the average time taken to close a deal from initial contact. Understanding this metric helps you streamline your sales process, identify bottlenecks, and improve overall sales efficiency.
Track the number of critical business actions completed, such as sign-ups, demos, or product inquiries. This metric provides insights into user engagement and helps measure the effectiveness of your marketing and sales efforts.