Sales CRM dashboard examples and reporting templates
Transform your sales data into actionable insights with automated sales CRM dashboards that consolidate information from Salesforce, Pipedrive, and HubSpot. Monitor pipeline health, track deal progression, analyze team performance, and identify revenue opportunities with real-time reporting that eliminates manual data compilation and accelerates decision-making for sales leaders.
CRM sales dashboard examples for every need


about your case. It doesn't cost you a penny 😉
Choose your white label sales CRM dashboard to kick off
What is a sales CRM dashboard?
Unlike static CRM reports, sales CRM reporting dashboards provide dynamic visualizations that update automatically through Coupler.io integration, ensuring sales managers always have access to current pipeline status, opportunity analysis, and performance benchmarks. The dashboard eliminates the need to navigate multiple CRM screens by presenting deal stages, win rates, revenue trends, and team comparisons in a unified interface that supports faster strategic decisions.

What reports should be included in sales CRM dashboards?
Effective sales CRM reporting dashboards require strategic report selection that addresses core sales management challenges. Based on analysis of Salesforce, HubSpot, and Pipedrive implementations, successful sales CRM dashboard templates should incorporate four fundamental report categories that provide comprehensive visibility into sales performance, pipeline health, and team effectiveness for data-driven decision making.
The pipeline management report forms the foundation of effective sales CRM reporting dashboards by providing comprehensive visibility into deal flow and stage progression. This report tracks opportunities as they move through your sales process, displaying key metrics like deal value, probability scores, and stage duration. It identifies bottlenecks where deals commonly stall and highlights opportunities requiring immediate attention. The visualization includes filtering capabilities by owner, deal type, and time period, enabling sales managers to drill down into specific segments of their pipeline. This report ensures no opportunities fall through cracks while providing the data needed to optimize conversion rates and forecast revenue accurately.
Deal analysis reports dive deep into individual opportunity characteristics and performance patterns across your sales pipeline. These reports examine won and lost deals to identify common success factors and failure points, providing insights into optimal deal sizes, customer profiles, and closing timelines. The analysis includes deal stage distribution metrics that reveal where opportunities typically get stuck, such as prolonged negotiation phases or qualification bottlenecks. Sales teams use this intelligence to refine their approach, improve qualification processes, and develop strategies for moving stalled deals forward through systematic analysis of historical deal patterns.
Team performance reports provide comparative analysis of individual sales representative effectiveness across multiple dimensions including win rates, deal velocity, and revenue generation. These reports track each team member's pipeline health, average deal size, and conversion rates at different stages, enabling sales managers to identify top performers and coaching opportunities. The visualization includes quota attainment tracking, activity metrics, and territory performance comparisons that inform resource allocation decisions. This comprehensive view of team dynamics helps optimize territory assignments, set realistic targets, and implement focused training programs based on actual performance data rather than assumptions.
Revenue tracking reports monitor financial performance trends and forecast future earnings based on current pipeline composition and historical conversion patterns. These reports combine closed revenue with projected income from active opportunities, weighted by probability and stage progression rates. The analysis includes monthly and quarterly revenue trends, year-over-year comparisons, and variance analysis against targets. Sales leaders rely on these insights to make informed decisions about resource allocation, territory expansion, and strategic planning while maintaining accurate revenue forecasts for executive reporting and business planning purposes.
What insights you can get with the sales CRM dashboard
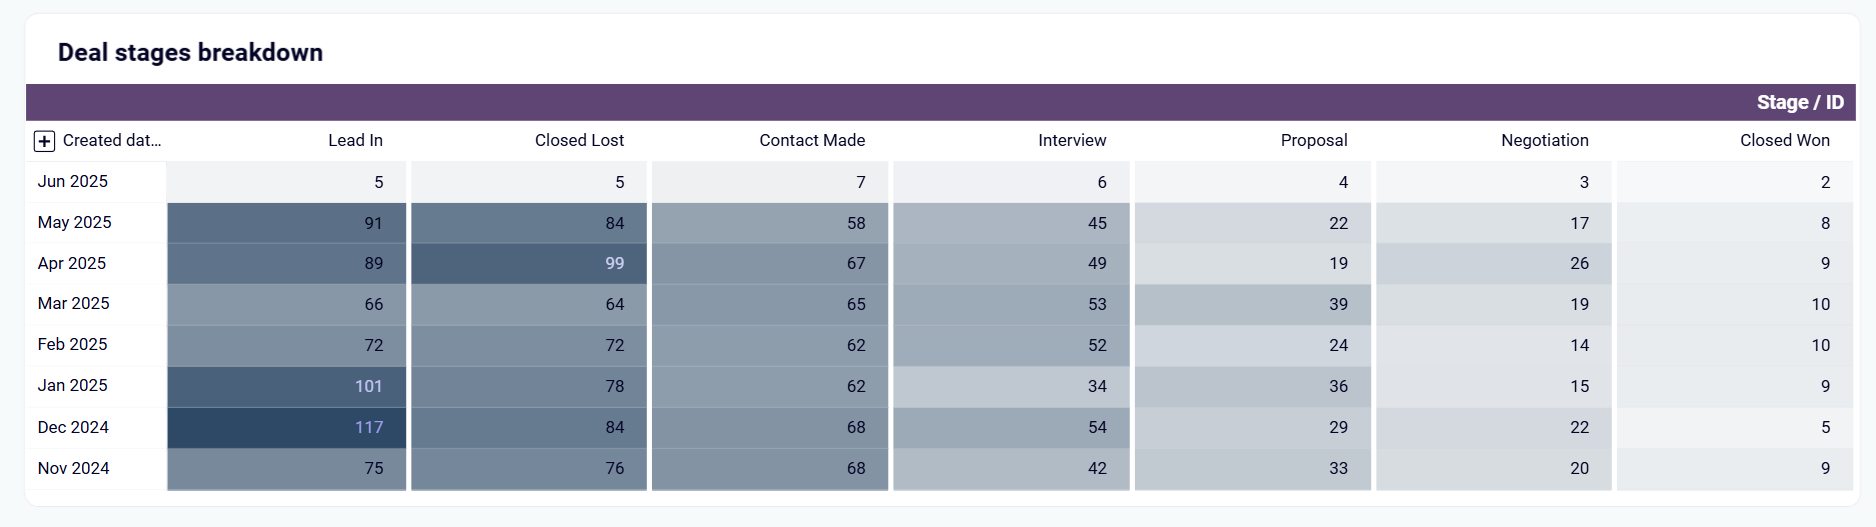
Analyze how opportunities move through stages from lead-in to closed won/lost, identifying where deals get stuck such as high percentages lingering in negotiation stages. This analysis pinpoints systematic issues in your sales process that require process improvements or additional training.
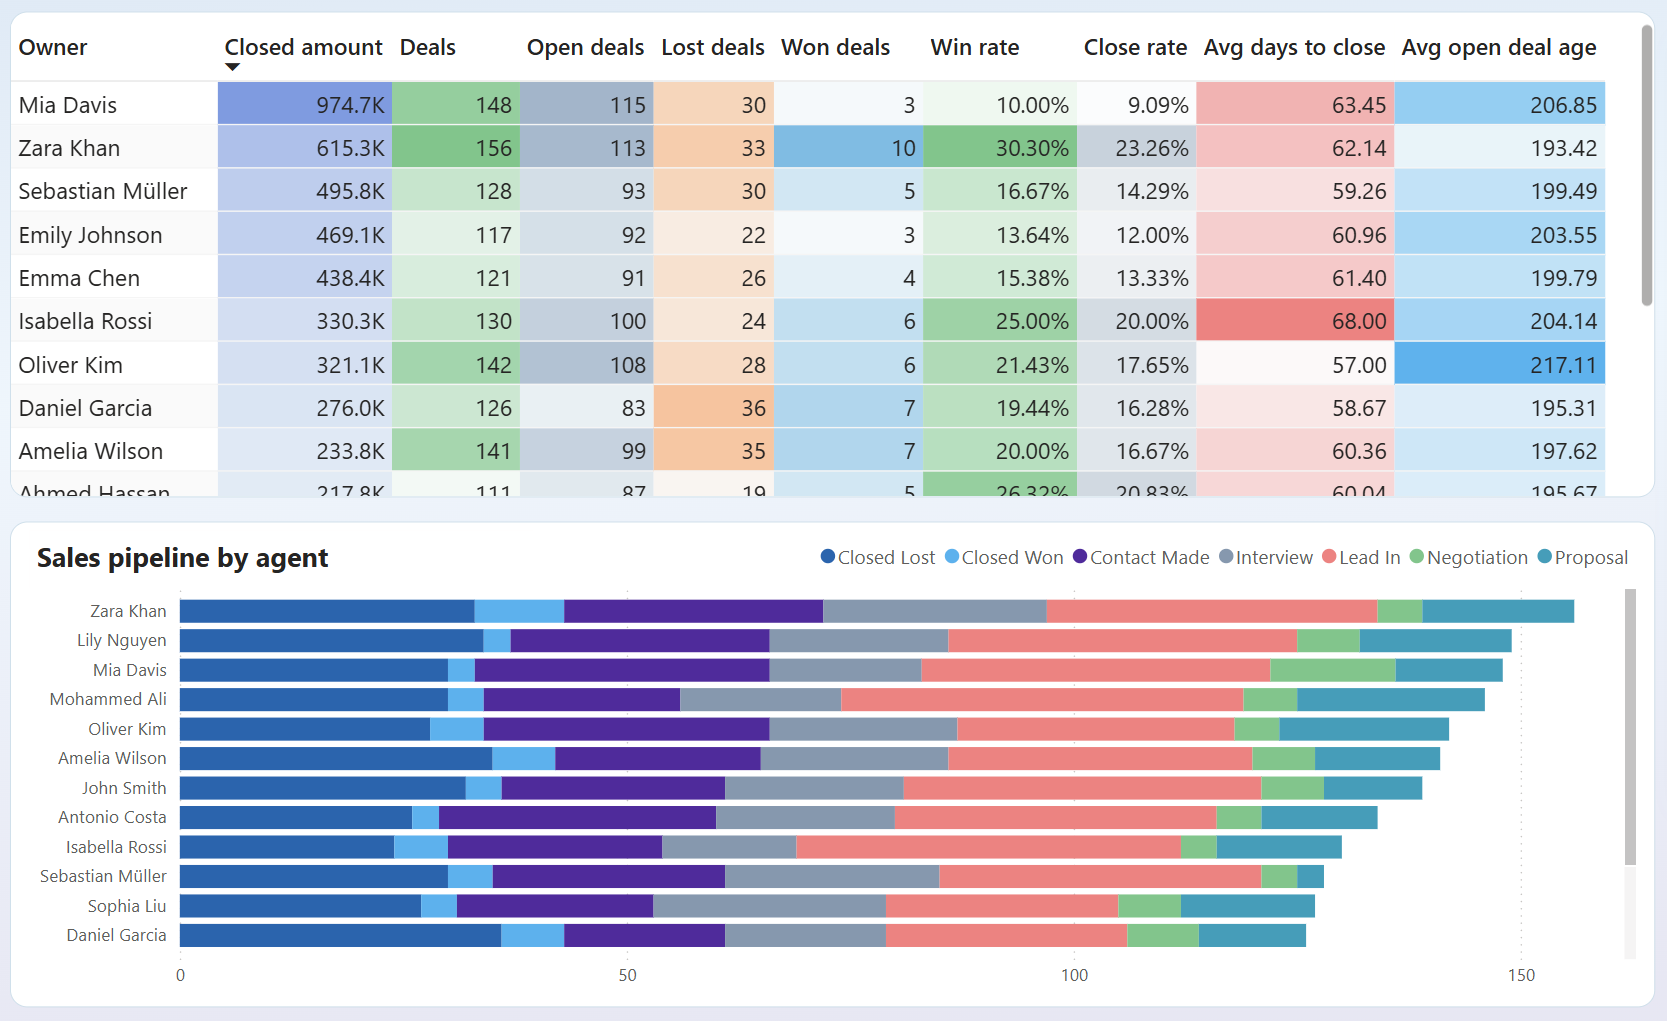
Assess performance trends by comparing sales outcomes across different team members, deal types, and pipelines to highlight variations in achievement levels. This analysis identifies patterns that contribute to higher success rates and reveals coaching opportunities for underperforming representatives.
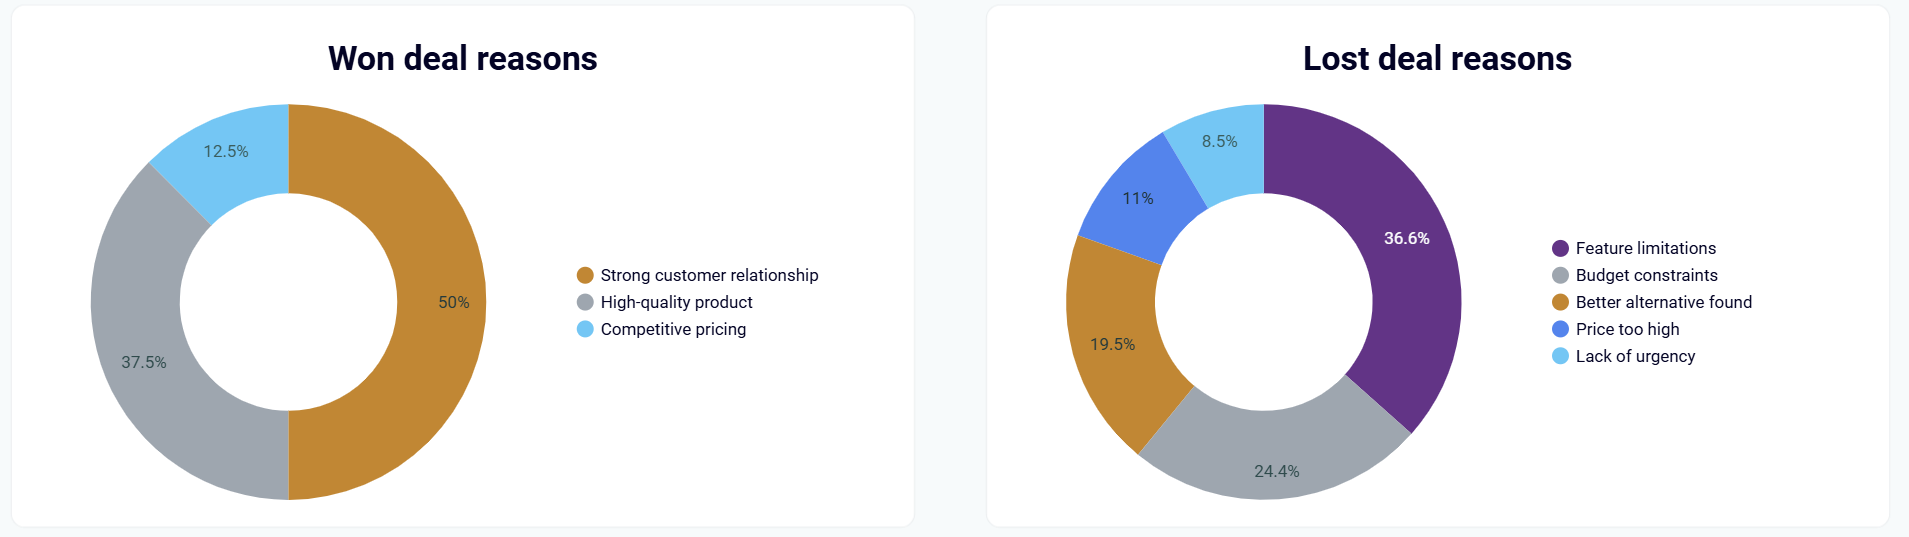
Analyze specific reasons why deals are won or lost with detailed breakdowns showing factors like strong customer relationships, competitive pricing, budget constraints, and feature limitations. This comprehensive analysis helps sales teams understand what drives successful closures and what obstacles prevent deal completion for strategic process improvements.
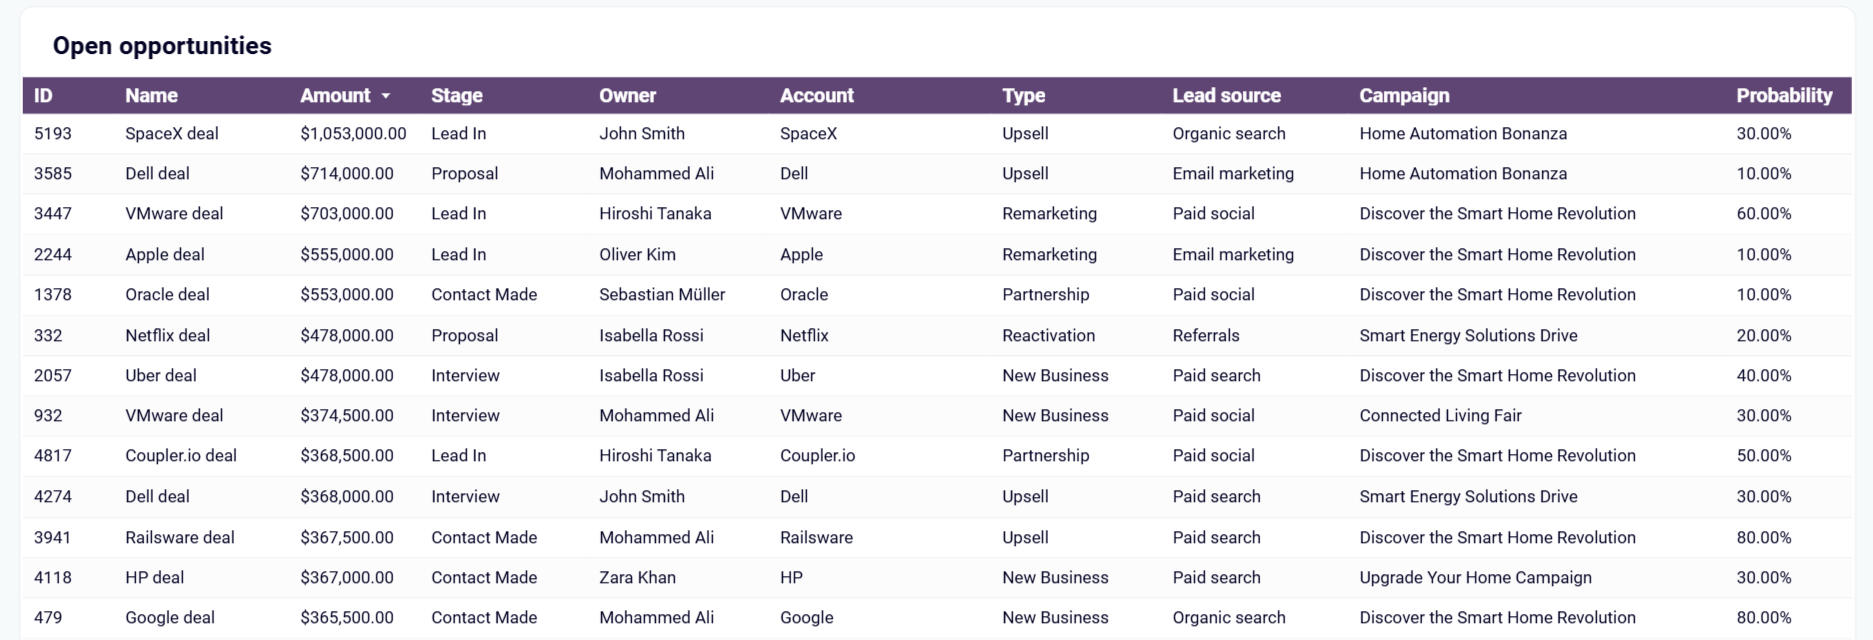
Track opportunities across different stages with detailed breakdowns by owner, type, revenue, and probability to identify bottlenecks and optimize deal flow. The pipeline health visualization reveals where deals commonly stall and which sales representatives need support to move opportunities forward effectively.
How to create a sales CRM dashboard?

Metrics you can track with a sales CRM dashboard template
Track the total number of successfully closed deals across your sales pipeline, with breakdowns by sales representative and time period. This fundamental metric from Salesforce CRM dashboard provides clear visibility into team productivity and helps identify top performers who consistently convert prospects into customers.
Monitor the total monetary value of closed deals to measure actual revenue generation and team performance. Available in Salesforce CRM dashboard, this metric helps assess individual and team contributions to company revenue while identifying which representatives drive the highest value transactions.
Evaluate the likelihood of closing active opportunities based on sales stage and historical conversion patterns. This metric from Salesforce CRM dashboard helps forecast revenue and prioritize sales efforts on deals with the highest success probability for optimal resource allocation.
Track how deals move through your sales process from initial contact to closing, identifying bottlenecks and optimization opportunities. The Salesforce CRM dashboard provides detailed stage analysis that reveals where opportunities commonly stall and require additional attention or process improvements.
Analyze success rates and revenue generation across different opportunity categories to optimize sales strategies. This metric from Pipedrive CRM dashboard helps identify which deal types convert most effectively and generate the highest returns for strategic planning purposes.
Compare individual representative success rates to identify top performers and coaching opportunities across your sales organization. Available in Pipedrive CRM dashboard, this metric enables data-driven team management decisions and helps replicate successful strategies across the entire sales team.
Measure individual sales representative performance across multiple metrics including close rates and revenue generation. This comprehensive metric from Salesforce CRM dashboard provides detailed insights into team member contributions and helps optimize territory assignments and coaching efforts.
Compare projected revenue based on pipeline data against actual closed revenue to measure forecasting reliability. This metric from Salesforce CRM dashboard helps refine probability assignments and stage progression assumptions while building confidence in revenue predictions for business planning.