ROI dashboard examples and reporting templates
Maximize your advertising return on investment with an automated ROI dashboard template that consolidates lead generation data from advertising platforms. Track campaign profitability, monitor cost per lead trends, and identify your most profitable advertising initiatives with real-time insights from your marketing platforms.
ROI dashboards for every need


about your case. It doesn't cost you a penny 😉
Choose your white label ROI dashboard to kick off
What is an ROI dashboard?
ROI dashboards integrate data from advertising platforms like Google Ads, Facebook Ads, and LinkedIn Ads to provide a unified view of campaign performance. This enables marketers to make data-driven budget allocation decisions. With automated data refreshing through Coupler.io, ROI dashboards ensure you always have current information about campaign profitability, lead quality metrics, and spending efficiency without manual data compilation or complex spreadsheet calculations.

What reports should be included in ROI dashboards?
A comprehensive ROI dashboard should incorporate four essential report types that provide complete visibility into your campaign profitability and lead generation effectiveness. Based on our analysis, we recommend including these core reporting components:
The campaign performance report delivers side-by-side analysis of all your advertising initiatives, showing which campaigns generate leads most cost-effectively. This report includes detailed breakdowns of cost per lead, lead conversion rates, total spend, and lead value by campaign. It enables direct comparison between different campaigns across platforms and helps you identify top-performing initiatives that deserve increased budget allocation.
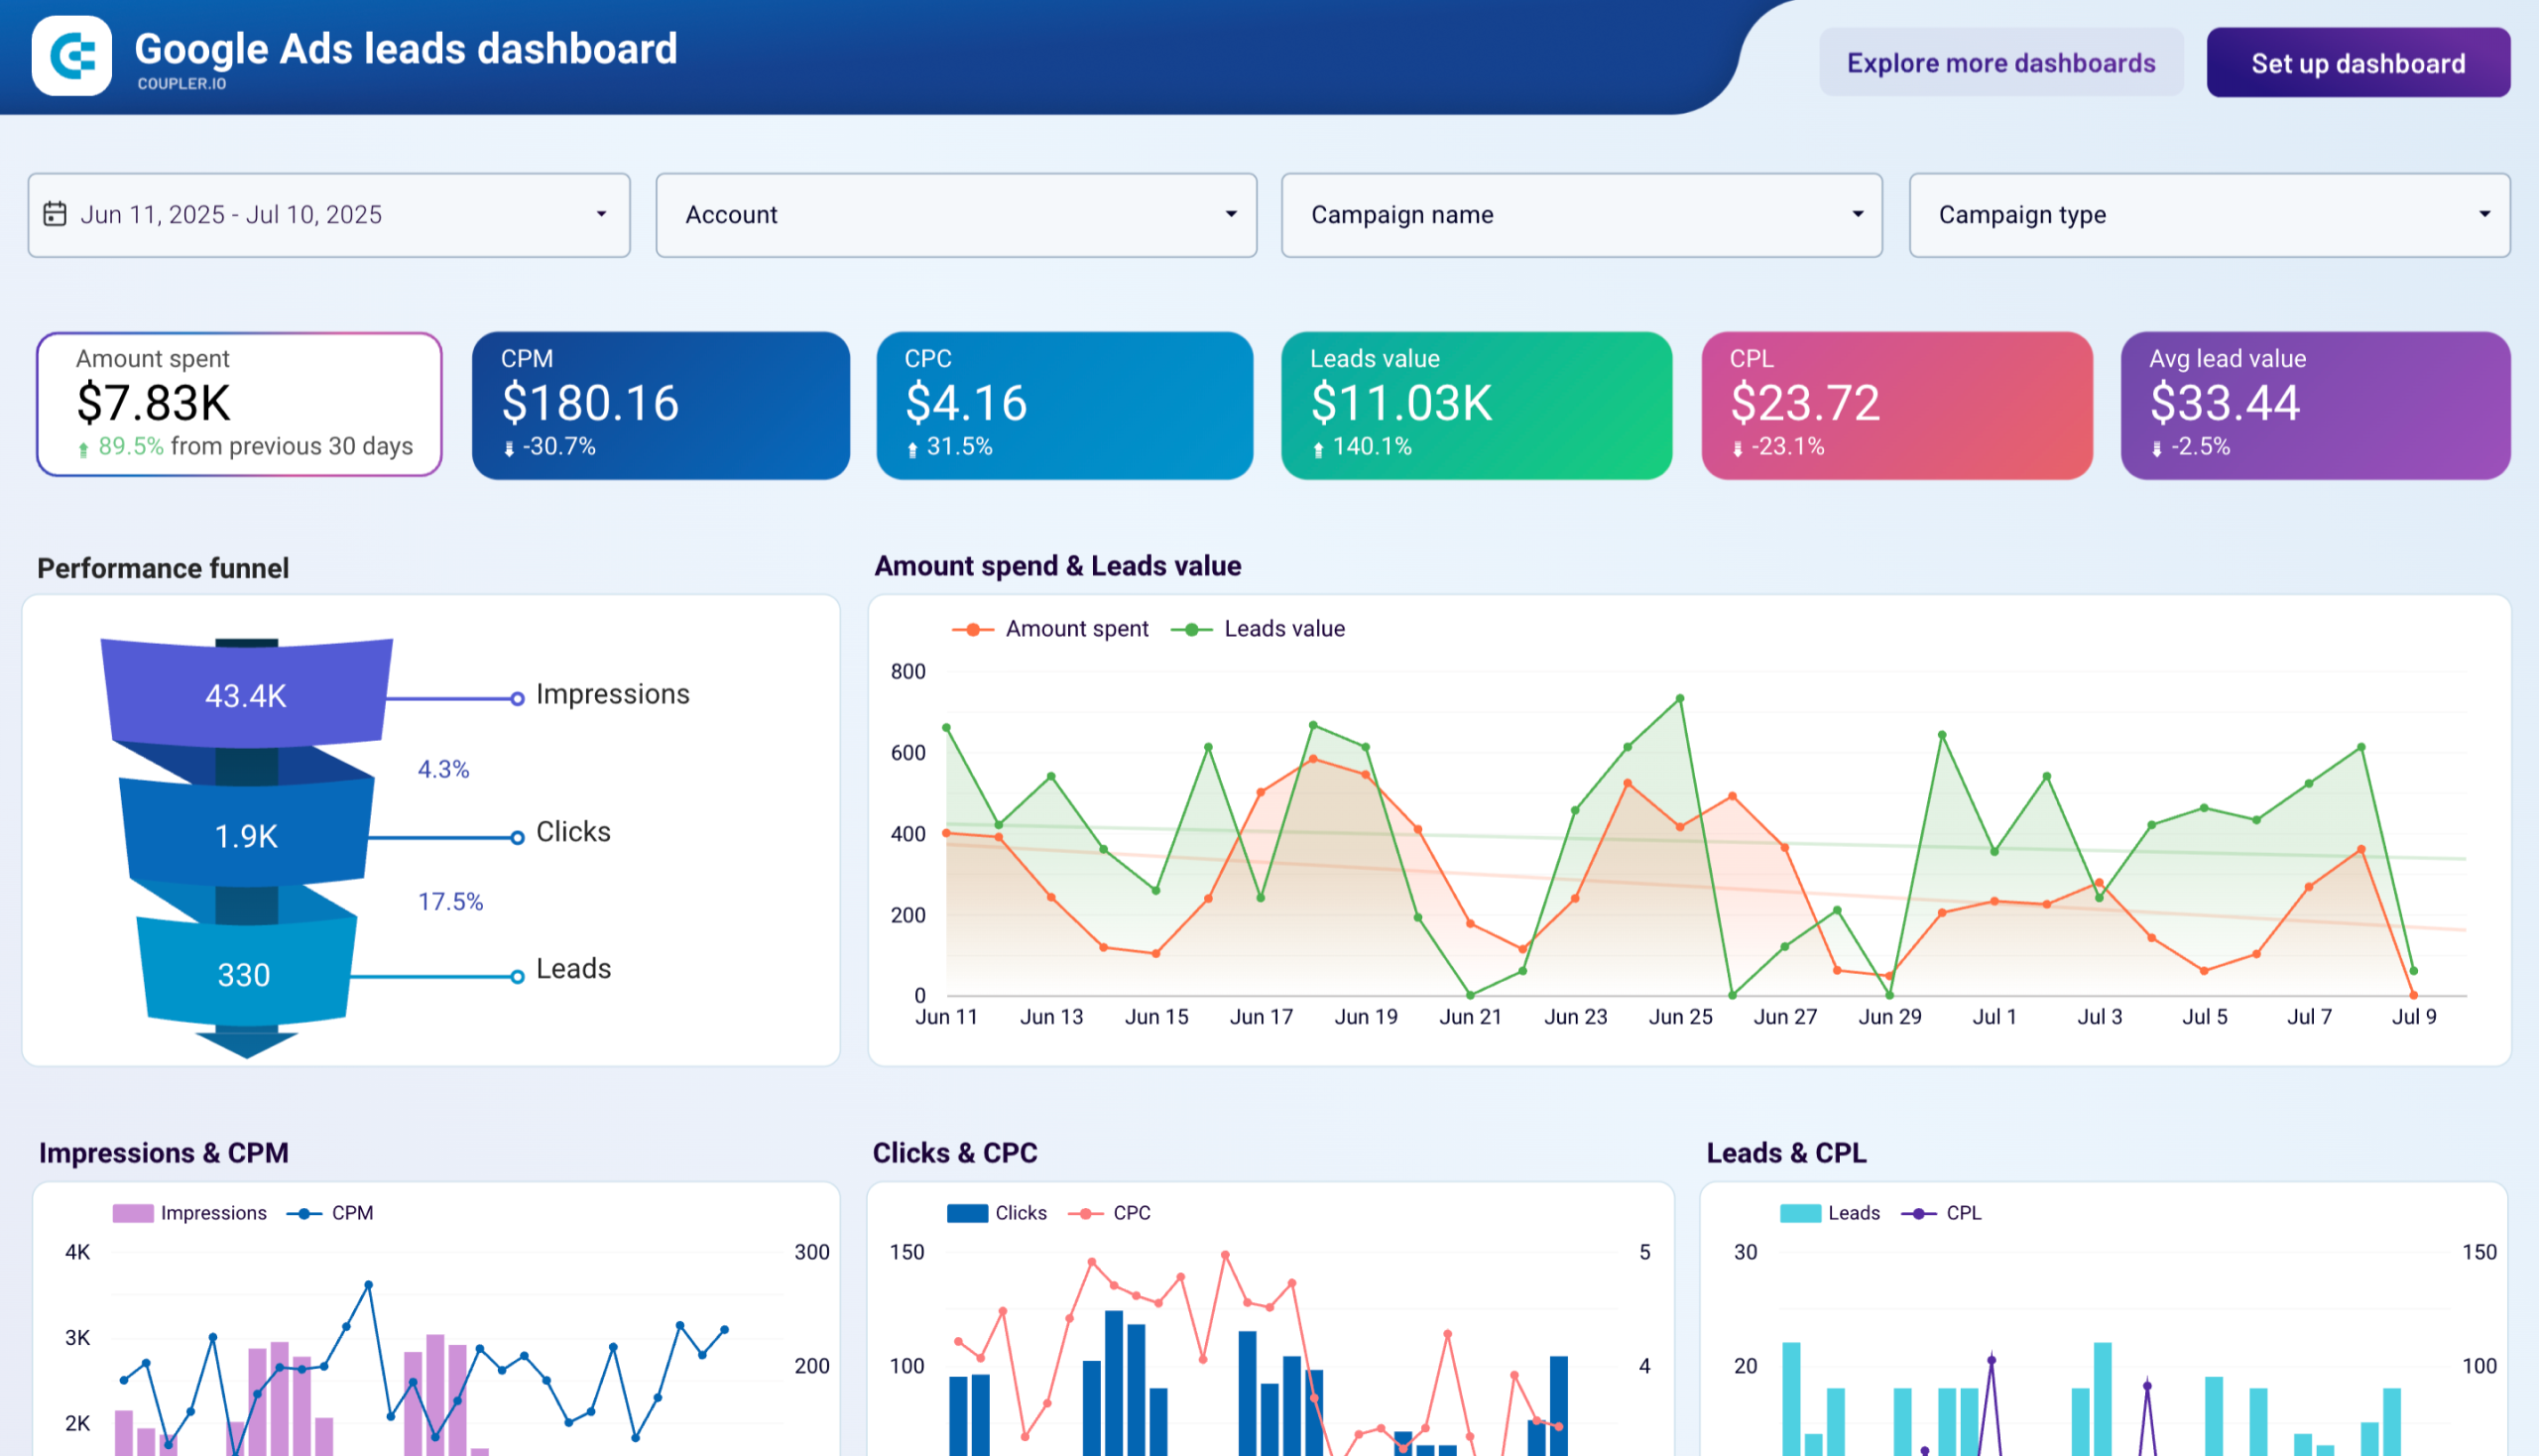
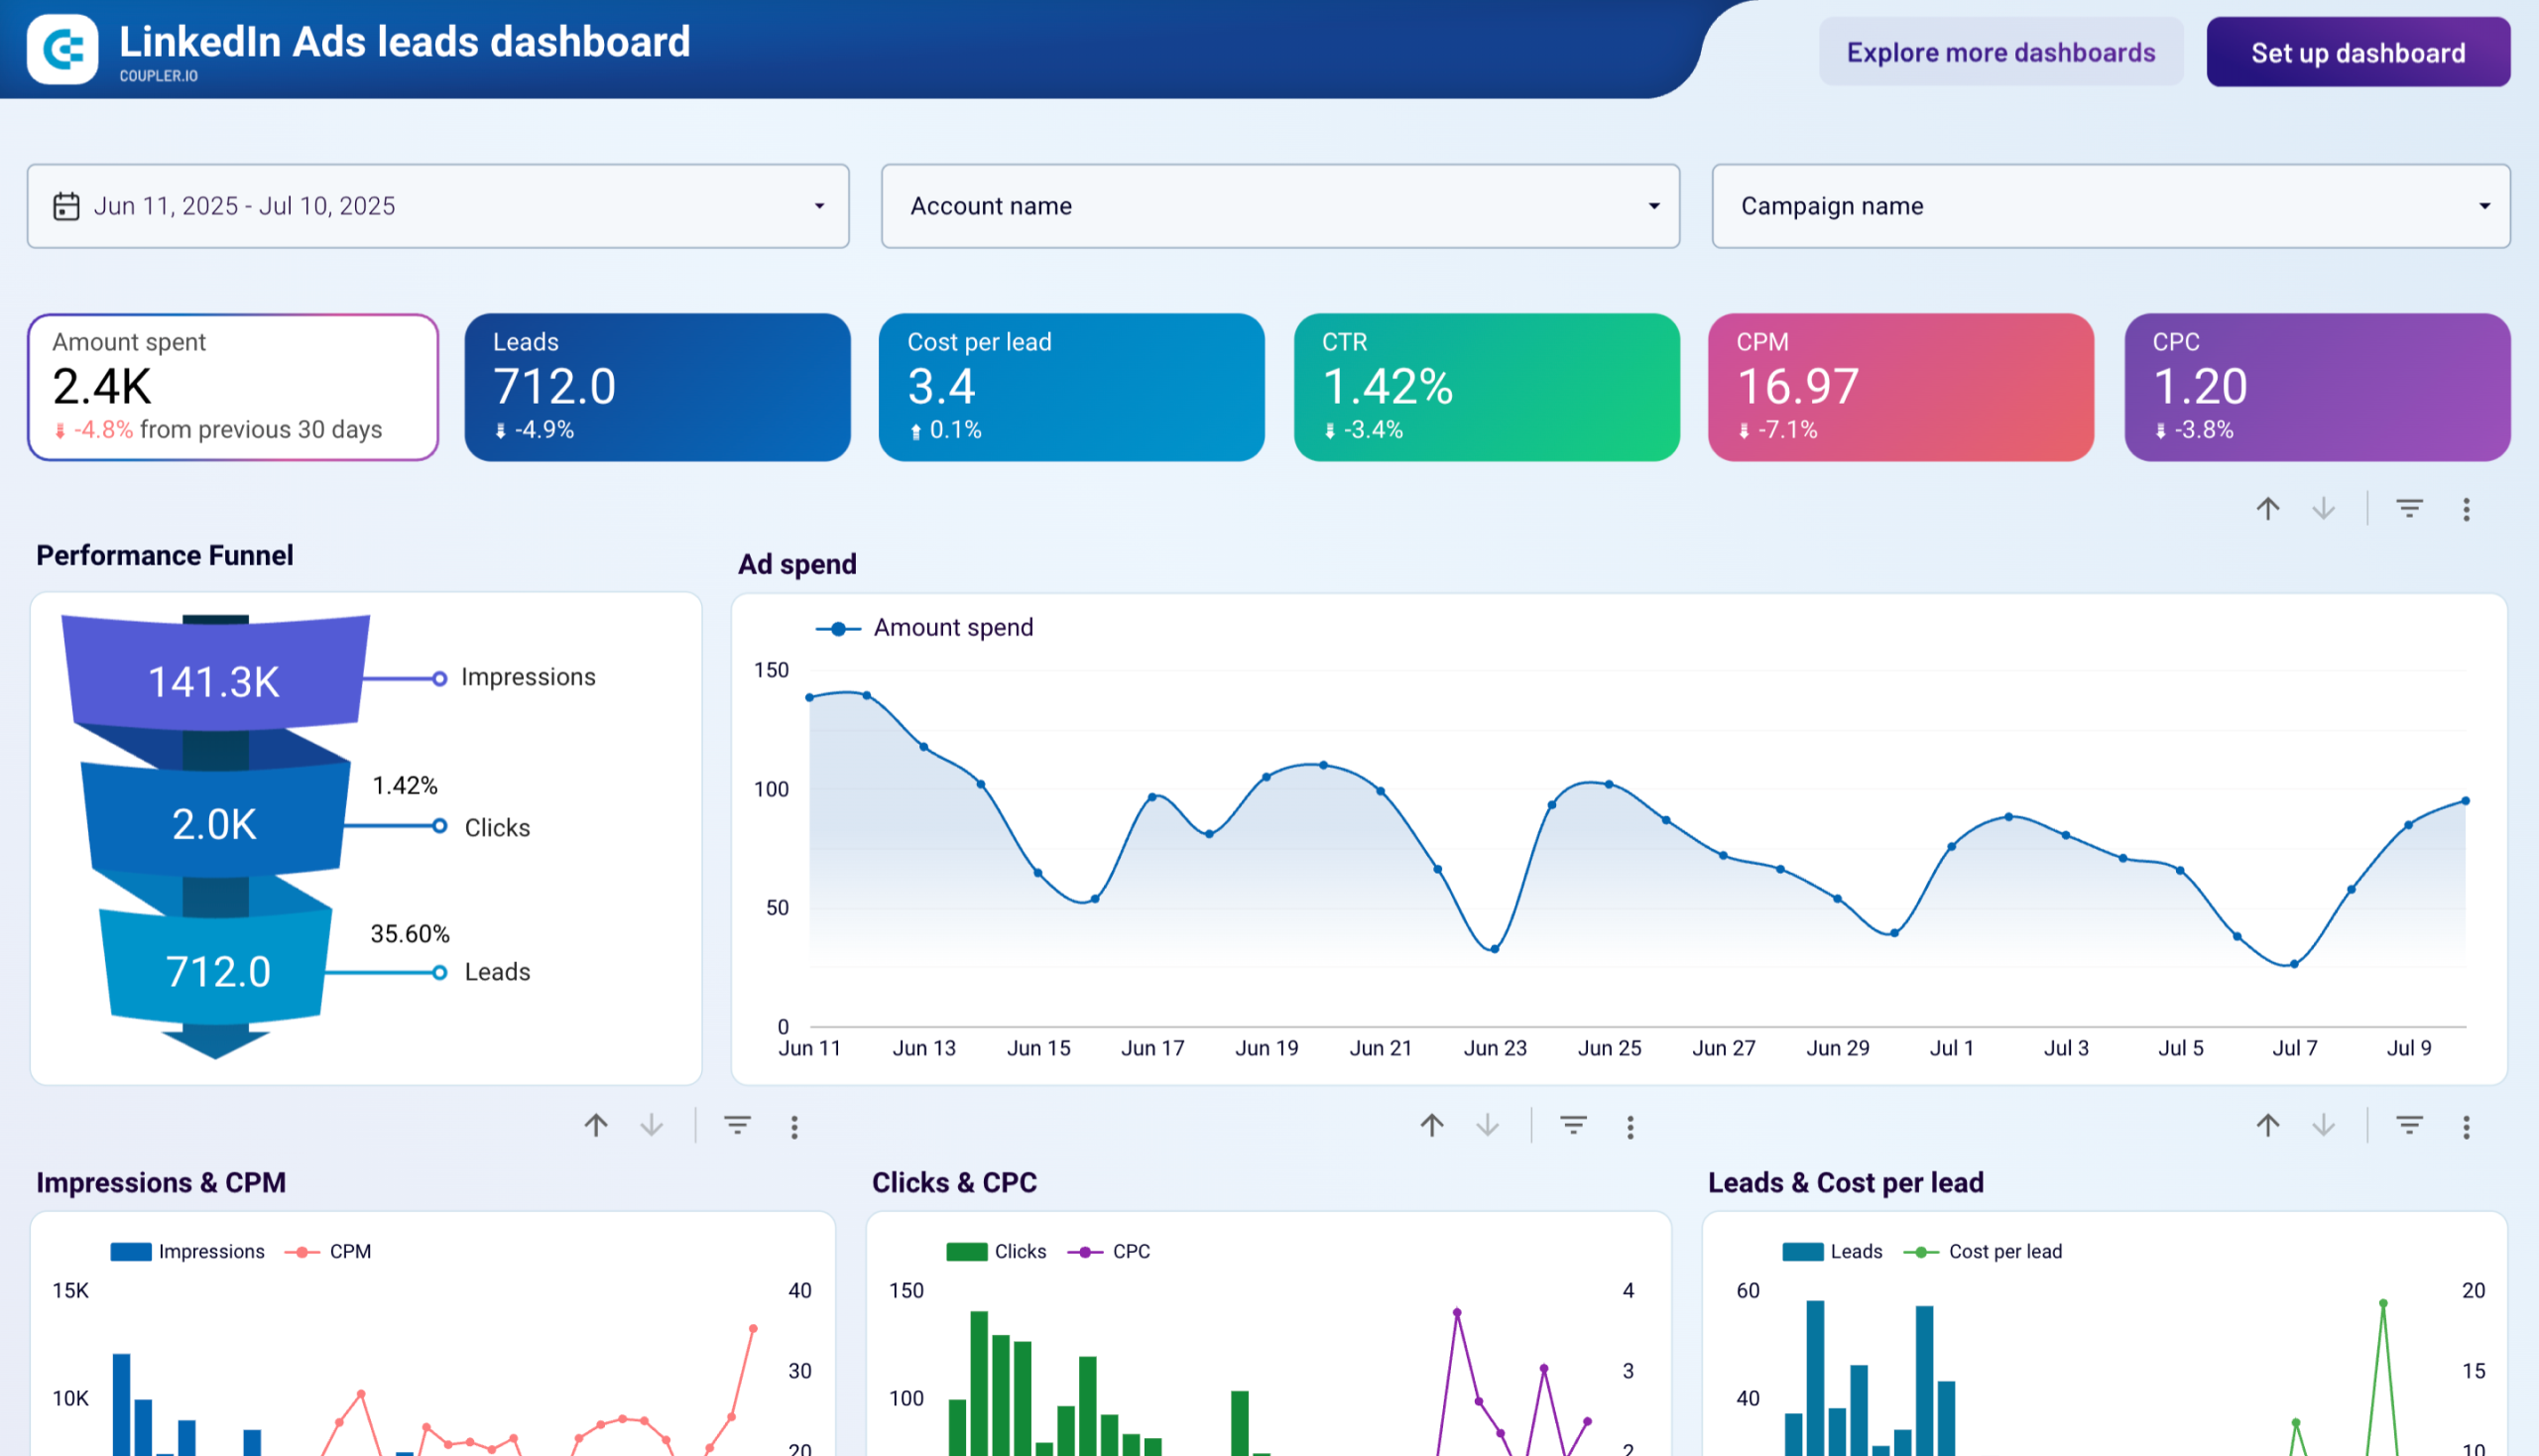
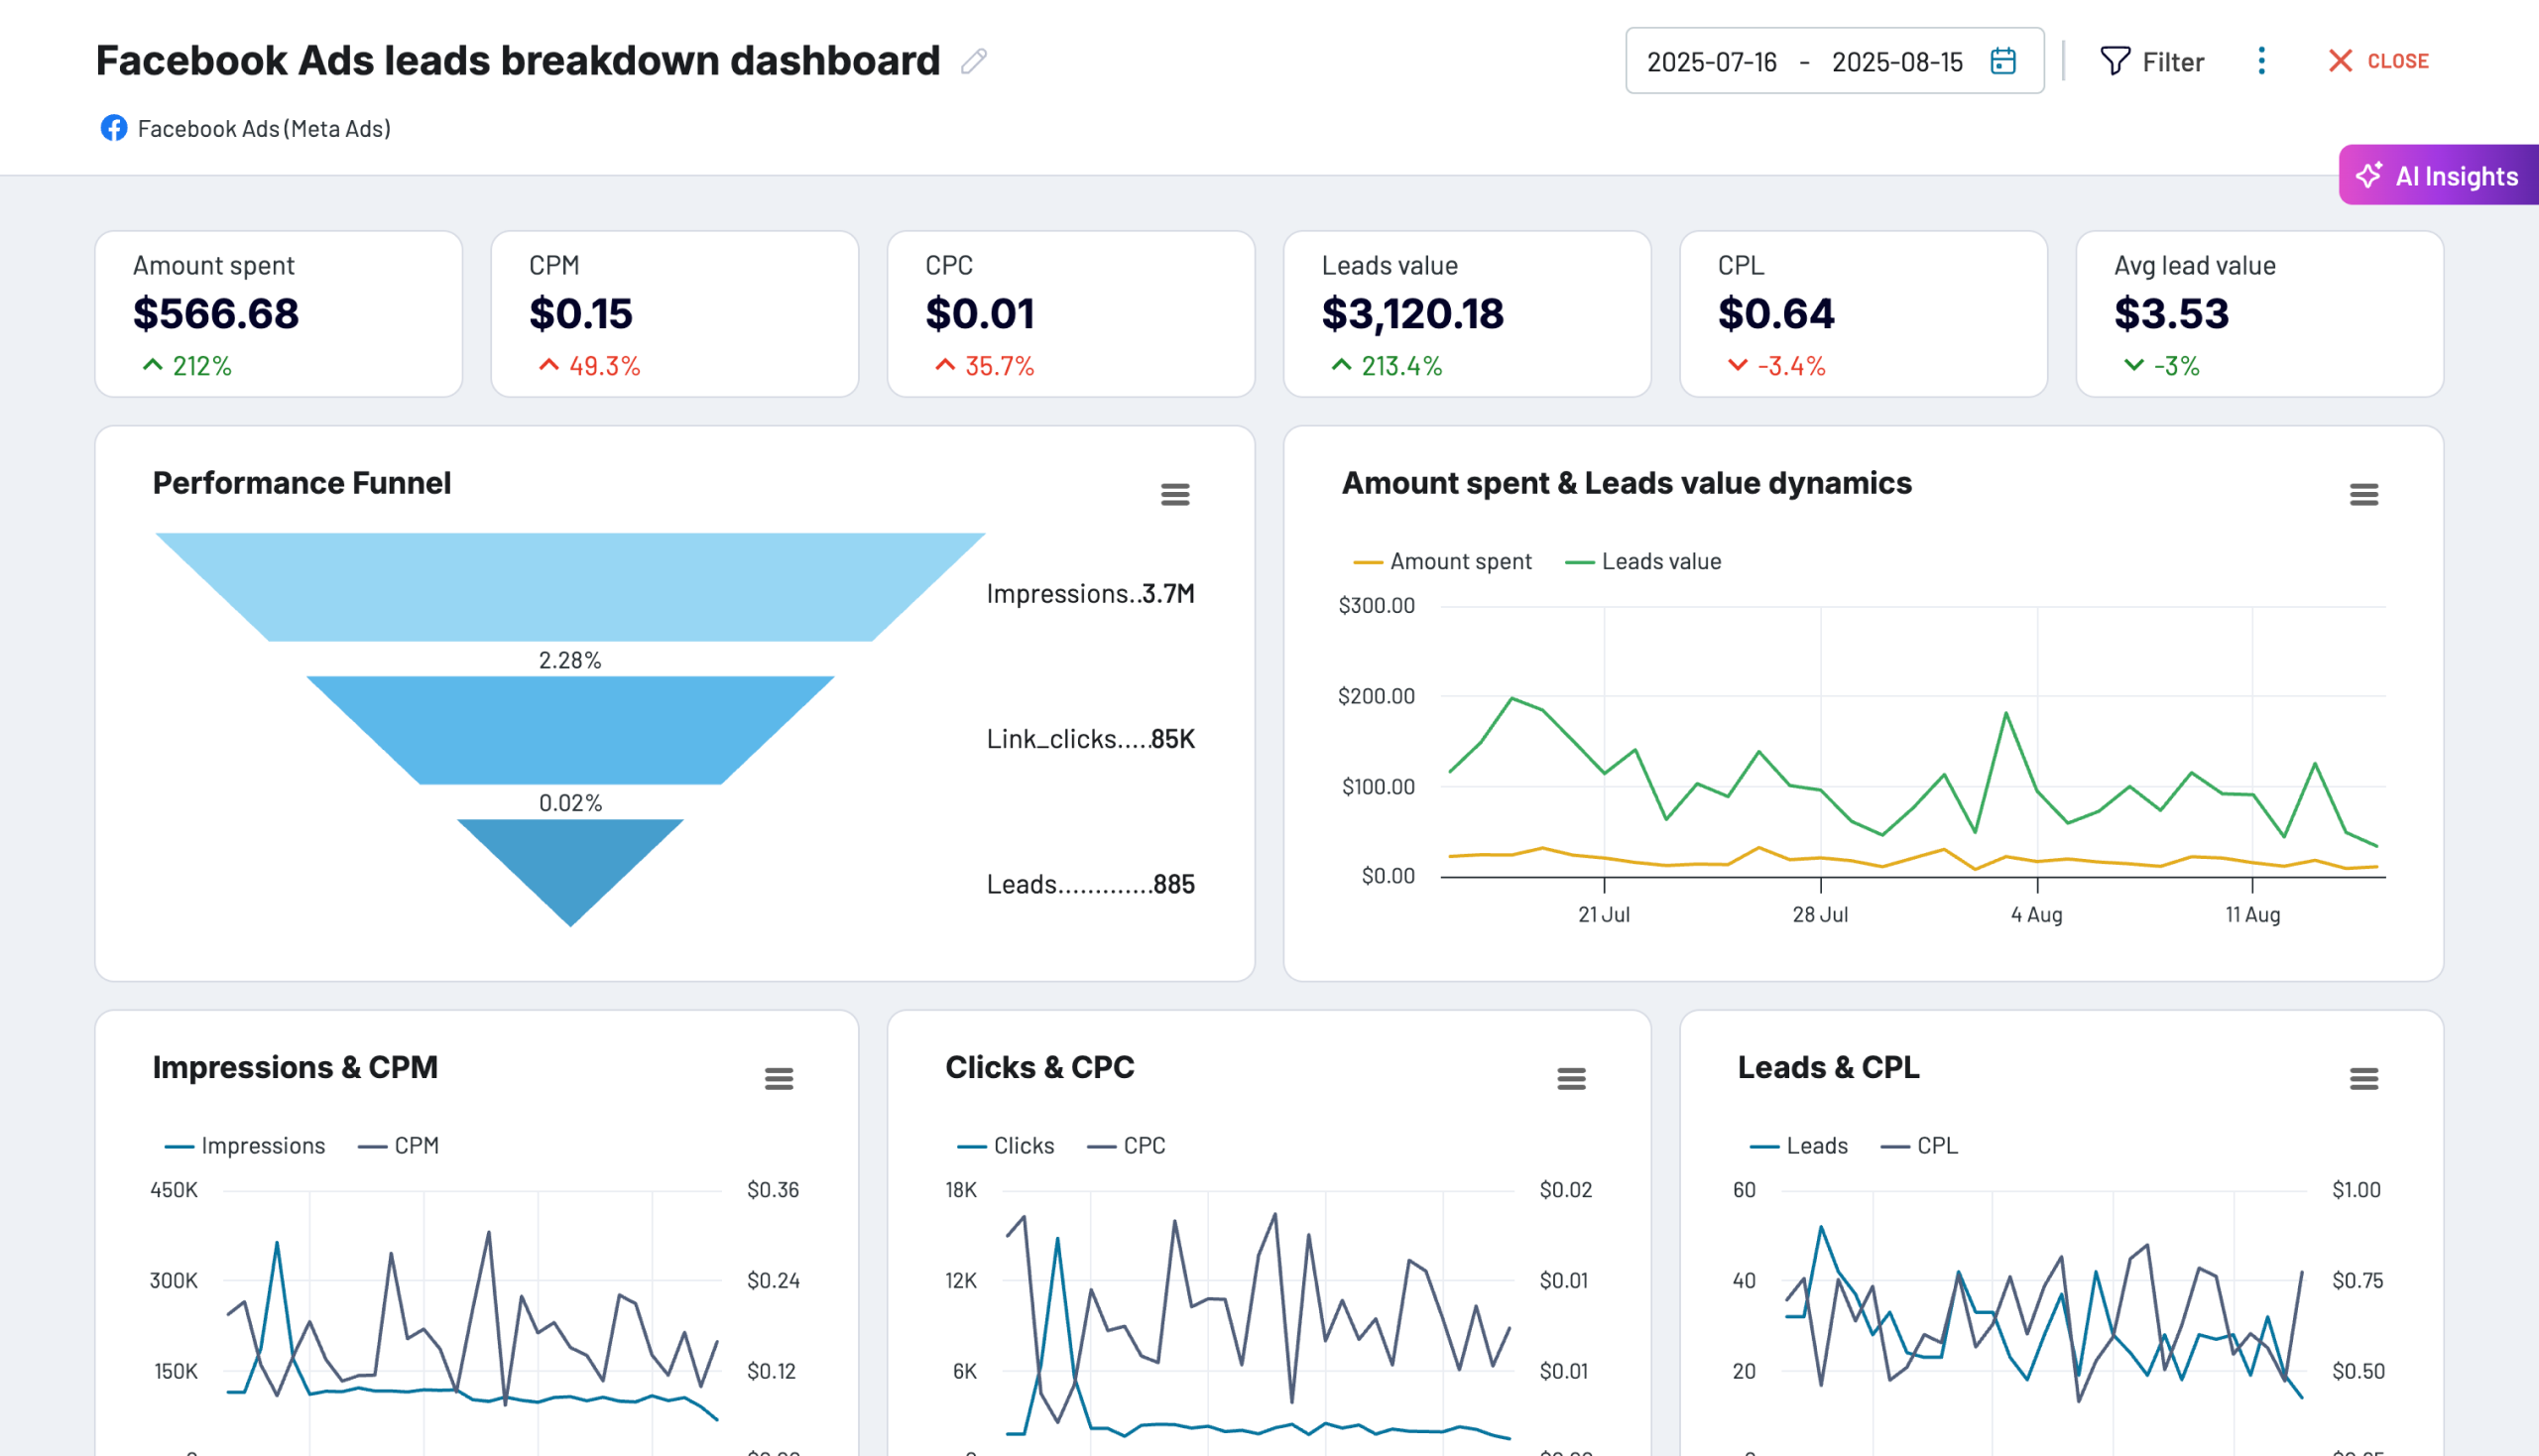
The lead generation funnel report visualizes the complete conversion path from initial ad impressions through clicks to final lead conversions, showing exact conversion rates at each stage. This report identifies bottlenecks in your lead generation process by revealing where prospects drop off most frequently. It displays impression-to-click rates, click-to-lead conversion percentages, and overall funnel efficiency metrics.
The performance correlation report tracks relationships between different advertising metrics through multiple trend analyses, including impressions versus CPM, clicks versus CPC, and leads versus cost per lead over time. This report helps identify patterns and correlations that impact campaign profitability, such as how increased competition affects costs or how impression volume relates to lead quality.
The investment efficiency report analyzes the relationship between daily advertising spend and lead value generation, showing optimal spending patterns and ROI periods. This report tracks when increased spending translates to proportional lead value increases versus when diminishing returns occur. It includes spend-to-value ratios, daily ROI calculations, and identifies periods of highest campaign efficiency.
What insights you can get with the ROI dashboard
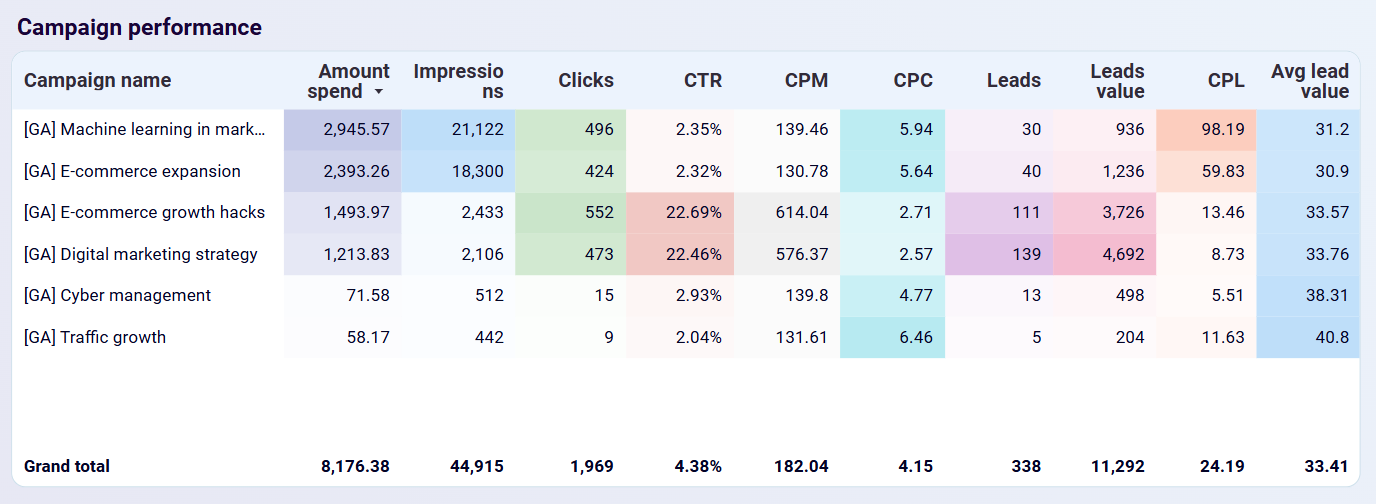
Side-by-side campaign analysis reveals which advertising initiatives deliver leads most cost-effectively across Google Ads, Facebook Ads, and LinkedIn Ads platforms. This insight enables data-driven budget reallocation decisions by identifying campaigns with the lowest cost per lead and highest conversion rates for scaling profitable initiatives.

Detailed visualization of the conversion path from impressions to clicks to leads shows exact conversion rates at each stage, helping identify specific bottlenecks in your lead generation process. This analysis reveals where prospects drop off most frequently, enabling targeted optimizations to landing pages, ad relevance, or targeting strategies.
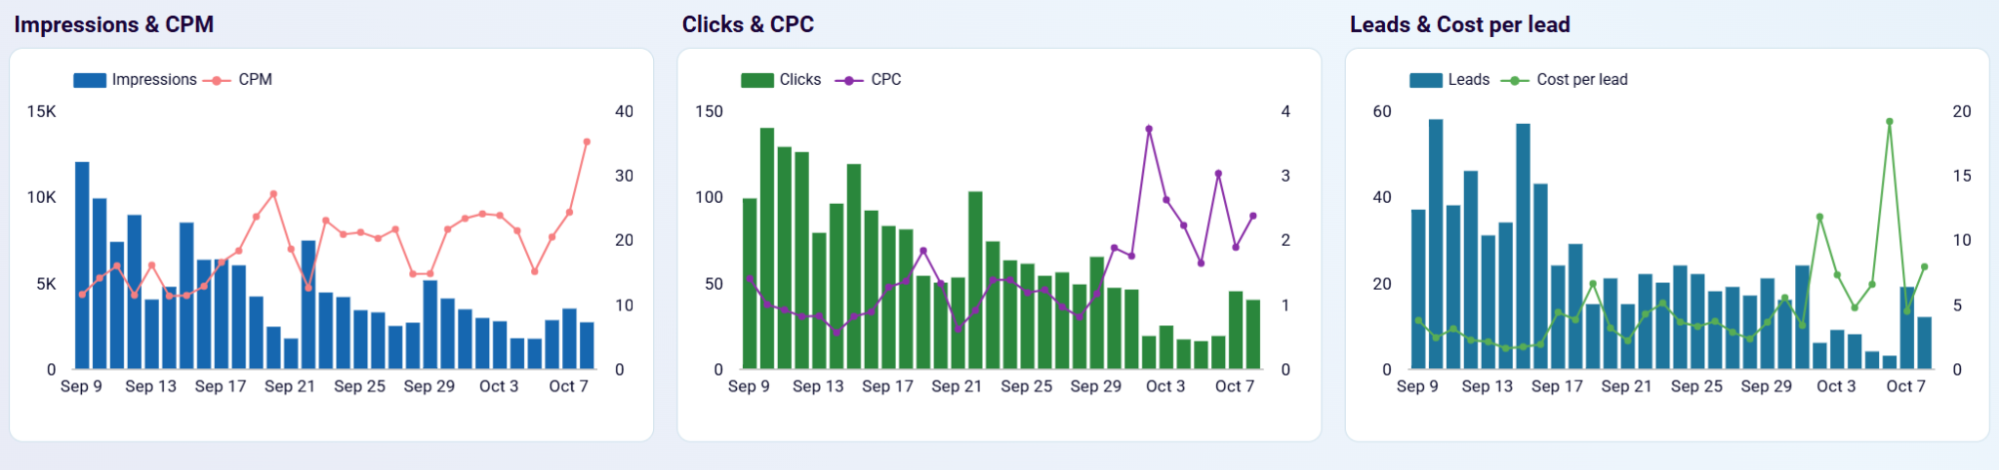
Three interconnected charts tracking impressions/CPM, clicks/CPC, and leads/cost per lead over time reveal performance correlations and patterns that impact campaign profitability. This insight helps optimize bidding strategies by understanding how market competition affects costs and how impression volume relates to lead generation efficiency.

Daily analysis comparing advertising spend with lead value generated identifies optimal spending patterns and periods of highest ROI performance. This insight guides budget allocation timing decisions and prevents overspending during periods when increased investment doesn't translate to proportional lead value increases.
How to create an ROI dashboard?

Metrics you can track with ROI dashboard templates
Monitor the average cost to generate each lead across all your advertising campaigns, with breakdowns by platform and campaign type. ROI dashboard templates track CPL trends over time to identify periods of efficiency and campaigns requiring optimization, enabling better budget allocation decisions.
Track the percentage of clicks that convert into actual leads across your funnel stages, from initial ad impression through final lead submission. This metric helps identify bottlenecks in your conversion process and optimize landing pages or ad messaging for improved performance.
Measure the average monetary value assigned to leads generated from different campaigns and platforms, helping prioritize high-value lead sources. ROI dashboards track both individual lead values and total lead value generated to assess campaign profitability beyond just volume metrics.
Calculate the revenue generated for every dollar spent on advertising by comparing lead value against campaign costs. This fundamental ROI metric helps determine which campaigns deliver positive returns and deserve increased investment versus those requiring optimization or pause.
Analyze the relationship between advertising spend and lead generation volume to identify optimal spending levels for each campaign. This metric reveals diminishing returns thresholds and helps prevent overspending while maintaining lead generation targets.
Track the overall efficiency of your advertising funnel by measuring what percentage of ad impressions ultimately convert into qualified leads. This comprehensive metric combines reach effectiveness with conversion optimization to show true campaign performance.
Monitor day-by-day return on investment patterns to identify optimal times for campaign launches, budget increases, or promotional pushes. ROI dashboard templates reveal seasonal patterns and timing opportunities that maximize campaign profitability.
Compare lead generation costs and conversion rates across Google Ads, Facebook Ads, and LinkedIn Ads to identify which platforms deliver the best return for your specific business goals. This cross-platform analysis guides strategic budget allocation decisions.