Quora Ads dashboard examples and reporting templates
Transform your Quora advertising data into actionable insights with customizable dashboards designed for strategic decision-making. Our Quora Ads reporting dashboards eliminate the limitations of native analytics by consolidating campaign data, budget allocation, and lead generation metrics in one place. Stop jumping between platforms and start optimizing your ad spend with automated reporting that reveals what's actually working in your Quora advertising strategy.
Examples of Quora Ads dashboards for every need


 +3
+3


 +3
+3
 +4
+4
 +4
+4

 +2
+2

 +2
+2

 +5
+5

 +4
+4
 +5
+5
 +5
+5
 +3
+3
 +1
+1
 +3
+3
 +2
+2

 +4
+4


about your case. It doesn't cost you a penny 😉
Choose your white label Quora Ads dashboard to kick off
What is a Quora Ads dashboard?
What sets a proper Quora Ads reporting dashboard apart is its ability to connect your advertising efforts with actual business outcomes. Rather than just tracking basic metrics, these dashboards monitor lead generation funnels, compare campaign effectiveness, forecast budget utilization, and highlight spending patterns across time periods. By automating data refresh through Coupler.io, you eliminate manual exports and ensure you're always working with current information. This creates a reliable foundation for optimizing your Quora ad performance alongside other marketing channels, helping you allocate resources where they generate the strongest returns.

What reports should be included on a meaningful Quora Ads dashboard?
A comprehensive LinkedIn ads dashboard should include several key reports that provide complete visibility into your advertising performance. Based on our analysis of effective LinkedIn advertising dashboards, we recommend incorporating these four essential report types:
The campaign performance report offers an overview of key advertising metrics filtered by account, campaign, or campaign objective. This report tracks essential PPC metrics such as impressions, clicks, cost per click (CPC), click-through rate (CTR), and amount spent. The daily and weekly progress visualizations show performance trends over time, helping you identify successful campaigns and opportunities for optimization. This foundation report is essential for understanding your advertising effectiveness and making informed adjustments to your strategy.
The lead generation report focuses on tracking conversions and lead acquisition through your Quora advertising efforts. It features scorecards showing total leads generated and average cost per lead, alongside daily dynamics of lead generation for the selected period. The conversion funnel visualization displays multiple stages of the marketing funnel and their daily performance, allowing you to identify drop-offs and opportunities for improvement. This report is vital for evaluating your advertising ROI and understanding how effectively your campaigns attract potential customers.
The multichannel PPC report consolidates advertising data across platforms including Quora Ads, Google Ads, Facebook Ads, LinkedIn Ads, and others. It visualizes spending patterns by date and source, helping you identify which channels deliver the best results for your budget. The report includes interactive charts showing clicks, impressions, CTR, and other key metrics per platform, enabling cross-channel performance comparison. This comprehensive view allows you to optimize your advertising mix and allocate resources where they generate the strongest returns.
The budget forecast report provides detailed tracking of your advertising spend with predictive analytics to help avoid overspending. It shows your current month's budget status with breakdowns by platform, including allocated budget, amount spent to date, daily spending rate, and predicted total spend. Color-coded alerts indicate when campaigns are at risk of exceeding budgets, while monthly comparison charts reveal seasonal patterns and spending trends. This forward-looking report is crucial for maintaining financial control while maximizing advertising impact across platforms.
What insights you can get with the Quora Ads reporting dashboard
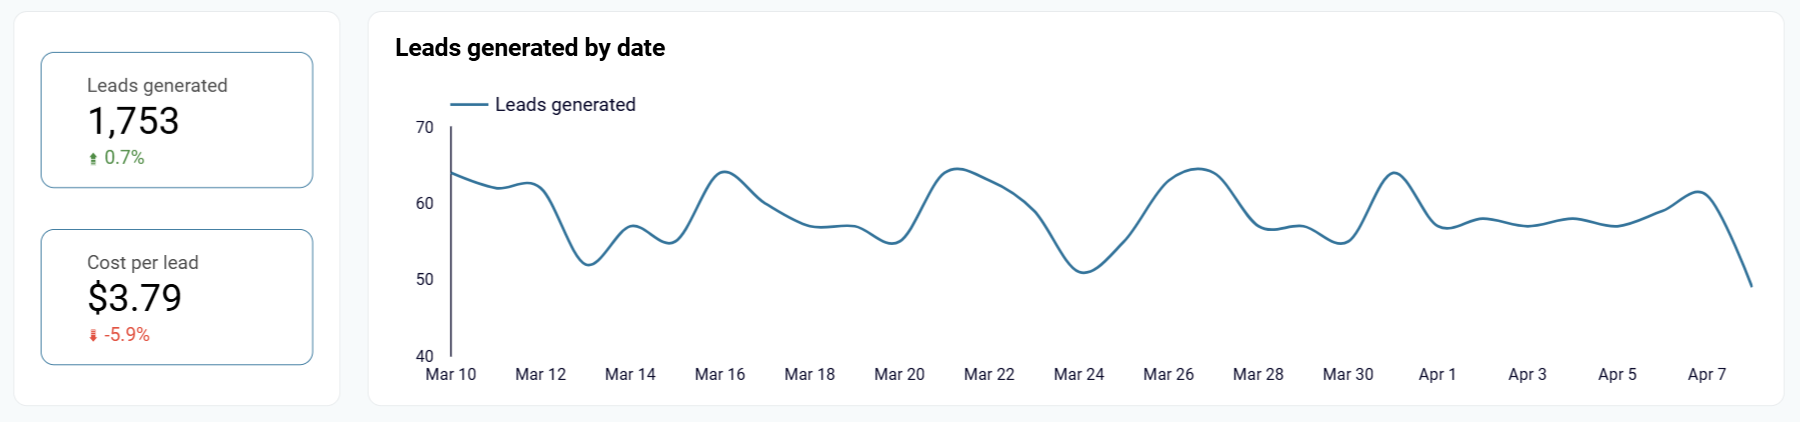
The Quora ads dashboard provides a dedicated section for tracking lead generation dynamics, including total leads generated and cost per lead. With daily dynamics visualized in a line chart, you can identify patterns, peak periods, and correlate lead generation with specific campaigns or content types. This insight is crucial for optimizing conversion strategies and improving ROI on your Quora advertising investments.
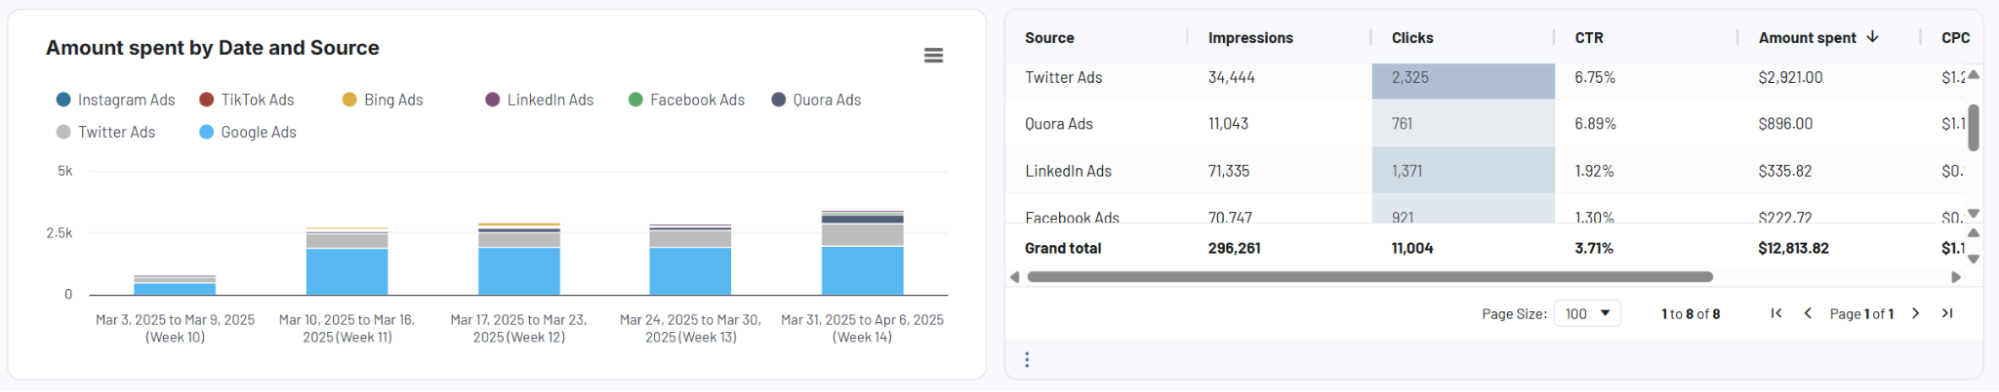
The multichannel PPC dashboard visualizes spending patterns across all your advertising platforms, including Quora Ads. Interactive charts display daily and monthly spending trends, allowing you to compare budget allocation across different channels and campaign types. This comprehensive view helps identify which platforms deliver the best cost efficiency and where budget adjustments might improve overall performance.
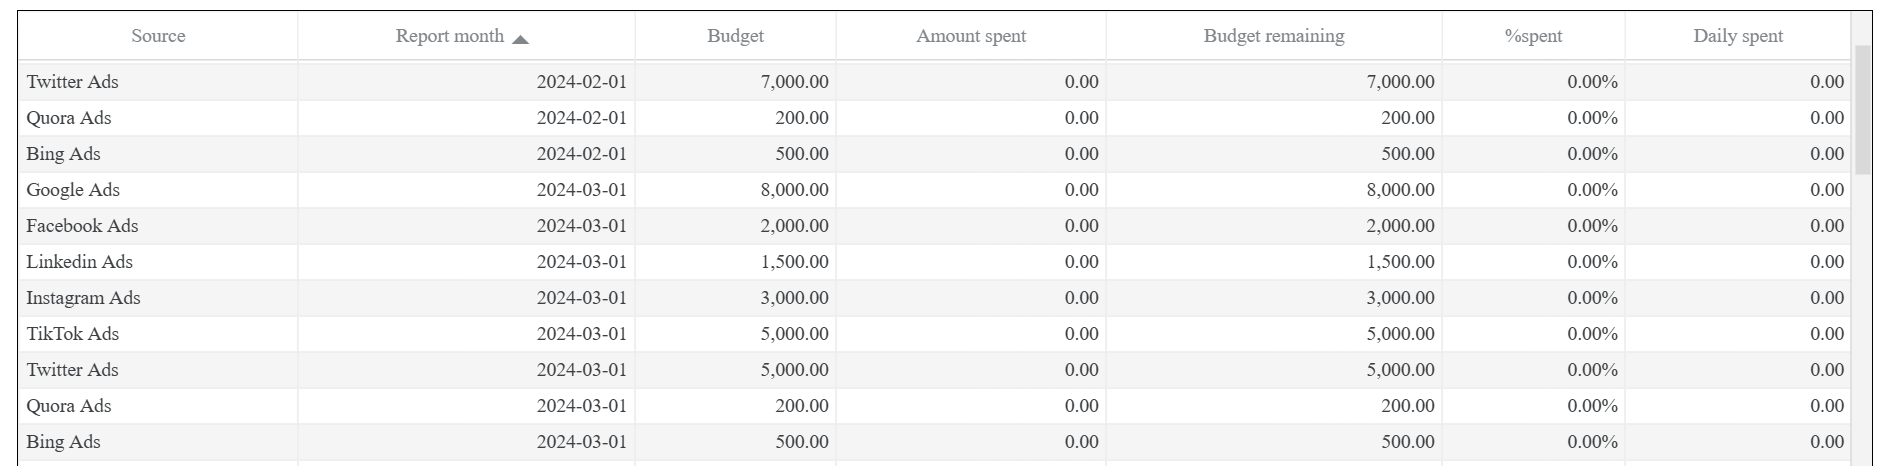
The monthly budget dashboard provides a detailed breakdown of your advertising spend across all platforms, including Quora Ads. The report clearly displays allocated budgets against actual spending, highlighting variances and trends. This insight helps prevent budget overruns and enables strategic reallocation of funds between platforms based on performance data rather than assumptions.
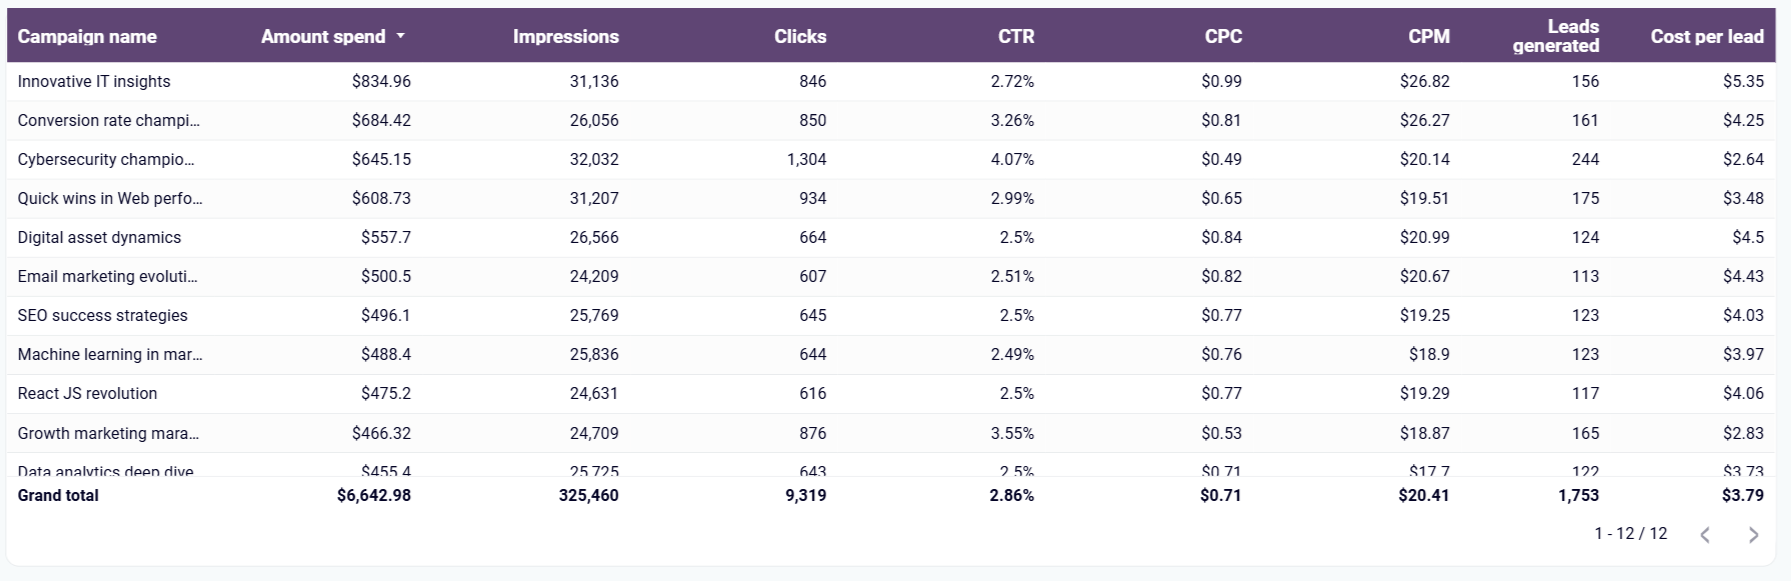
The campaign comparison table presents a comprehensive breakdown of all Quora ad campaigns by key metrics such as amount spent, leads generated, and cost per click. This side-by-side analysis makes it easy to identify top-performing campaigns and underperforming ones that need optimization. The visual format simplifies complex data, enabling quick decision-making about which campaign strategies to scale or revise.
How to create a Quora Ads dashboard?

Metrics you can track with a Quora Ads dashboard template
Track the total number of times your ads were shown to Quora users. This visibility metric helps you understand your advertising reach and brand exposure. By monitoring impressions over time, you can identify trends, measure the impact of campaign adjustments, and gauge the overall awareness your ads are generating within your target audience.
Measure how many times users clicked on your Quora ads. This engagement metric indicates user interest in your offering and the effectiveness of your ad creative. Tracking clicks across different campaigns helps you identify which messaging, visuals, or targeting strategies resonate most with your audience, allowing for data-driven creative optimization.
Monitor the percentage of impressions that result in clicks. CTR serves as a key performance indicator for ad relevance and appeal. A rising CTR suggests your ads are becoming more engaging to your target audience, while a declining rate may indicate ad fatigue or targeting issues that need addressing for campaign health.
Analyze how much you're paying for each click on your Quora ads. This efficiency metric helps you evaluate the financial performance of your campaigns. By comparing CPC across different ad sets and time periods, you can optimize bidding strategies and allocate budget to the most cost-effective targeting options.
Track the percentage of users who completed a desired action after clicking your ad. This effectiveness metric directly connects your ad spend to business outcomes. Monitoring conversion rates helps you identify which campaigns are driving meaningful results beyond clicks, enabling you to focus resources on strategies that drive actual business growth.
Measure how much you spend to acquire each conversion. This ROI metric helps evaluate the economic efficiency of your campaigns. By tracking cost per conversion across different ad sets and campaigns, you can identify the most cost-effective approaches and allocate budget to maximize return on advertising spend.
Count the number of potential customers acquired through your Quora ads. This acquisition metric directly ties advertising to your sales pipeline. Tracking leads generated helps you understand the tangible business impact of your campaigns and provides a clear measure of how effectively your Quora ads contribute to business development.
Calculate the average amount spent to acquire each lead. This efficiency metric helps evaluate lead generation economics. By monitoring average cost per lead over time and across campaigns, you can identify optimal targeting strategies, refine audience segments, and implement the most cost-effective approaches to building your prospect database.
Measure the percentage of allocated budget actually spent during a given period. This financial management metric helps prevent underinvestment and budget waste. Tracking utilization rates across platforms enables you to identify spending inefficiencies, reallocate resources to high-performing channels, and ensure your advertising budget is fully optimized.
Project future advertising expenditure based on current spending patterns. This predictive metric helps with budget planning and spend control. By monitoring forecasted spend against allocated budgets, you can make proactive adjustments to campaign settings before overspending occurs, maintaining financial discipline while maximizing advertising impact.