Paid search dashboard examples and reporting templates
Optimize your search advertising with automated paid search dashboard templates that consolidate Google Search Ads performance, branded search visibility, and organic search type data. Monitor ad effectiveness, compare paid versus organic engagement, and identify traffic sources across Web, Image, Video, and Discover search—all from centralized reporting templates connected through Coupler.io.
Paid search dashboard examples for every need


about your case. It doesn't cost you a penny 😉
Choose your white label paid search dashboard template to kick off
What is a paid search dashboard?
The dashboard eliminates manual data collection by automatically consolidating ad performance tracking, branded search analysis, and search type breakdowns into actionable reports. With Coupler.io handling data refresh on a schedule, you maintain up-to-date insights into how your search advertising performs across different Google search types—from traditional web results to image, video, and discovery placements. This creates a complete picture of your search marketing effectiveness without switching between multiple platforms.

What reports should be included in paid search dashboards?
To make your paid search dashboards efficient, use three distinct reporting areas that address different aspects of search advertising performance. These reports work together to optimize ad spending, understand brand search impact, and identify untapped traffic opportunities across Google's search ecosystem.
This report consolidates performance metrics across all search ads while providing integrated tools for ad optimization. It displays impressions, clicks, CTR, and conversions for campaigns and ad groups, allowing you to spot underperforming ads with low engagement rates. The built-in editing functionality includes real-time character count tracking to ensure headlines and descriptions meet Google's requirements while you create multiple ad variations. When seasonal promotions require updating 50+ ads simultaneously, the report structures all changes in the correct format for direct upload to Google Ads Editor. This eliminates the toggle between performance analysis and ad management, as you can filter specific campaigns, review their metrics, update ad copy, and export ready-to-upload files within a single workflow.
Understanding how paid campaigns influence organic brand searches requires comparing ad spend against organic engagement patterns. This report tracks the relationship between advertising investment and branded search CTR over time, revealing whether paid campaigns successfully drive awareness that translates into organic searches. The visualization combines ad spend data with organic click-through rates to identify correlation patterns—if organic CTR improves alongside increased ad spend, your paid efforts are strengthening brand recognition. Click distribution charts show what percentage of total brand traffic comes from paid versus organic channels, while detailed performance tables break down metrics like impressions, clicks, and CTR for both sources. This side-by-side comparison helps assess whether your paid campaigns generate enough incremental value to justify continued investment or if organic brand strength can support reduced ad spending.
Traffic sources in Google Search extend beyond traditional web results to include image, video, news, and discover placements. This report identifies all search types sending visitors to your site without requiring manual filter application in Search Console. The breakdown displays performance metrics for each search type—impressions, clicks, CTR, and average position—across your entire site or filtered by specific pages. For content-heavy sections, you can analyze whether visual elements generate image search traffic, or if video content appears in video search results. Page-level filtering reveals which landing pages perform best in specific search types, guiding content optimization decisions. If product pages receive significant image search traffic but low CTR, improving image quality and alt text becomes a clear priority.
What insights you can get with a paid search reporting dashboard
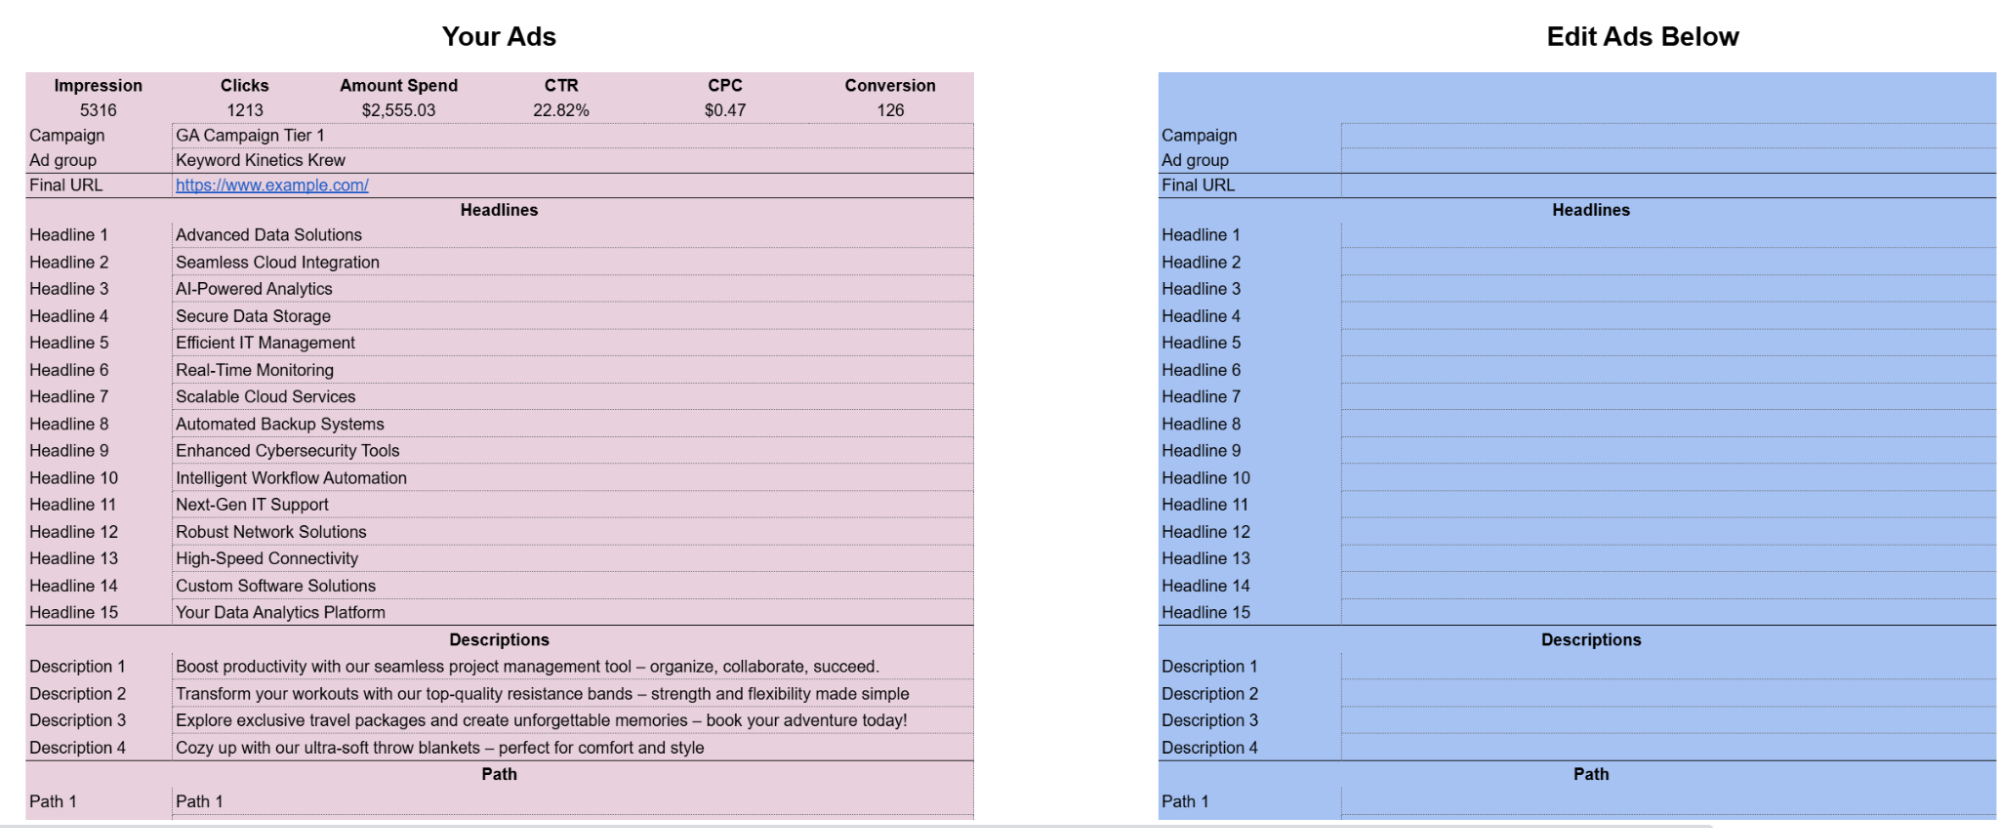
The performance tracking report consolidates metrics across campaigns and ad groups while providing side-by-side editing capabilities with character limit guidance. You can identify ads with CTR below 1% that need immediate attention, then use the built-in editor to rewrite headlines and descriptions while ensuring they meet Google's formatting requirements. The real-time character count prevents errors before export, and all edits are automatically structured for direct upload to Google Ads Editor through Coupler.io connectivity. This eliminates workflow interruptions—you move directly from analyzing underperforming ads to creating optimized variations ready for deployment.

This visualization combines your advertising investment with organic CTR trends to reveal how paid campaigns influence brand search behavior. When ad spend increases and organic CTR rises in parallel, your paid efforts are successfully building brand awareness that drives unpaid searches. The report shows both immediate and delayed effects—brand recognition often takes weeks to manifest in organic search patterns. You can identify whether paid campaigns deliver enough incremental brand value to justify continued spending, or if strong organic performance allows budget reallocation. The correlation analysis guides strategic decisions about balancing paid advertising with organic brand strength.
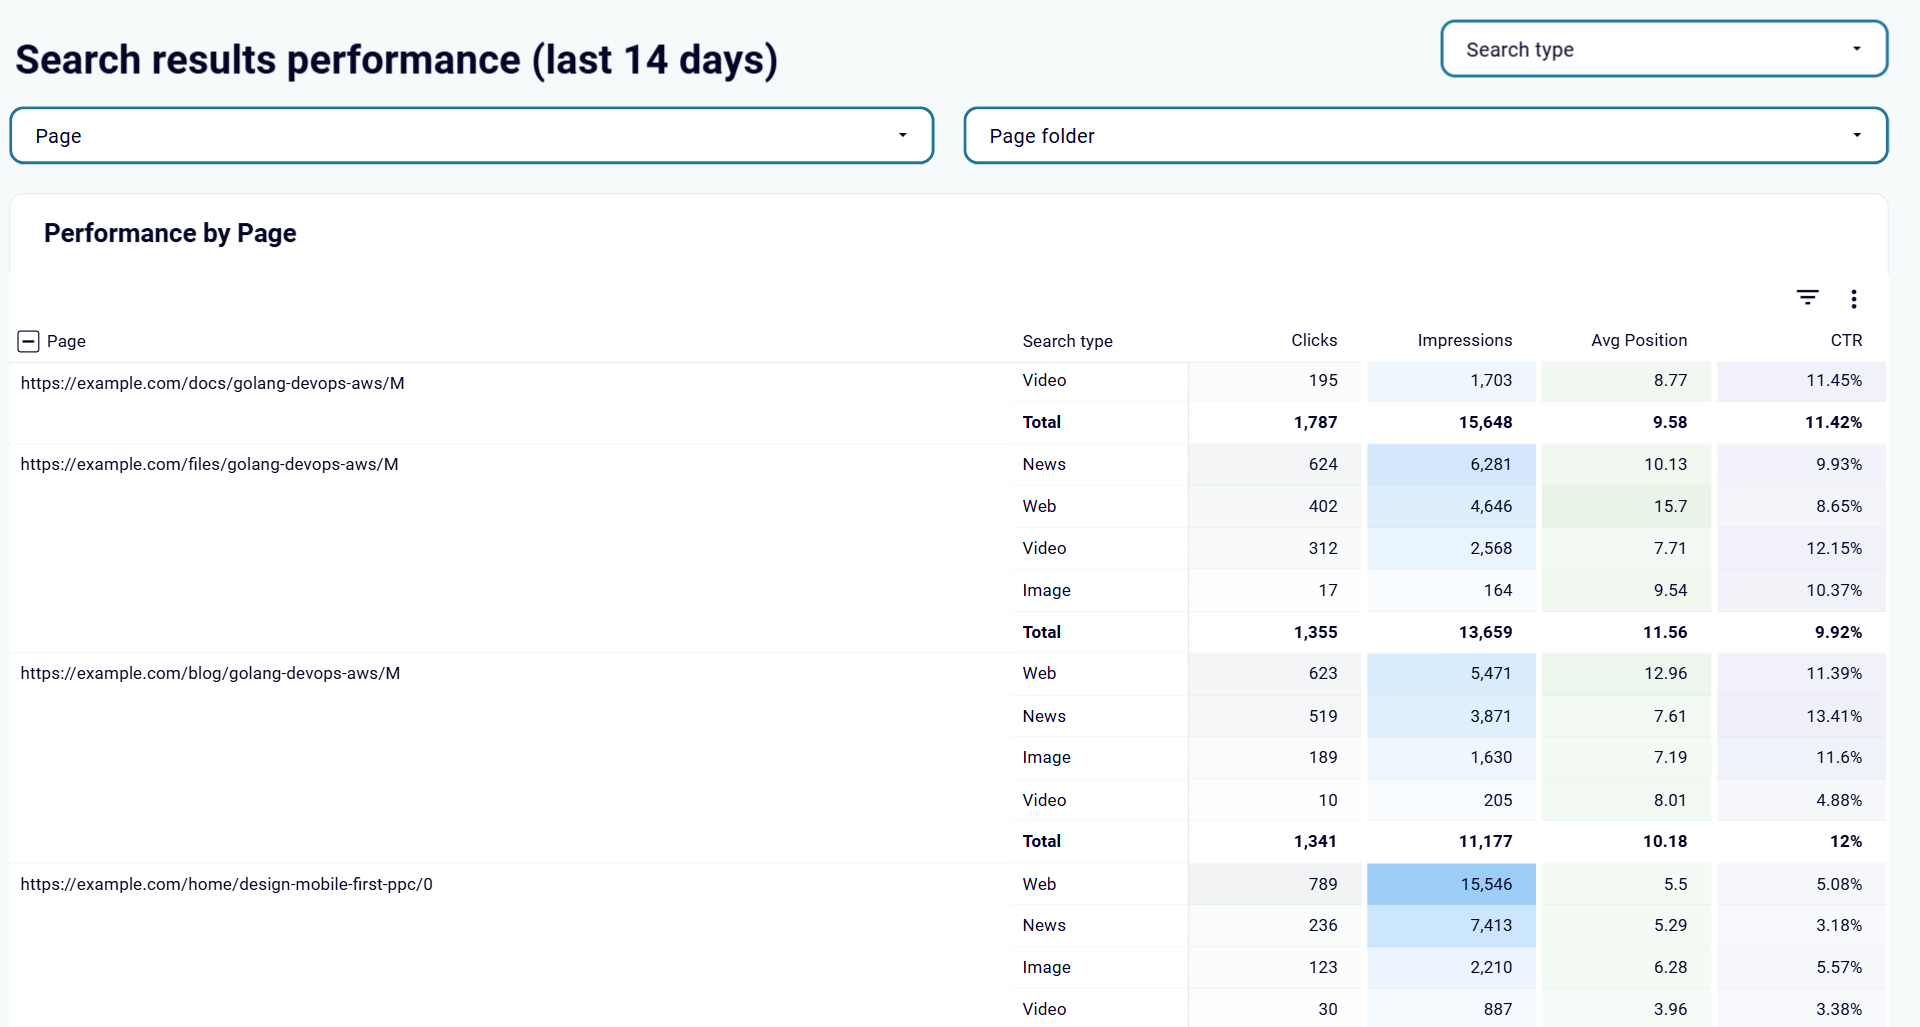
Each landing page's performance across Web, Image, Video, News, and Discover search appears in detailed tables with impressions, clicks, and CTR for every search type. Filter by specific pages to understand which content types succeed in particular search formats—product pages might generate strong image search traffic while blog posts excel in traditional web results. This granular view eliminates the need to apply multiple filters in Search Console, as all search type data appears together. You can quickly assess whether visual content reaches users through image search or if video-optimized pages capture video search traffic.
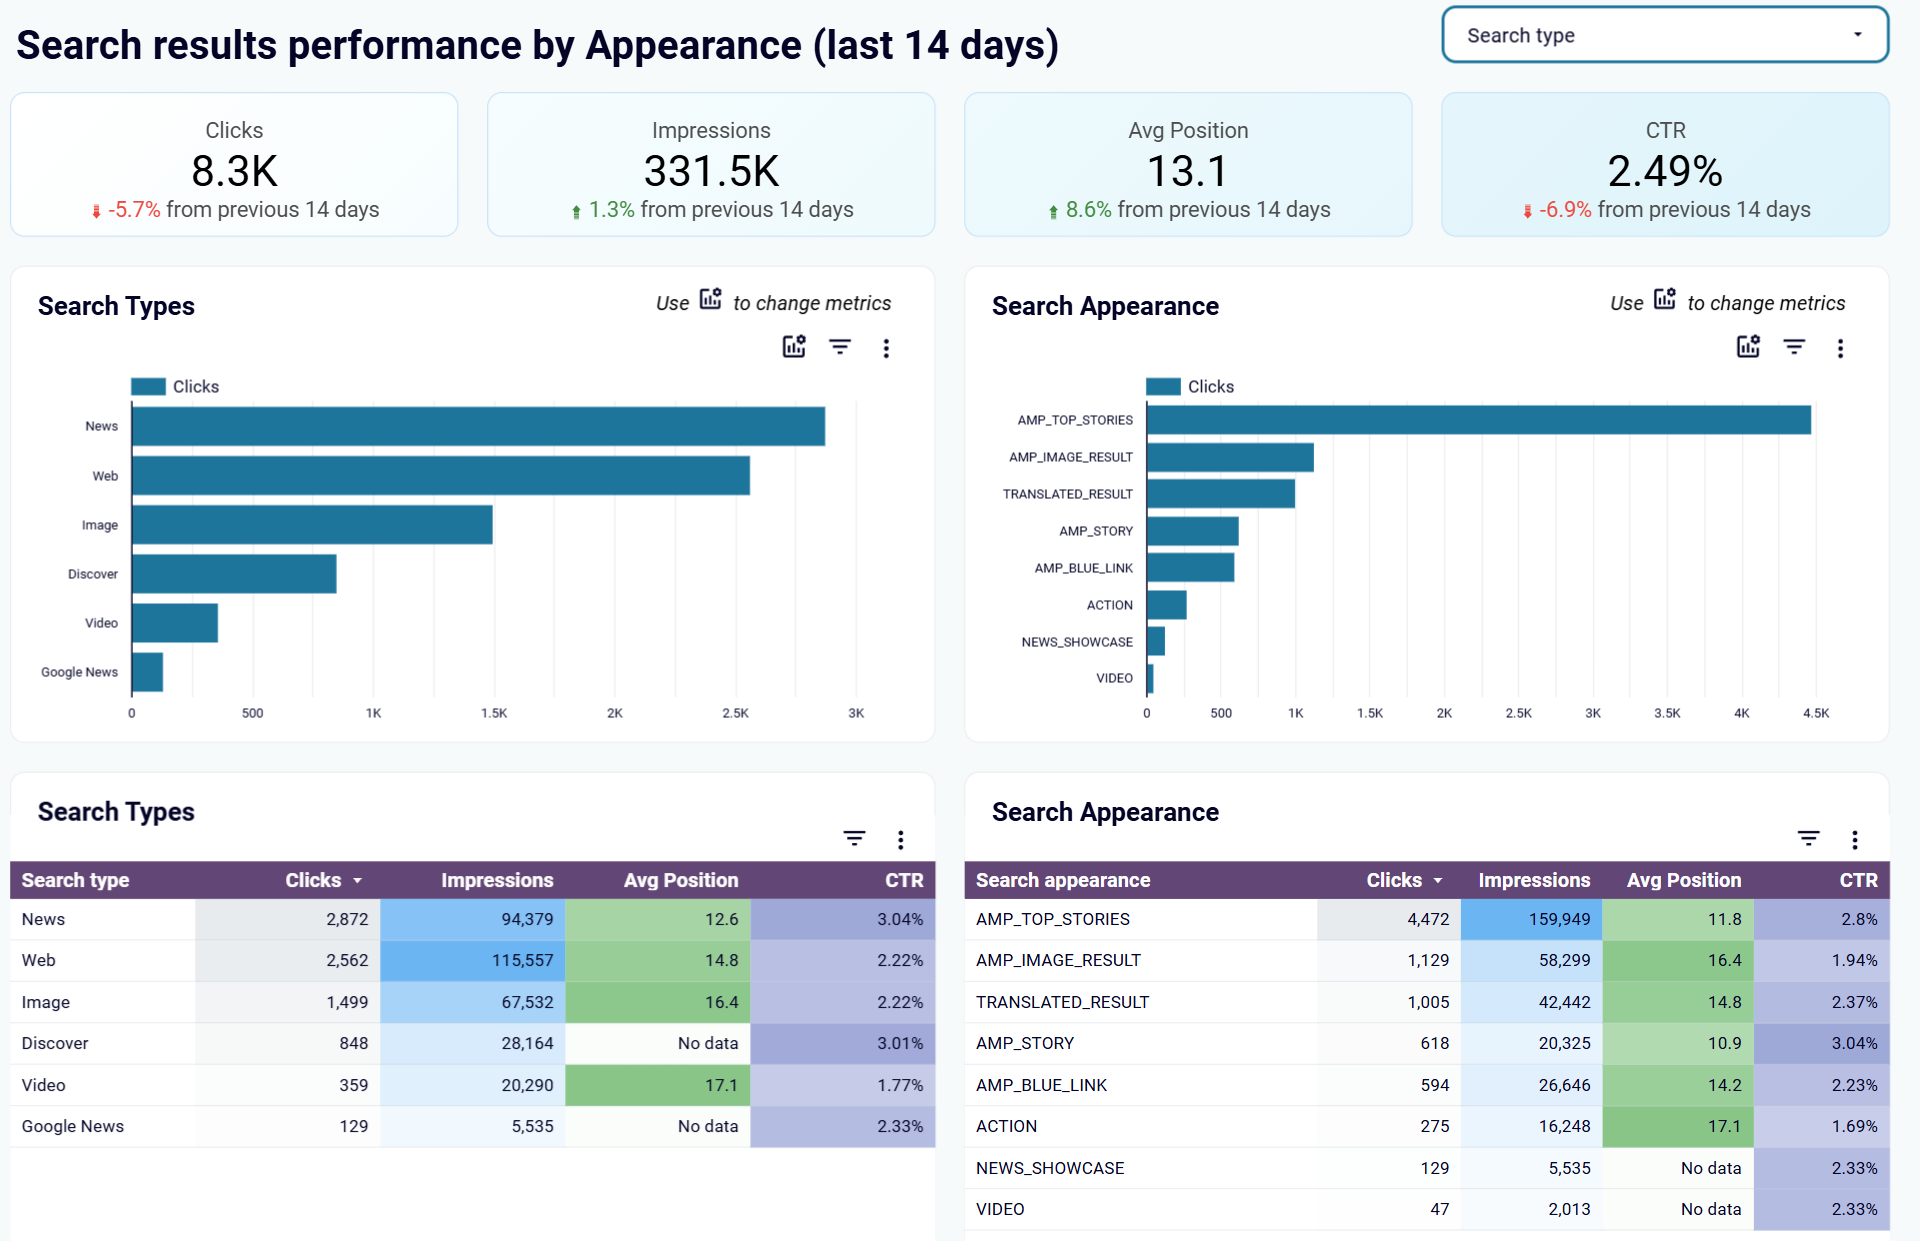
Apply search type filters to understand which page categories receive traffic from specific Google search formats. When you filter for image search, the table reveals which pages attract users searching visually—essential for sites with product catalogs or visual portfolios. Filter for discover traffic to identify content that Google surfaces in mobile discovery feeds, often indicating high-quality, engaging material. This filtered view helps prioritize optimization efforts—pages receiving image search impressions but low clicks need better image optimization, while pages absent from video search might benefit from embedded video content.
How to create a paid search dashboard?

Metrics you can track with a paid search dashboard template
Monitor how often your ads and organic listings appear in search results across all Google search types including Web, Image, Video, and Discover. This metric reveals your overall search visibility and helps identify whether low traffic stems from insufficient impressions or poor click-through rates. Track impression trends over time to assess the impact of bid adjustments, budget changes, or seasonal fluctuations on your search presence.
Track the number of times users click your paid ads or organic listings across different search types and campaigns. This metric directly measures user interest and engagement with your search presence. Compare clicks between paid and organic channels to understand traffic distribution, and analyze click patterns across ad groups to identify which messaging resonates most effectively with your target audience.
Calculate the percentage of impressions that result in clicks for both paid ads and organic listings. CTR indicates how compelling your ad copy and meta descriptions are to searchers. Low CTR on ads with strong impression share suggests headlines or descriptions need refinement, while low organic CTR points to meta tag optimization opportunities. Monitor CTR across different search types to identify formats where your content performs exceptionally or needs improvement.
Measure the average amount spent each time someone clicks your paid search ads. CPC trends reveal bidding efficiency and competitive landscape changes—rising costs may indicate increased competition requiring quality score improvements or targeting refinements. Compare CPC across campaigns and ad groups to identify where you're paying premium rates for clicks, enabling budget reallocation toward more cost-effective keywords and ad variations.
Track the number of desired actions completed by users who clicked your paid search ads, such as form submissions, purchases, or sign-ups. This metric connects advertising spend to business outcomes, revealing which campaigns generate actual results beyond traffic. Analyze conversion patterns across campaigns to identify top performers worthy of increased investment and underperformers requiring optimization or pause.
Monitor total advertising expenditure across campaigns and time periods to control budget pacing and identify spending patterns. Track ad spend alongside organic CTR to understand whether paid investments correlate with improved brand recognition. Compare spend distribution across campaign types to ensure budget allocation aligns with performance—campaigns consuming disproportionate spend relative to conversions may need restructuring or reduced funding.
Track where your organic listings rank in search results across different pages and search types. Position changes reveal SEO momentum—improving positions indicate successful optimization while declining ranks signal the need for content updates or technical improvements. Compare average position across search types to identify formats where your content ranks strongly versus those requiring optimization focus.