Marketing funnel dashboard examples and reporting templates
Optimize your customer acquisition journey with automated marketing funnel dashboards that track prospects from first impression to final purchase. Monitor conversion rates at every stage, identify bottlenecks in your sales process, and measure the effectiveness of email campaigns, social media ads, and cross-platform marketing efforts in driving revenue growth.
Marketing funnel dashboard examples for every need


 +4
+4


about your case. It doesn't cost you a penny 😉
Choose your white label marketing funnel dashboard to kick off
What is a marketing funnel dashboard?
The dashboard reveals conversion rates between each funnel stage, identifies where prospects abandon the process, and measures which marketing channels drive the most qualified leads. With automated data refreshing through Coupler.io, these dashboards eliminate manual reporting while providing real-time visibility into campaign performance, lead quality, and revenue attribution across all marketing touchpoints in one centralized view.

What reports should be included on a marketing funnel dashboard?
A comprehensive marketing funnel dashboard should integrate multiple reports that track prospects from initial engagement through final conversion. Based on our analysis of Facebook Ads, Google Analytics, and email marketing platforms, we recommend incorporating these four essential report types that provide complete visibility into your customer acquisition process.
The e-commerce conversion tracking report follows customers through the complete purchasing journey from initial ad impression to final transaction. This report combines data from Facebook Ads and website analytics to show progression through impression, clicks, add-to-cart actions, checkouts, and completed purchases. It reveals conversion rates between each stage and identifies where potential customers abandon the process.
The email marketing funnel performance report tracks subscriber engagement from campaign delivery through revenue generation. This report shows how email campaigns contribute to the broader marketing funnel by measuring delivery rates, open rates, click-through rates, and conversion to purchases. It integrates email marketing data from platforms like Klaviyo and Mailchimp with e-commerce analytics to demonstrate actual revenue impact.
The lead generation conversion report measures how advertising efforts translate into qualified prospects and eventual customers. This report tracks the progression from ad impressions and clicks to lead form submissions, then follows those leads through the sales process to closed deals. It shows cost per lead, lead quality scores, and conversion rates from different advertising sources.
The cross-platform attribution report connects marketing activities across multiple channels to show their combined impact on conversions. This report integrates data from Google Ads, Facebook Ads, email marketing, and website analytics to reveal how different touchpoints work together in the customer journey. It tracks users who interact with multiple marketing channels before converting, showing the true contribution of each platform to final sales.
What insights you can get with the marketing funnel dashboard
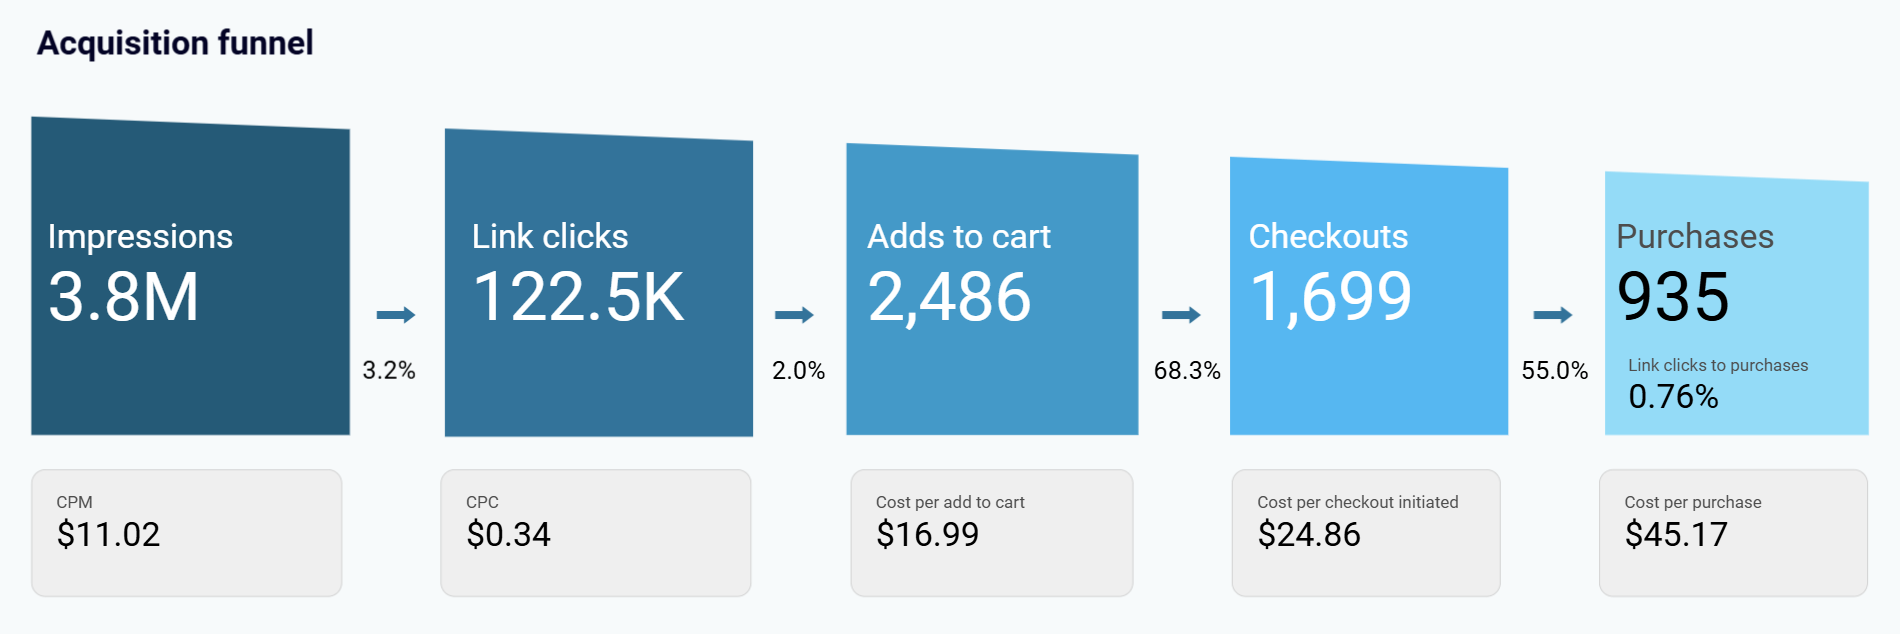
Monitor customer progression from ad impression through add-to-cart, checkout, and purchase completion to identify optimization opportunities at each stage. The Facebook Ads ecommerce performance dashboard reveals exactly where potential customers drop off in the buying process. This enables targeted improvements to product pages and checkout flows that increase overall conversion rates.
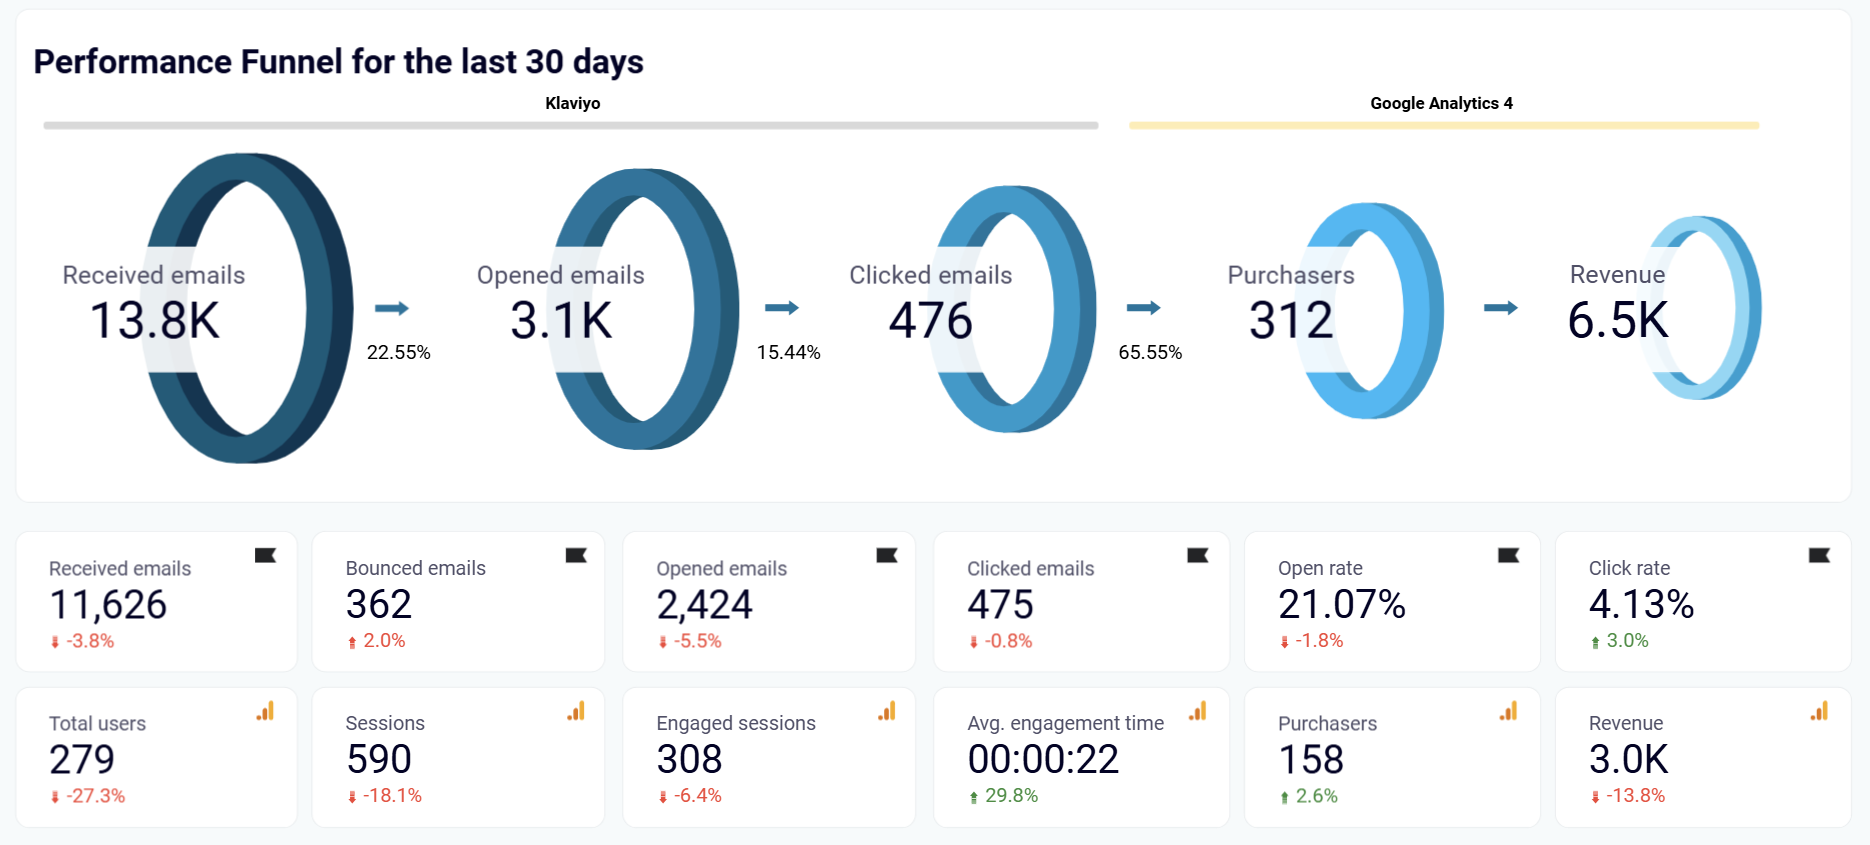
Track how email marketing campaigns contribute to customer acquisition by measuring delivery, engagement, and conversion to actual purchases. The Klaviyo and Mailchimp analytics dashboards show which email sequences generate the most qualified traffic and revenue. As a result, marketers can optimize nurturing campaigns for better funnel performance and customer lifetime value.
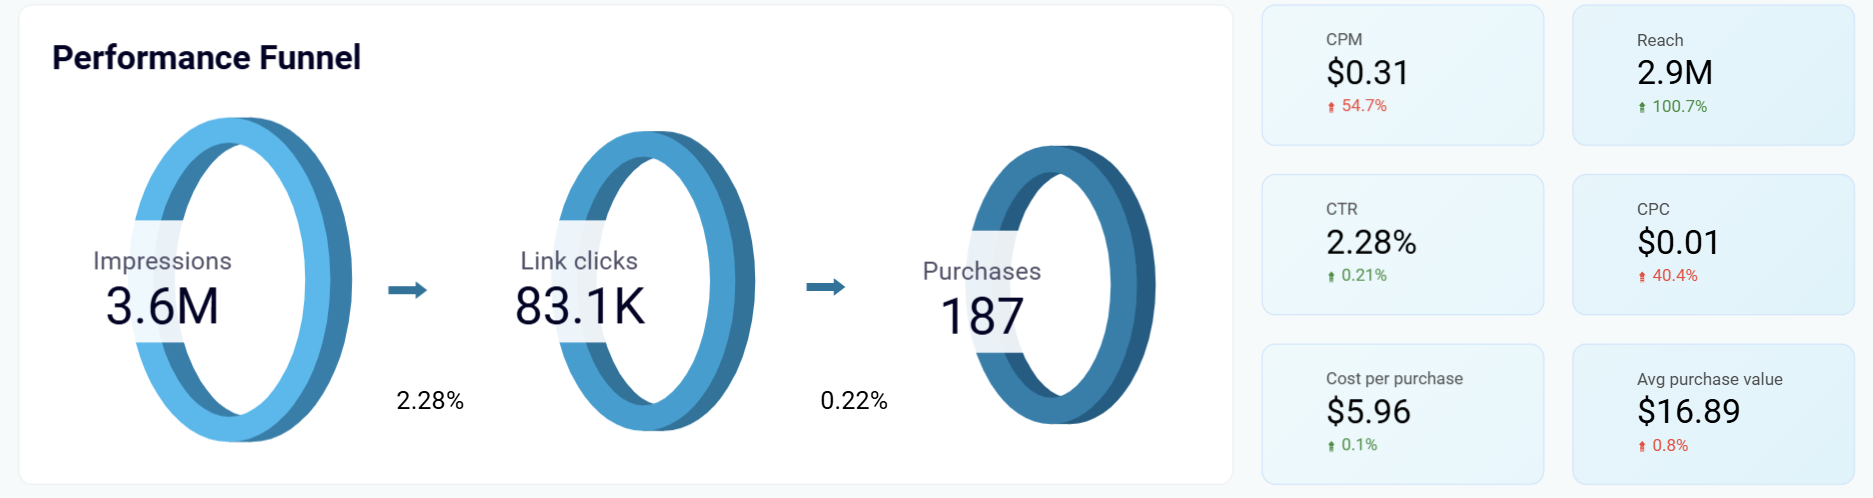
Visualize the complete path from ad impressions to actual purchase events with clear funnel stages showing conversion rates at each step. The Facebook Ads purchases breakdown dashboard displays how impressions convert to clicks and ultimately to purchase events. With this insight, marketers can identify bottlenecks and optimize campaigns for maximum revenue generation rather than just engagement metrics.
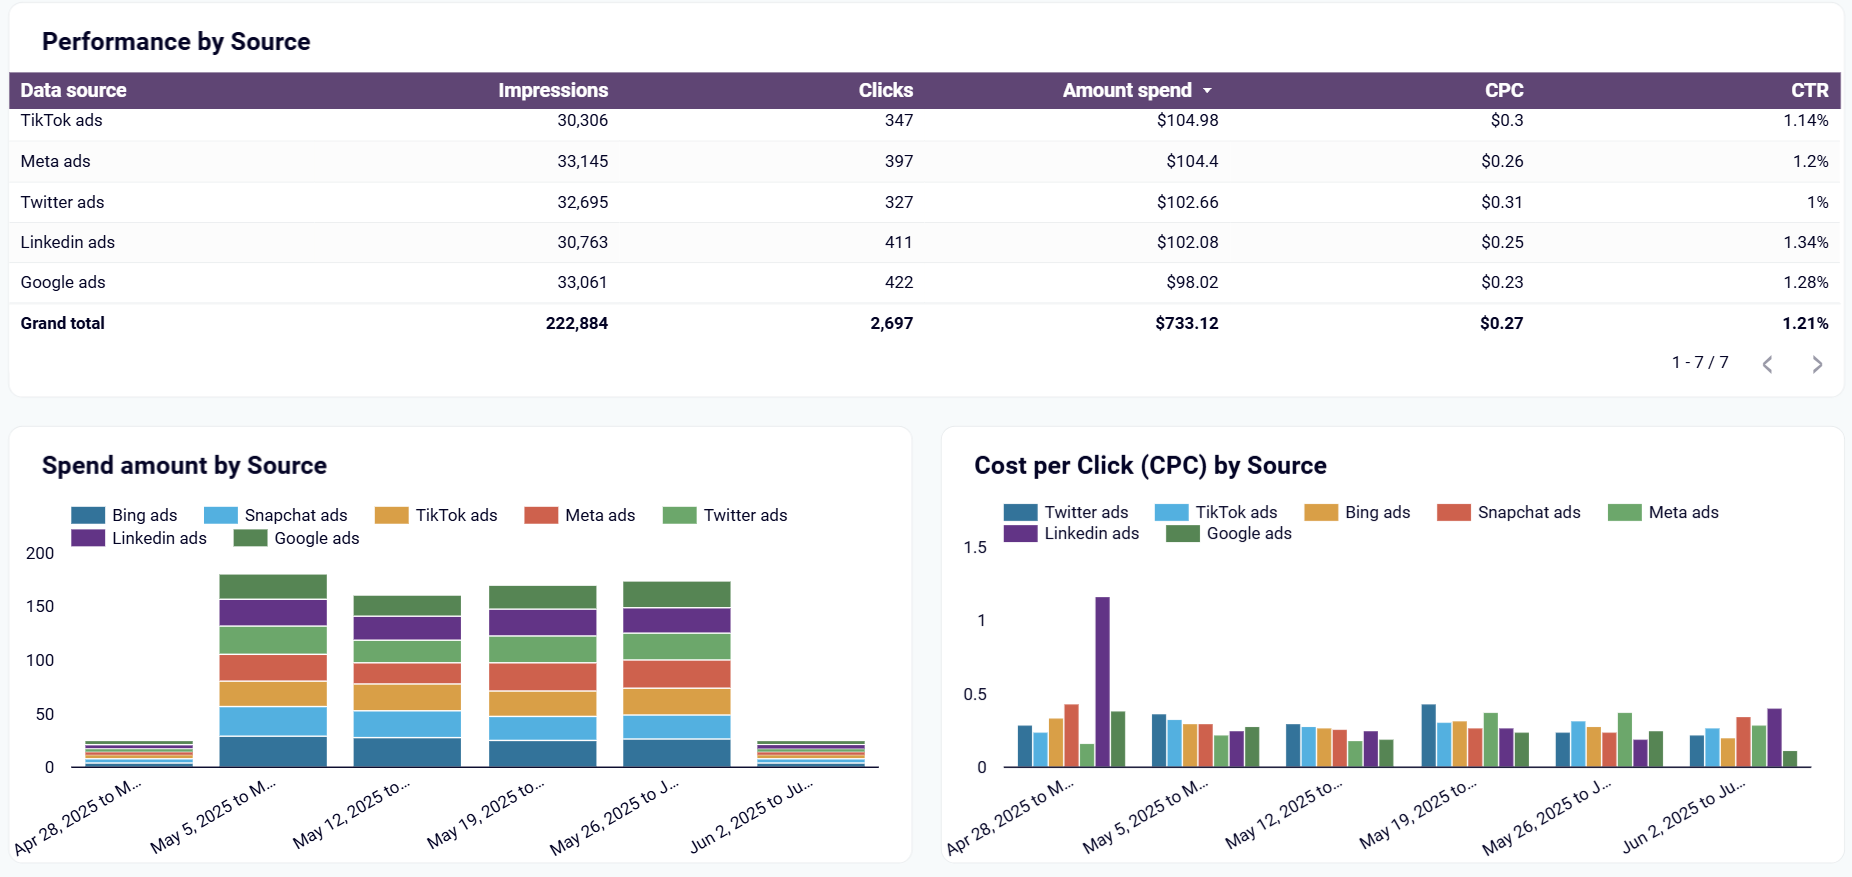
Understand how different marketing channels work together to drive conversions by tracking users across multiple touchpoints before purchase. The Google Analytics PPC dashboard combines advertising data with website behavior analytics. As a result, you can spot which combinations of marketing activities produce the highest conversion rates and most valuable customers.
How to create a marketing funnel dashboard?

Metrics you can track with a marketing funnel dashboard template
Track email campaign performance from delivery through opens, clicks, and conversions to optimize content and timing strategies. Monitor delivery rates, open rates, click-through rates, and revenue generation from email marketing efforts to maximize subscriber engagement and funnel contribution.
Monitor how website visitors progress from viewing products to adding items to their cart and completing checkout processes. Track conversion rates between browsing, add-to-cart actions, checkout initiations, and final purchases to identify optimization opportunities in the e-commerce funnel.
Measure actual purchase completions and total revenue generated from advertising campaigns across different platforms. Track purchase event counts, purchase values, and return on ad spend to understand which marketing activities drive the most profitable customer acquisitions.
Monitor key advertising metrics, including impressions, clicks, cost-per-click, and click-through rates to evaluate campaign effectiveness. Compare performance across different ad platforms and campaigns to optimize budget allocation and improve overall marketing funnel efficiency.
Track subscriber movement through email nurturing sequences from initial subscription through engagement activities to final conversion actions. Monitor how email campaigns contribute to the overall marketing funnel by measuring progression from email opens to website visits to purchases.
Analyze total purchase values over time compared to advertising spend to measure return on investment and revenue trends. Track how purchase values fluctuate with different campaign strategies and seasonal factors to optimize revenue generation from marketing activities.
Monitor email deliverability issues and subscriber engagement health by tracking bounce rates, unsubscribe rates, and list quality metrics. Identify potential problems in email campaigns that could negatively impact overall funnel performance and customer acquisition efforts.
Monitor the revenue generated compared to advertising spend across different platforms to measure campaign profitability and effectiveness. Track ROAS trends over time to identify which marketing investments deliver the highest returns and optimize budget allocation accordingly.