Mailchimp dashboard examples and reporting templates
Transform your email marketing strategy with automated Mailchimp dashboards that reveal the complete customer journey from initial email send to final purchase. Monitor campaign engagement, optimize send timing, and track revenue attribution across all your email marketing efforts with real-time insights from your Mailchimp account.
Mailchimp dashboard examples for every need


 +6
+6


 +5
+5

 +6
+6
about your case. It doesn't cost you a penny 😉
Choose your white label Mailchimp dashboard to kick off
What is a Mailchimp dashboard?
Unlike the native interface, a Mailchimp analytics dashboard consolidates multiple campaign insights into single views, allowing you to compare performance across time periods, identify optimal send times, and track the complete customer journey from email engagement to purchase completion. With automated data refreshing through Coupler.io, your dashboards stay current without manual updates, providing instant access to campaign performance trends and subscriber engagement patterns that inform strategic email marketing decisions.

What reports should be included in Mailchimp dashboards?
Building an effective Mailchimp metrics dashboard requires selecting reports that provide complete visibility into your email marketing performance and subscriber behavior. Based on our analysis of successful email marketing campaigns, we recommend incorporating these four essential report categories in Mailchimp dashboards.
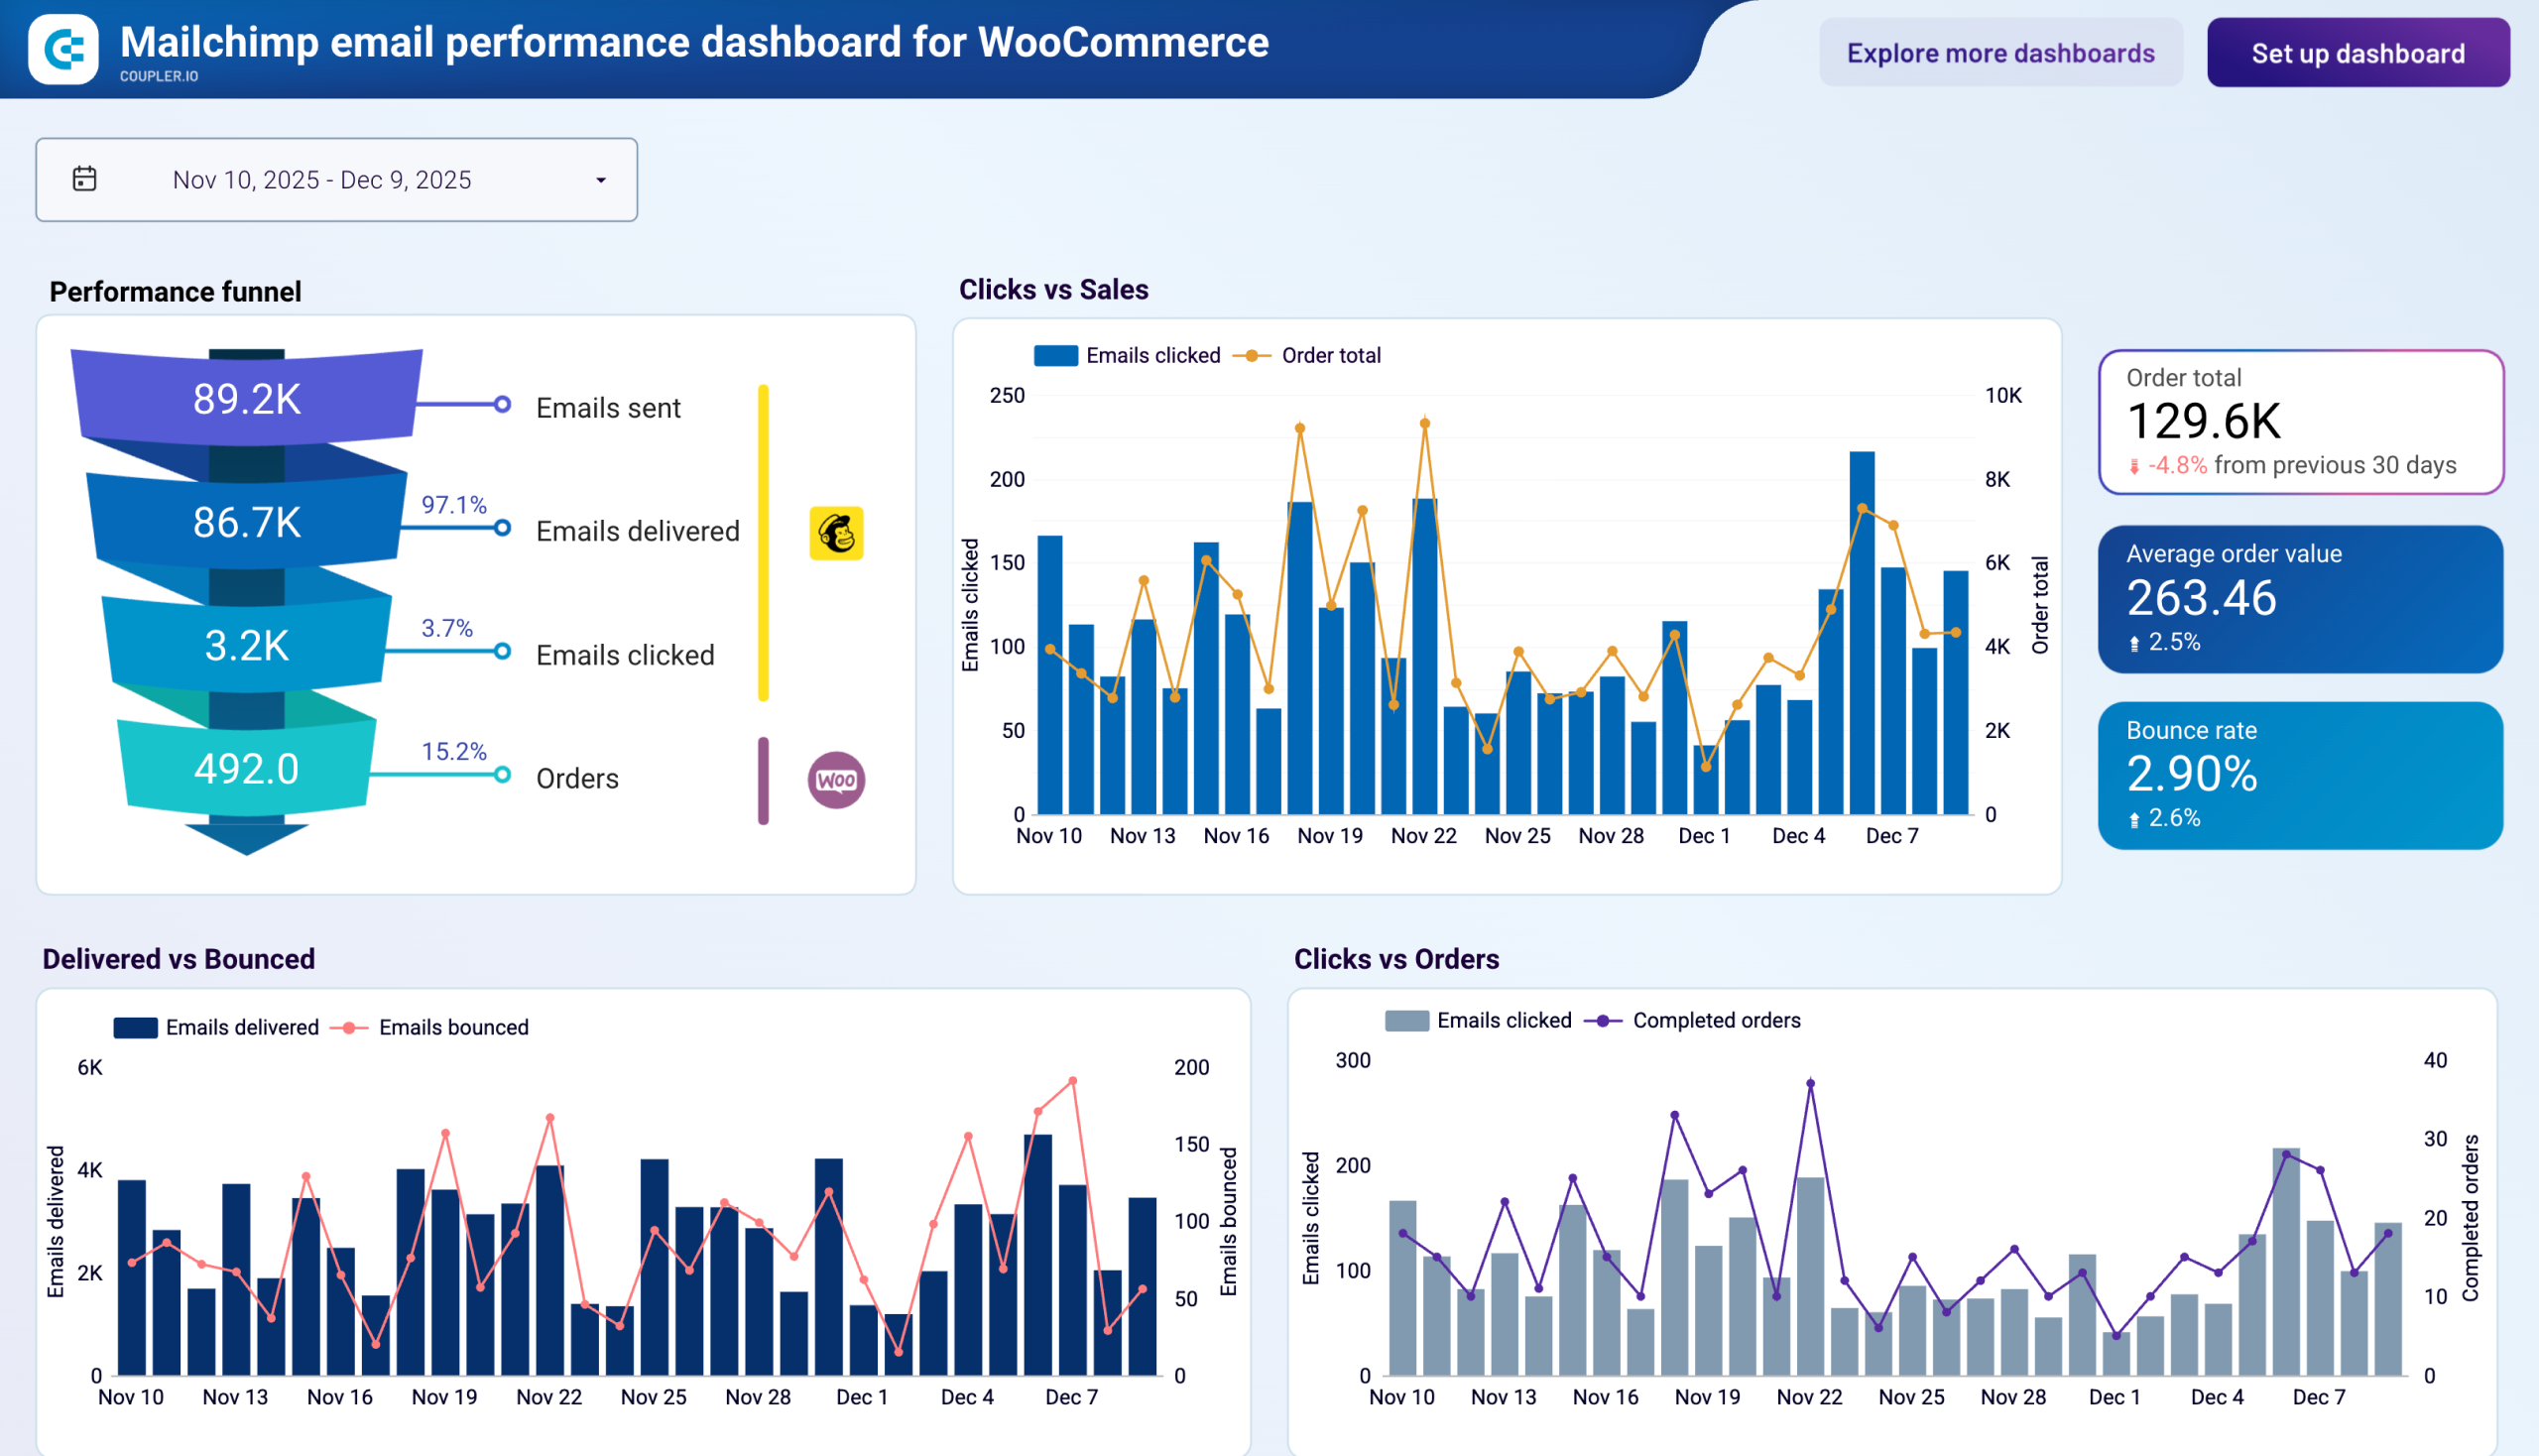
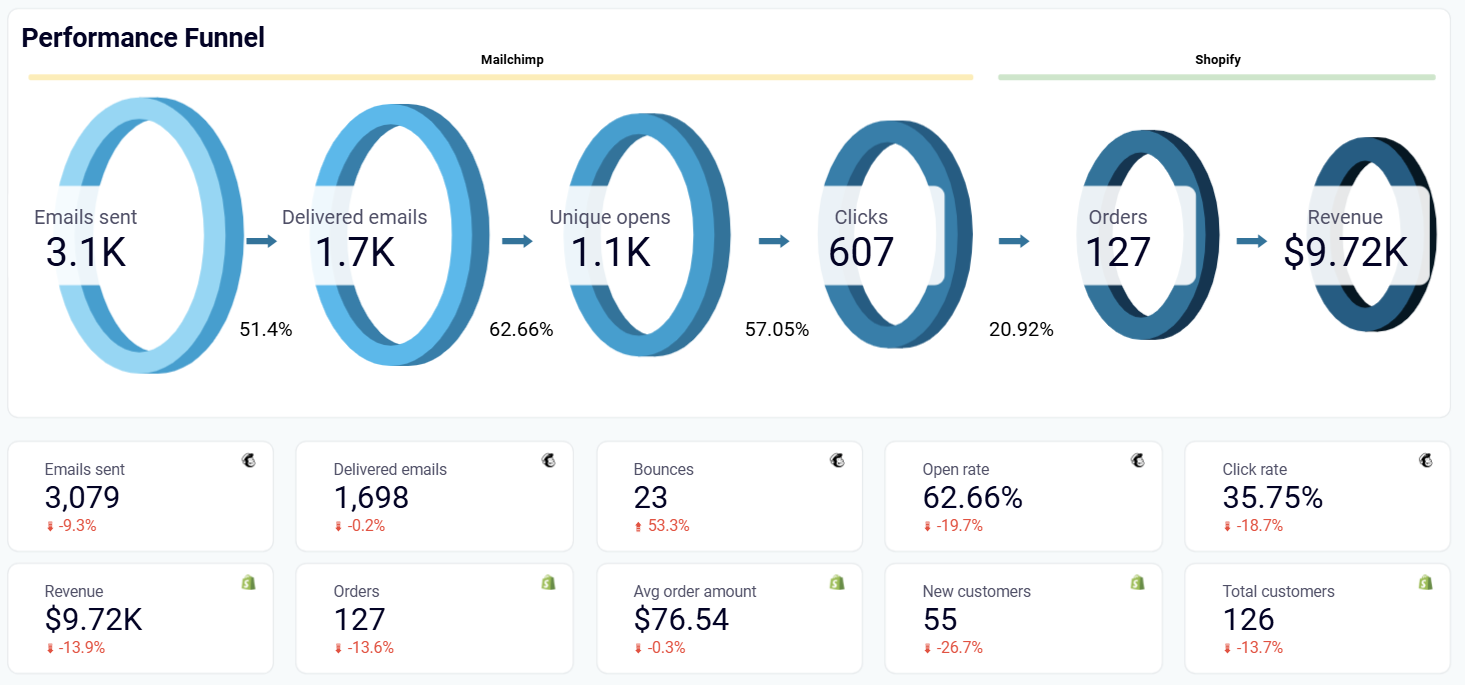
The email performance funnel report provides a visual representation of your complete email journey, showing how emails progress from delivery through opens, clicks, and ultimately to purchases and revenue generation. This report tracks the conversion rates at each stage, helping you identify where subscribers drop off in the engagement process. You can monitor delivery rates to ensure your emails reach subscriber inboxes, analyze open rates to evaluate subject line effectiveness, and track click-through rates to assess content relevance.
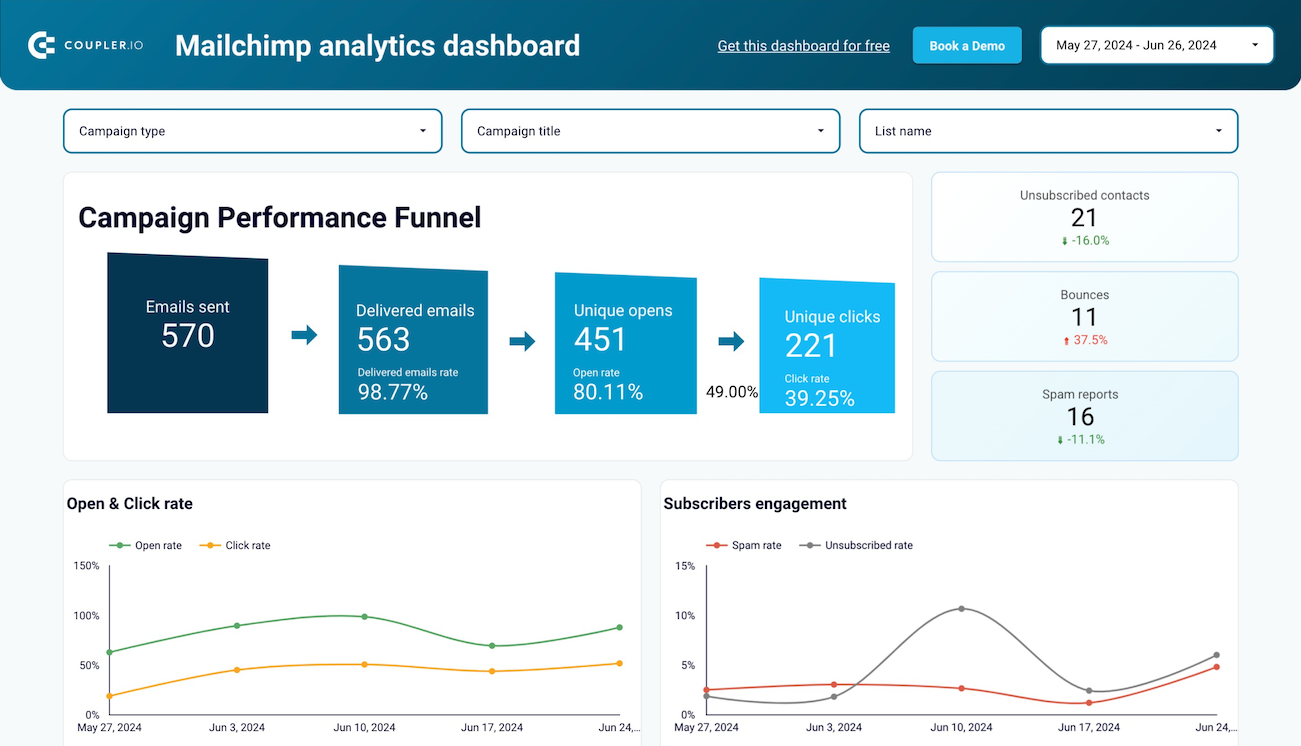
The campaign engagement analysis report focuses on subscriber interaction patterns, revealing which campaigns generate the highest engagement levels and which ones struggle to connect with your audience. This report examines metrics like open rates, click rates, unsubscribe rates, and bounce rates across different campaign types and time periods. It includes detailed breakdowns of subscriber behavior by demographics, email client preferences, and geographic location.
The send time optimization report analyzes when your subscribers are most likely to engage with your emails, providing data-driven recommendations for optimal send times. This report tracks daily and weekly engagement patterns, showing which days of the week and times of day generate the highest open and click rates for your specific audience. You can identify peak engagement windows and avoid low-performance periods, ensuring your most important campaigns reach subscribers when they're most receptive.
The subscriber behavior report analyzes how different segments of your audience interact with your email campaigns, revealing patterns in engagement, preferences, and lifecycle stages. This report tracks subscriber actions across multiple touchpoints, including email client preferences, geographic distribution, and engagement frequency patterns. You can identify your most active subscribers, understand which content types resonate with different audience segments, and spot early warning signs of subscriber fatigue or disengagement.
What insights you can get with the Mailchimp reporting dashboard
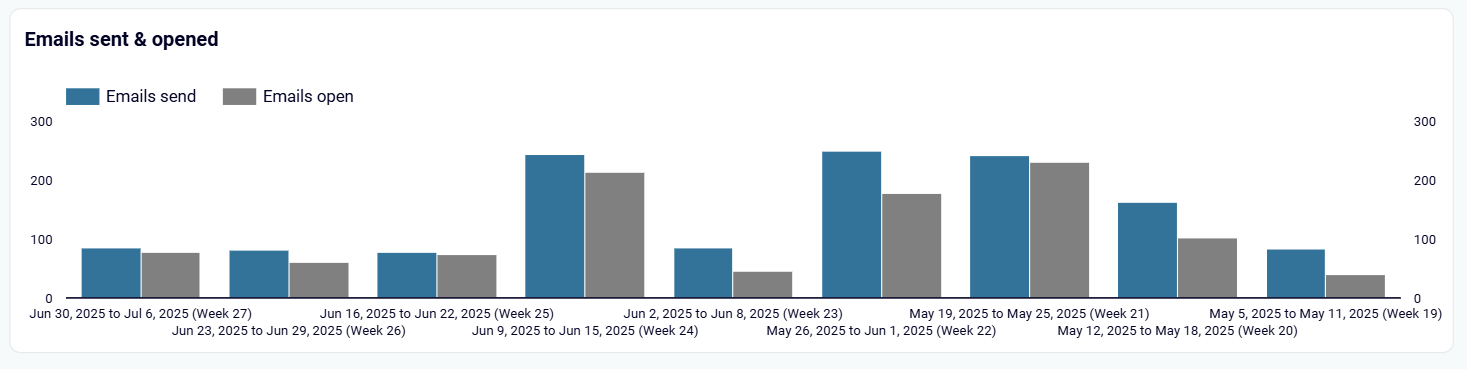
Monitor daily email performance patterns to identify when your subscribers are most active and engaged. The dashboard's daily performance chart reveals which days of the week consistently generate higher open and click rates, allowing you to schedule your most important campaigns during peak engagement windows. This insight helps you avoid sending emails during low-activity periods and ensures your content reaches subscribers when they're most likely to interact with your messages.
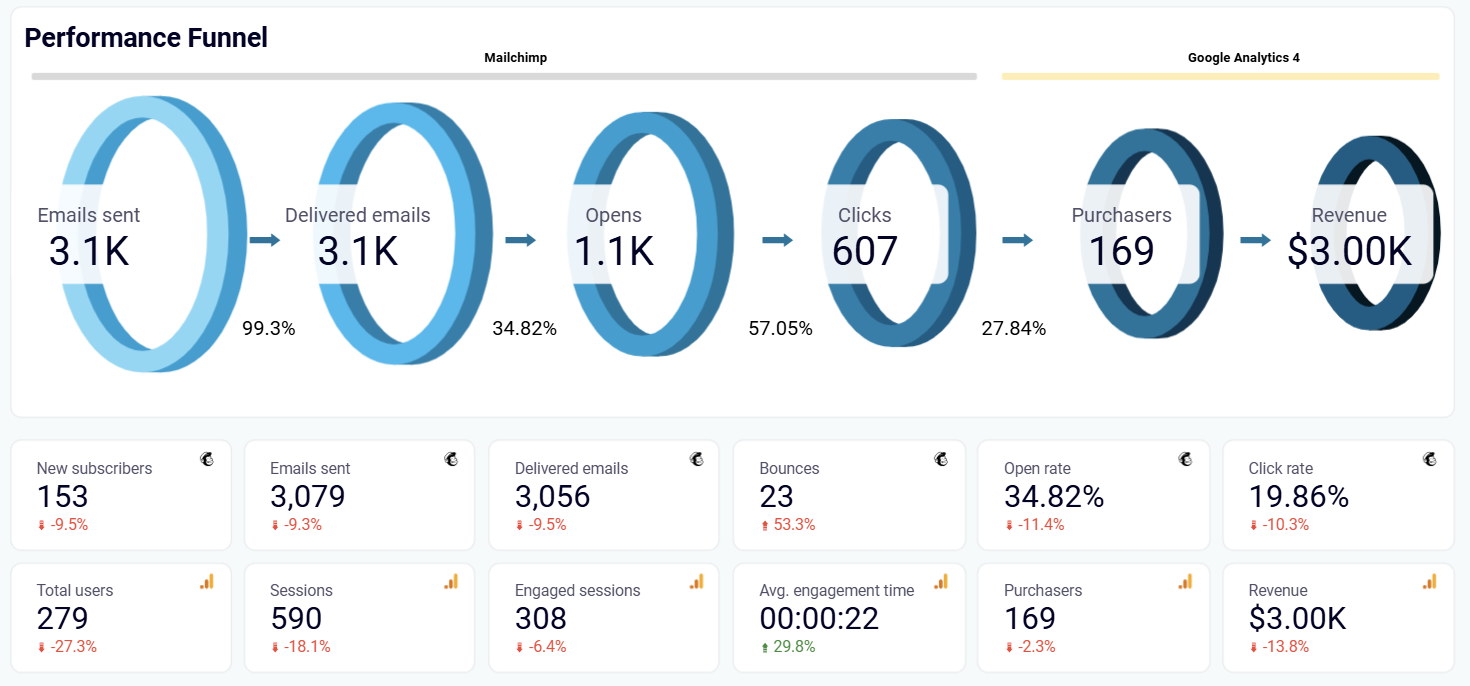
Track the complete customer journey from initial email delivery through final purchase conversion with comprehensive funnel visualization. This insight shows exactly how many emails reach subscriber inboxes, how many generate opens and clicks, and ultimately how many drive purchases and revenue. You can identify specific stages where subscribers drop off and optimize your campaigns to improve conversion rates at each step of the email marketing process.
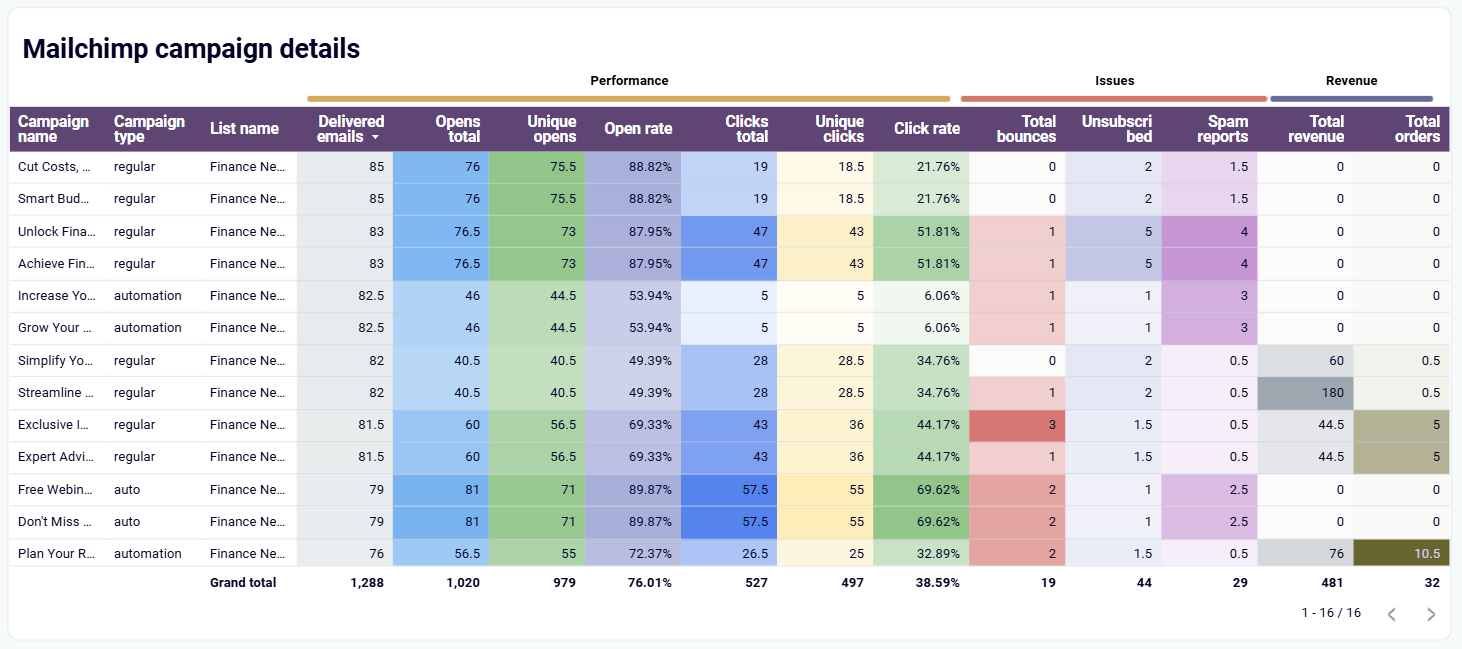
Understand which email campaigns drive the strongest subscriber engagement and which ones need improvement through detailed engagement metrics analysis. This insight reveals open rates, click rates, unsubscribe patterns, and subscriber interaction trends across different campaign types. You can identify successful campaign elements to replicate and problematic patterns that lead to decreased engagement or increased churn rates.
Monitor the complete revenue journey from email sends to final purchases, tracking how your campaigns contribute to business growth. This insight provides detailed metrics on emails sent, delivered, opened, clicked, and the resulting orders and revenue generated. You can calculate return on investment for different campaign types and optimize your email marketing strategy based on actual revenue performance rather than just engagement metrics.
How to create a Mailchimp dashboard?

Metrics you can track with Mailchimp dashboard templates
Track the total volume of emails dispatched across all your campaigns to understand your email marketing activity levels and campaign frequency. This metric helps you monitor your sending patterns, plan campaign schedules, and ensure consistent communication with your subscriber base while avoiding over-saturation.
Monitor the number of people joining your email list to evaluate the effectiveness of your lead generation efforts and list growth strategies. This metric reveals how well your opt-in forms, content offers, and marketing channels attract new subscribers to build your email audience.
Measure how many emails successfully reach subscriber inboxes after accounting for bounces and delivery failures. This metric indicates your sender reputation health and helps you identify potential deliverability issues that could impact campaign performance and subscriber engagement rates.
Track emails that fail to reach recipients due to invalid addresses, full inboxes, or server issues to maintain email list quality. Monitoring bounce rates helps you identify problematic email addresses, clean your subscriber list, and protect your sender reputation from deliverability problems.
Monitor how often subscribers mark your emails as spam to identify content or frequency issues that damage your sender reputation. This metric helps you understand when your campaigns may be too aggressive or irrelevant, allowing you to adjust messaging and targeting strategies.
Calculate the percentage of delivered emails that subscribers open to evaluate subject line effectiveness and overall campaign appeal. This metric reveals how well your email content attracts subscriber attention and helps you optimize subject lines, sender names, and send timing for better engagement.
Measure the percentage of email recipients who click on links within your campaigns to assess content relevance and call-to-action effectiveness. This metric shows how compelling your email content is and helps you optimize messaging, design, and offers to drive more website traffic.
Track the total income generated from email marketing campaigns to measure the direct financial impact of your email efforts. This metric connects your email marketing activities to business outcomes, helping you calculate return on investment and optimize campaigns for maximum revenue generation.