HubSpot dashboard examples and reporting templates
Optimize your marketing and sales performance with automated HubSpot reporting dashboards that integrate CRM data with marketing analytics. Monitor lead generation funnels, track team performance, analyze geographic trends, and measure campaign effectiveness across all channels with real-time data from your HubSpot platform.
HubSpot dashboard examples for every need


 +1
+1
about your case. It doesn't cost you a penny 😉
Choose your white label HubSpot dashboard to kick off
What is a HubSpot dashboard?
A HubSpot analytics dashboard leverages automated data connections through Coupler.io to ensure your metrics are always current without manual data entry. This integration creates a unified view of your entire revenue operations, from initial website visits and email campaigns to closed deals and customer lifecycle management, enabling data-driven decisions that accelerate revenue growth.

What reports should be included in HubSpot dashboards?
Effective HubSpot reporting requires strategic integration of marketing performance, sales pipeline analysis, team productivity metrics, and geographic market insights. Based on a comprehensive analysis of HubSpot's reporting capabilities, we recommend incorporating these four critical report categories in an efficient HubSpot KPI dashboard.
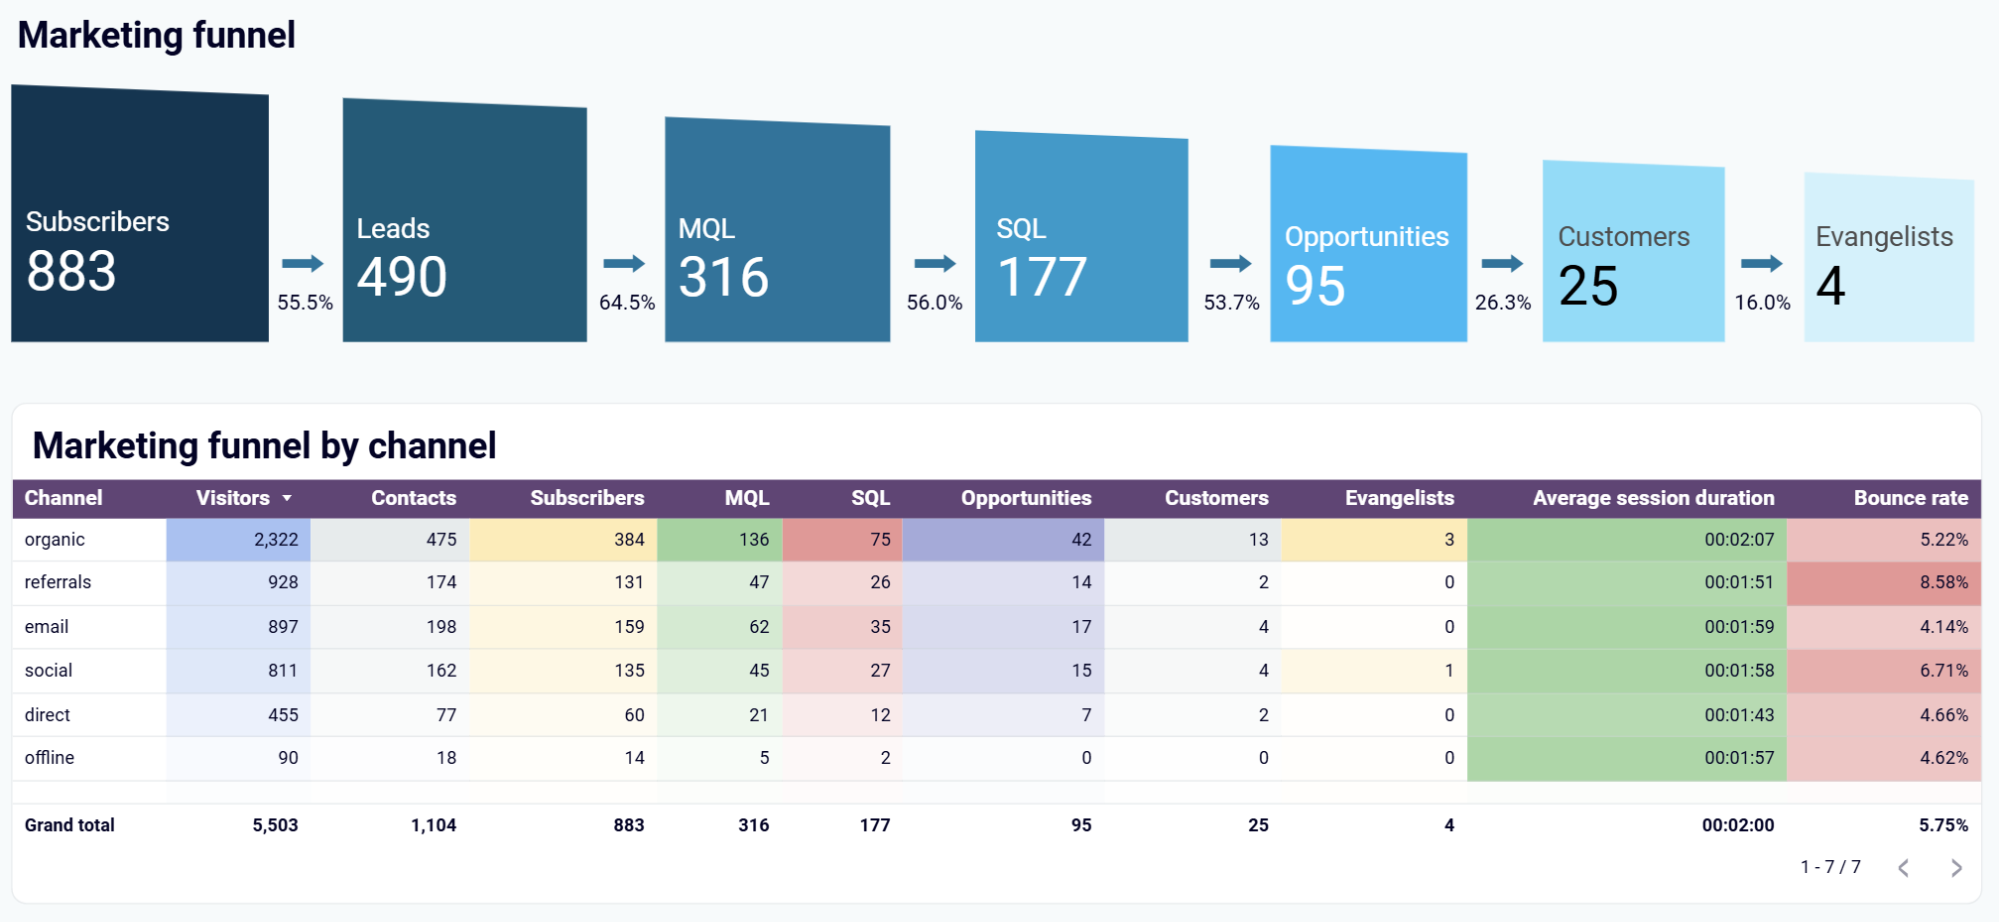
The marketing and sales funnel report delivers comprehensive customer journey tracking from initial touchpoints through closed deals and customer advocacy. This report visualizes conversion rates at each stage, including subscribers, leads, marketing qualified leads (MQLs), sales qualified leads (SQLs), opportunities, customers, and evangelists. Channel-specific funnel analysis helps identify which traffic sources produce the highest-converting prospects and reveals bottlenecks that prevent leads from advancing.
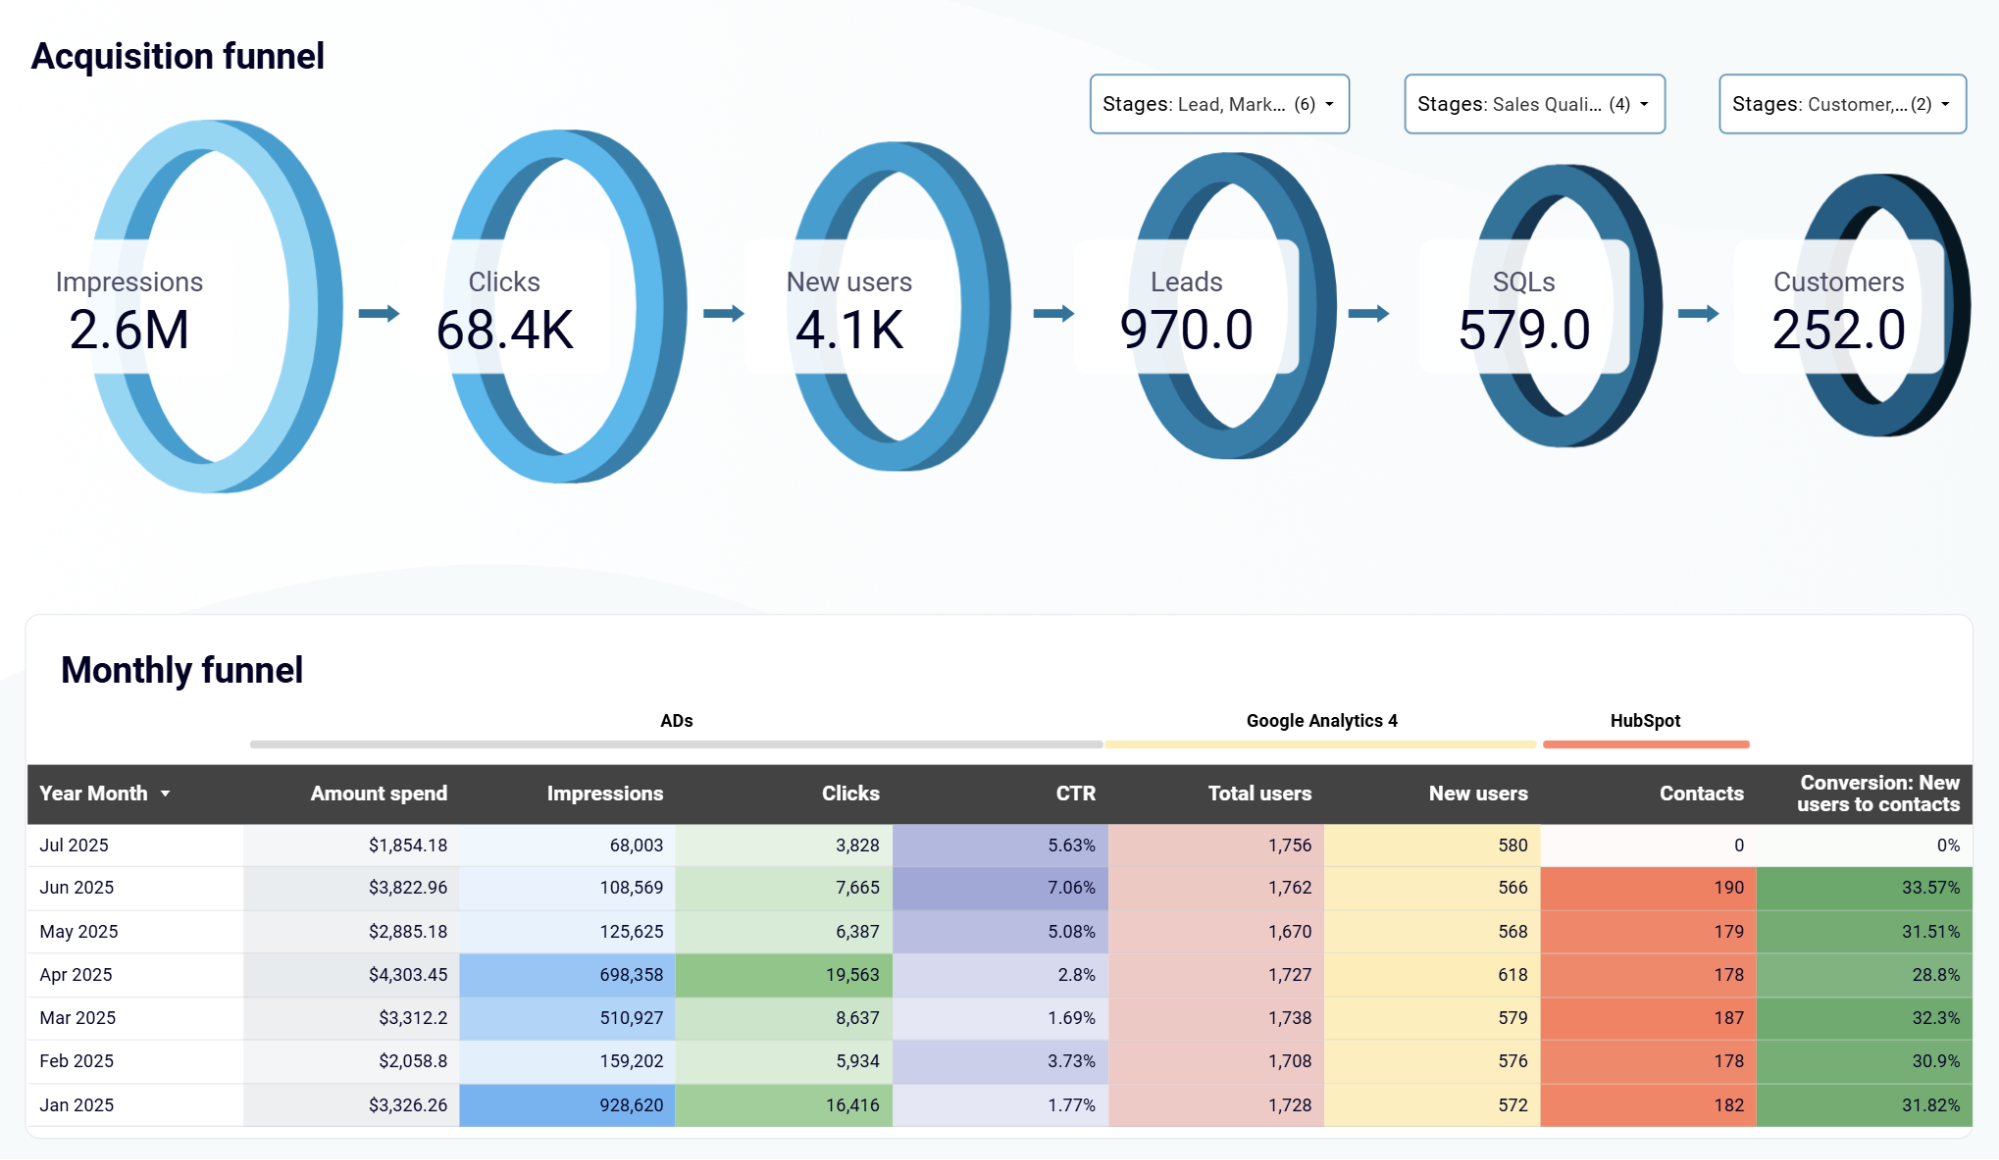
The customer acquisition performance report integrates multi-channel marketing data with HubSpot CRM analytics to track the complete lead generation ecosystem. This report connects advertising spend from platforms like Google Ads, Facebook, and LinkedIn with website analytics and CRM conversion data to provide end-to-end attribution. Performance tracking includes impression-to-lead conversion rates, cost per acquisition by channel, and lead quality scoring based on progression through sales stages.
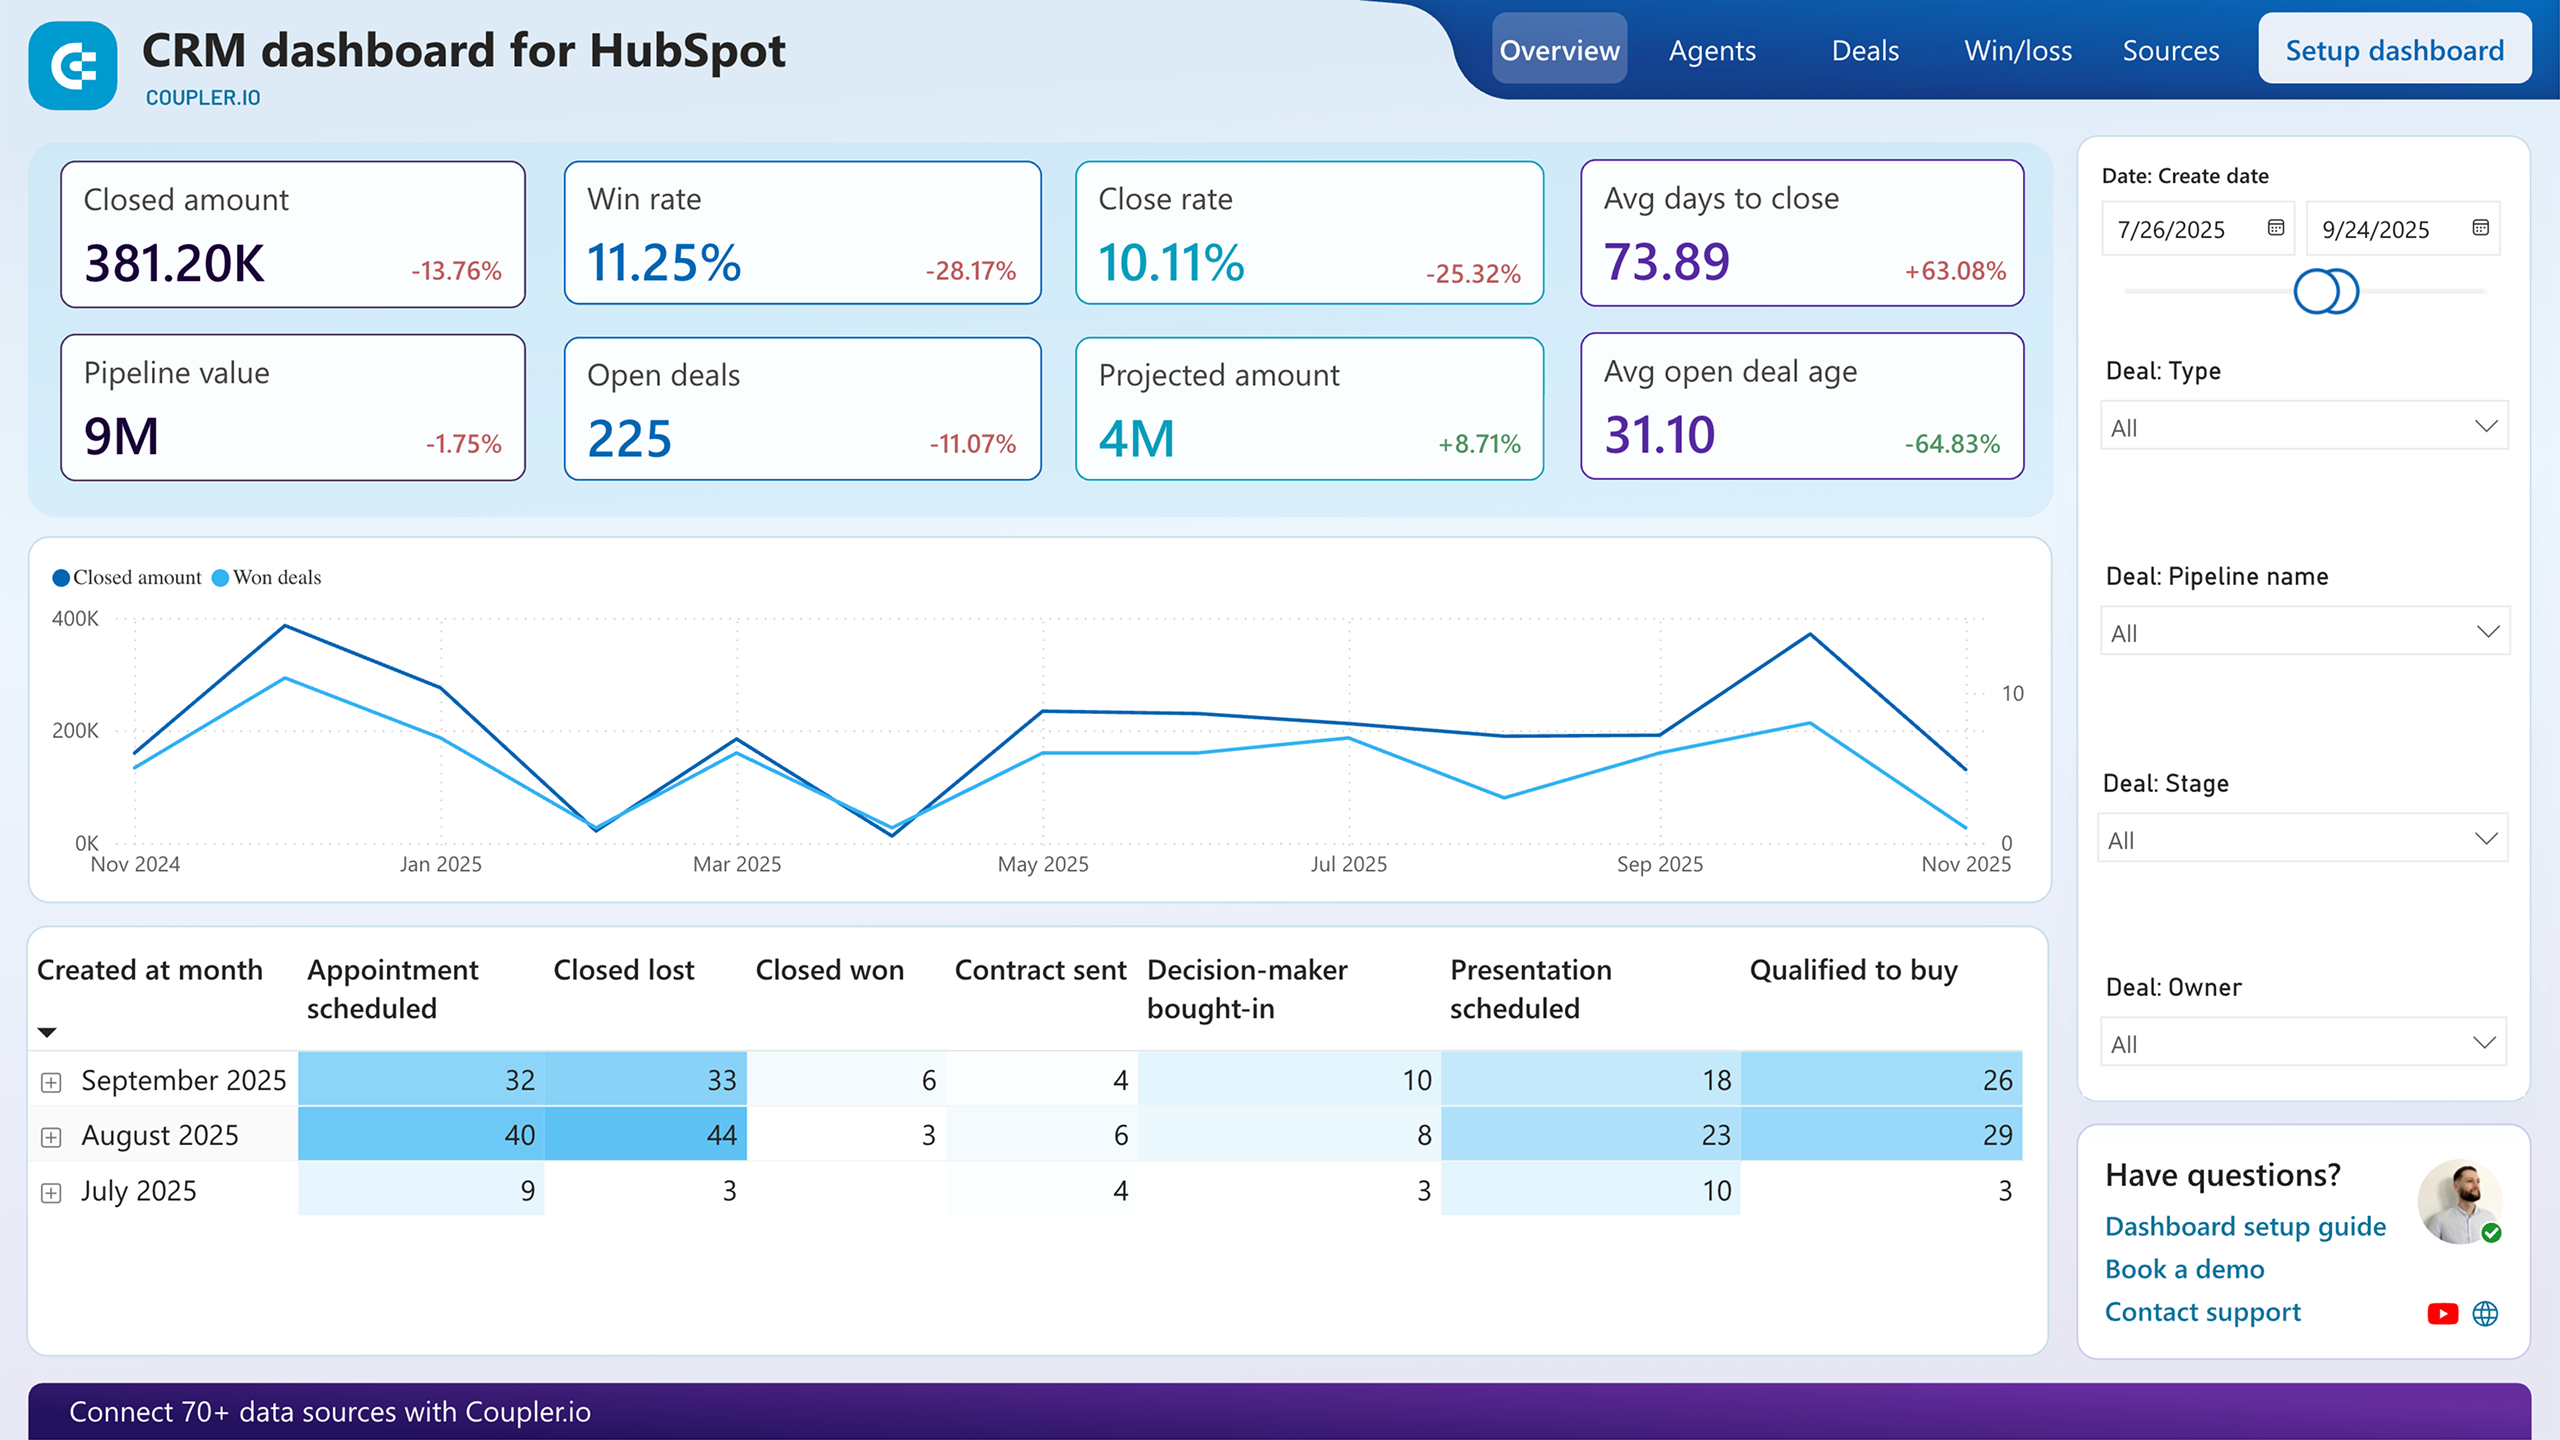
The sales team productivity report provides detailed analysis of individual and team performance across deals, pipelines, and customer segments. This report tracks key metrics including deal closure rates, average deal size, sales cycle length, and activity levels for each team member. Comparative analysis reveals best practices from top performers and identifies coaching opportunities for underperforming representatives.
The geographic market analysis report breaks down marketing and sales performance by country, region, and market segment to identify expansion opportunities and regional optimization needs. This report includes lead generation rates by geography, conversion performance across different markets, and revenue concentration analysis. Regional funnel comparisons help identify markets with high lead volume but low conversion rates, suggesting localization or sales process improvements.
What insights you can get with the HubSpot reporting dashboard
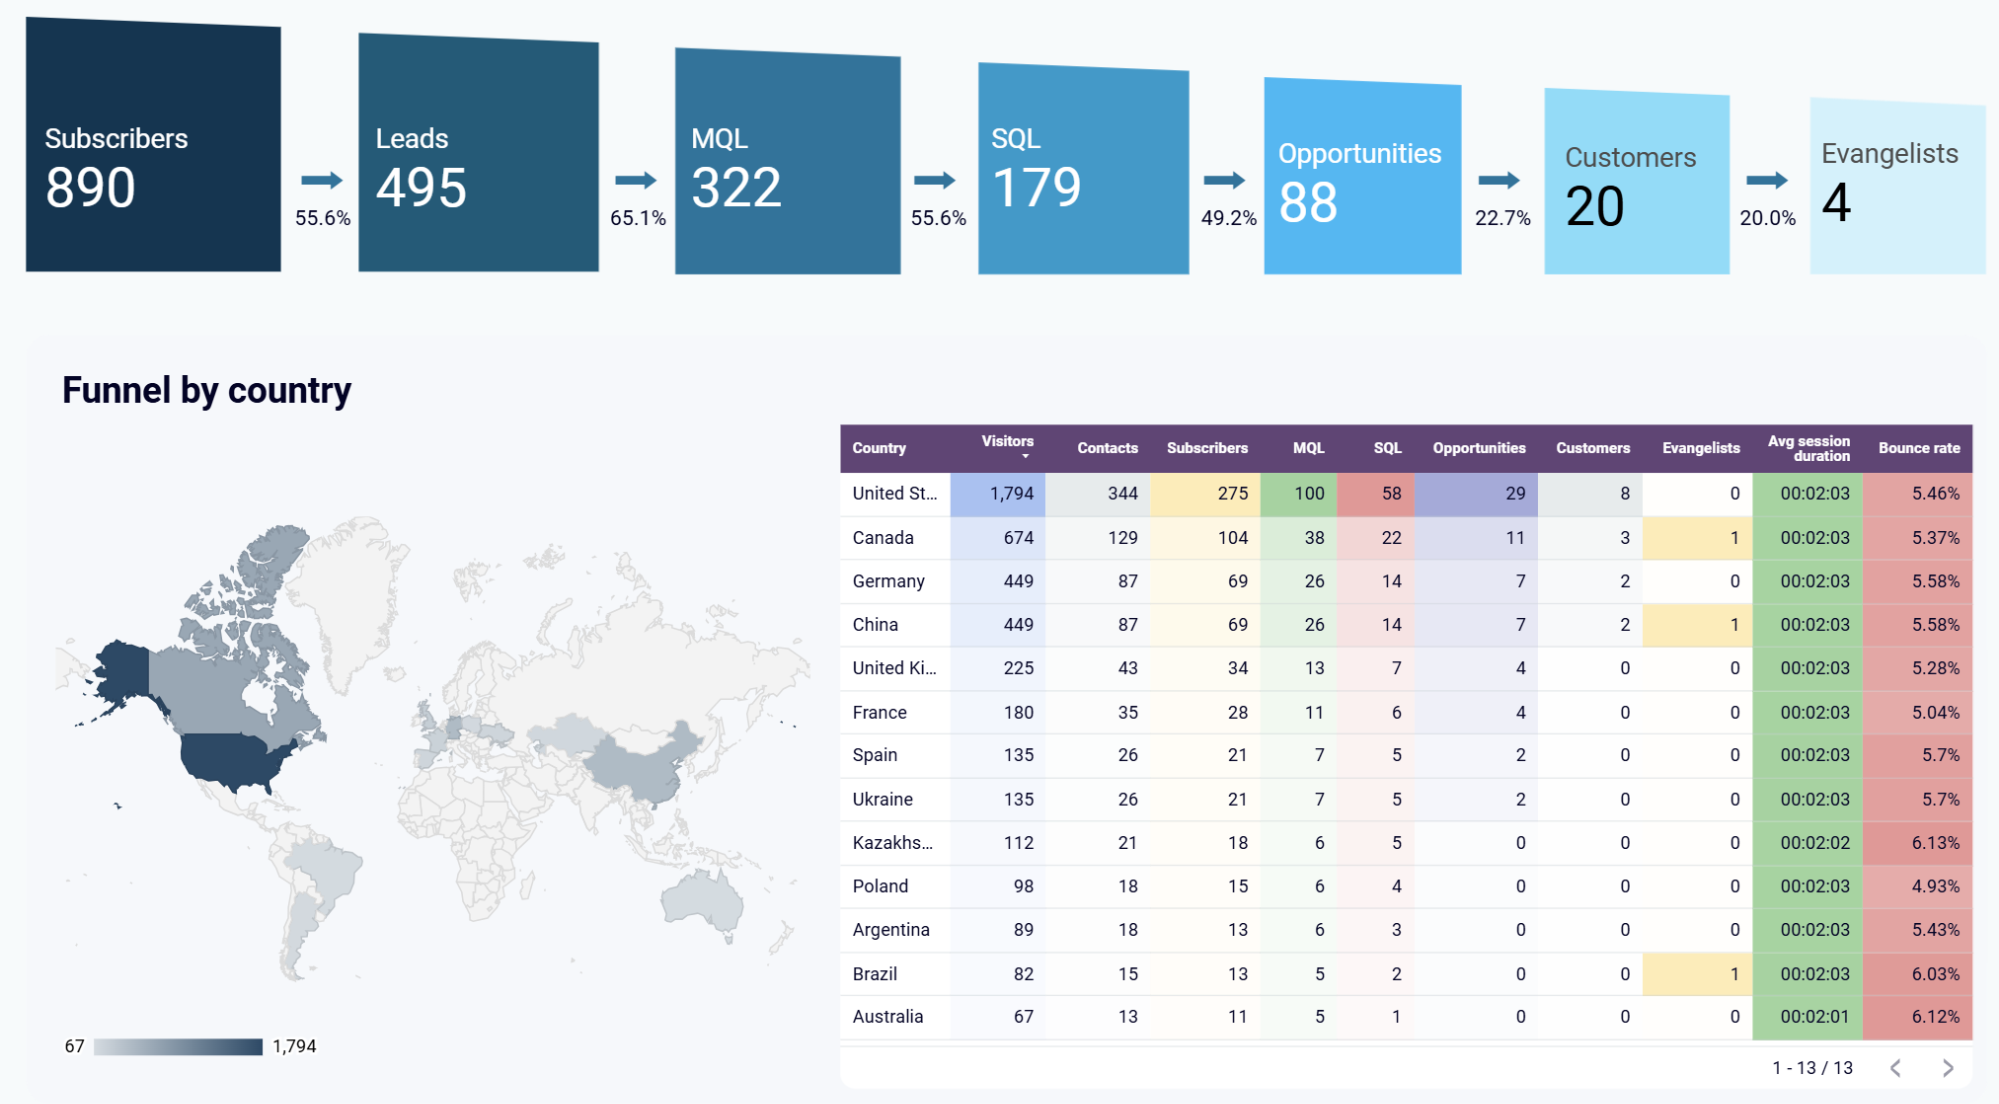
Performance breakdown by country and region reveals how different markets respond to your marketing efforts and sales processes. This analysis shows conversion rates at each funnel stage across geographic segments, helping identify markets with high lead volumes but low conversion rates that may require localized approaches. You can spot regional trends in customer behavior, optimize marketing spend for different territories, and develop market-specific sales strategies that improve overall revenue performance.
Customer journey tracking from subscribers to evangelists displays conversion percentages at each stage broken down by marketing channel. This visualization reveals which traffic sources produce the most valuable customers and identifies specific stages where prospects drop off most frequently. Teams can optimize their marketing mix by focusing resources on channels with the highest lifetime value conversion rates and addressing bottlenecks that prevent prospects from advancing through the sales process.
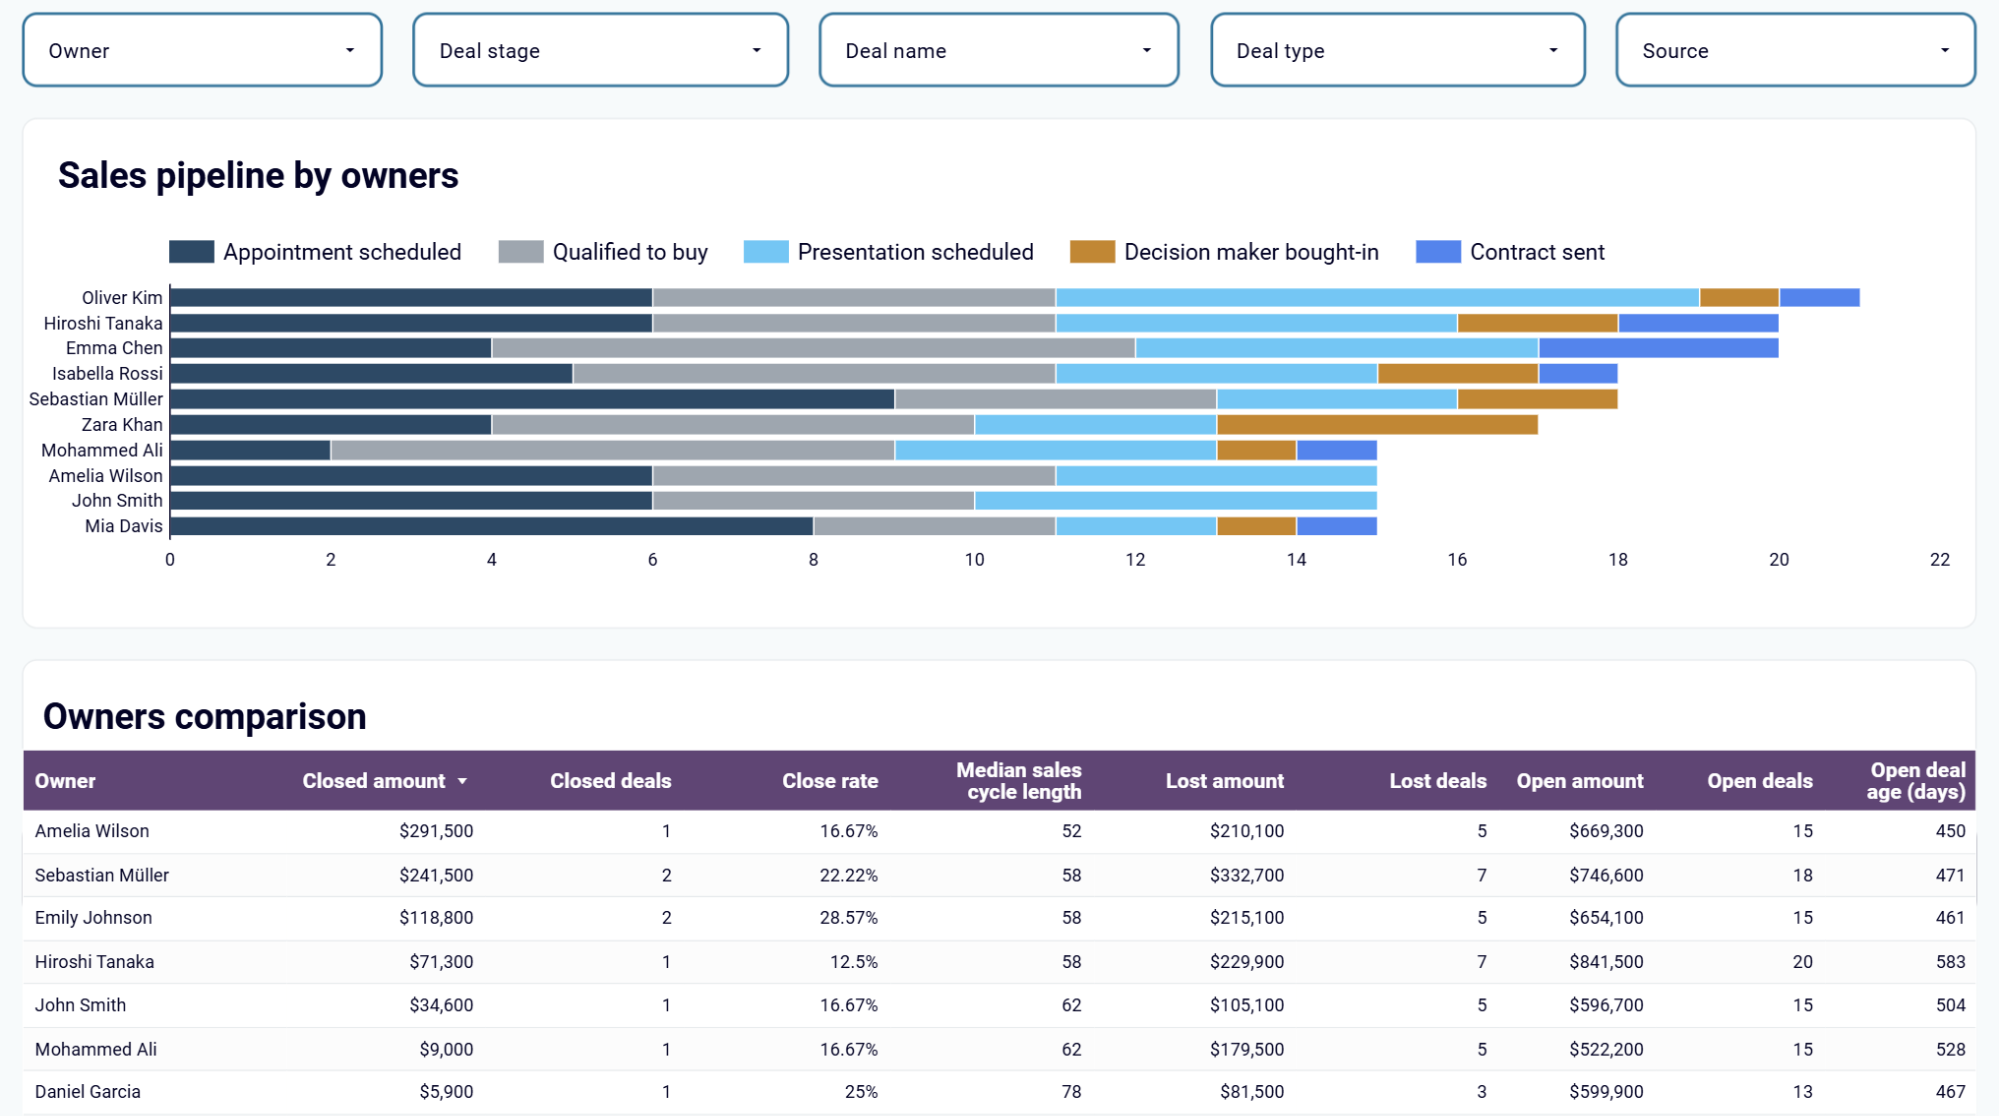
Comparative analysis across team members, deal types, and pipelines identifies best practices and coaching opportunities within your sales organization. This evaluation tracks individual performance metrics including closure rates, deal sizes, and sales cycle lengths to reveal top performer strategies that can be replicated across the team. Sales managers can make data-driven decisions about territory assignments, quota setting, and training programs based on concrete performance patterns rather than intuition.
Complete customer journey tracking from ad impressions through clicks, website visits, and HubSpot CRM lead conversion provides end-to-end attribution across all marketing channels. This analysis connects advertising spend with actual lead generation and revenue outcomes, enabling precise calculation of customer acquisition costs and return on marketing investment. Marketing teams can use the HubSpot customer acquisition dashboard to optimize budget allocation by identifying which platforms and campaigns drive the most qualified prospects through to closed deals.
How to create a HubSpot dashboard?

Metrics you can track with HubSpot dashboard templates
Monitor the complete database of individuals who have provided contact information through forms, content downloads, or other lead capture mechanisms. This metric represents your total addressable audience and serves as the foundation for all subsequent marketing and sales activities within your HubSpot ecosystem.
Measure the number of contacts who have opted in to receive ongoing communications such as newsletters, blog updates, or promotional content. Subscriber growth indicates the health of your content marketing efforts and your ability to maintain long-term engagement with prospects throughout their buyer journey.
Analyze marketing qualified leads who have demonstrated sufficient engagement and fit criteria to warrant sales attention. This metric bridges marketing and sales efforts by identifying prospects who have moved beyond initial awareness and shown genuine interest in your products or services through specific behaviors and characteristics.
Track sales qualified leads who have been vetted by your sales team and determined to have genuine purchasing intent and budget authority. This metric represents high-quality prospects actively moving through your sales process and provides insight into the effectiveness of your lead qualification processes.
Monitor active deals in your sales pipeline that represent potential revenue with defined deal stages, values, and close dates. This metric provides visibility into your forecasted revenue and helps sales teams prioritize activities based on deal size, probability, and timeline to maximize closing success rates.
Measure successful deal closures that have resulted in paying customers, representing the ultimate conversion goal of your marketing and sales efforts. This metric enables calculation of customer acquisition costs, lifetime value, and overall business growth while informing retention and expansion strategies.
Track highly satisfied customers who actively promote your brand through referrals, testimonials, case studies, or social media advocacy. These brand champions represent the highest level of customer success and provide valuable social proof that drives new customer acquisition through authentic recommendations.
Analyze how long visitors spend on your website during each visit, indicating content quality and user engagement levels. Longer session durations suggest visitors find your content valuable and relevant, while shorter sessions may indicate misaligned traffic sources or content optimization opportunities.
Monitor the percentage of visitors who leave your website after viewing only one page without taking any additional actions. High bounce rates may indicate poor content relevance, slow page loading times, or misaligned traffic sources, while low bounce rates suggest effective user experience and content engagement.