Funnel dashboard examples and reporting templates
Track every stage of your customer journey with automated funnel dashboard templates that visualize conversion paths from initial ad impressions through to completed sales. Connect data from advertising platforms, Google Analytics 4, and CRM systems to monitor drop-off points, analyze lead generation performance, and optimize conversion rates across marketing and e-commerce channels.
Funnel dashboard examples for every need


 +1
+1


 +3
+3


 +5
+5


 +5
+5


 +3
+3


 +3
+3

 +4
+4

about your case. It doesn't cost you a penny 😉
Choose your white label funnel dashboard to kick off
What is a funnel dashboard?
By displaying metrics at every funnel stage alongside conversion rates between steps, these dashboards help identify exactly where potential customers drop out of the journey and which marketing channels drive the highest-quality conversions. Automated data updates through Coupler.io ensure that your funnel analysis reflects real-time performance, eliminating the need for manual data exports or consolidation. This creates a reliable source for conversion optimization decisions across lead generation and sales teams.

What reports should be included in funnel dashboards?
Building an effective funnel analysis dashboard requires selecting reports that illuminate different aspects of your conversion process. The dashboards below represent proven approaches to funnel tracking across lead generation, customer acquisition, and e-commerce scenarios. Each report addresses specific business questions about conversion performance and drop-off patterns.
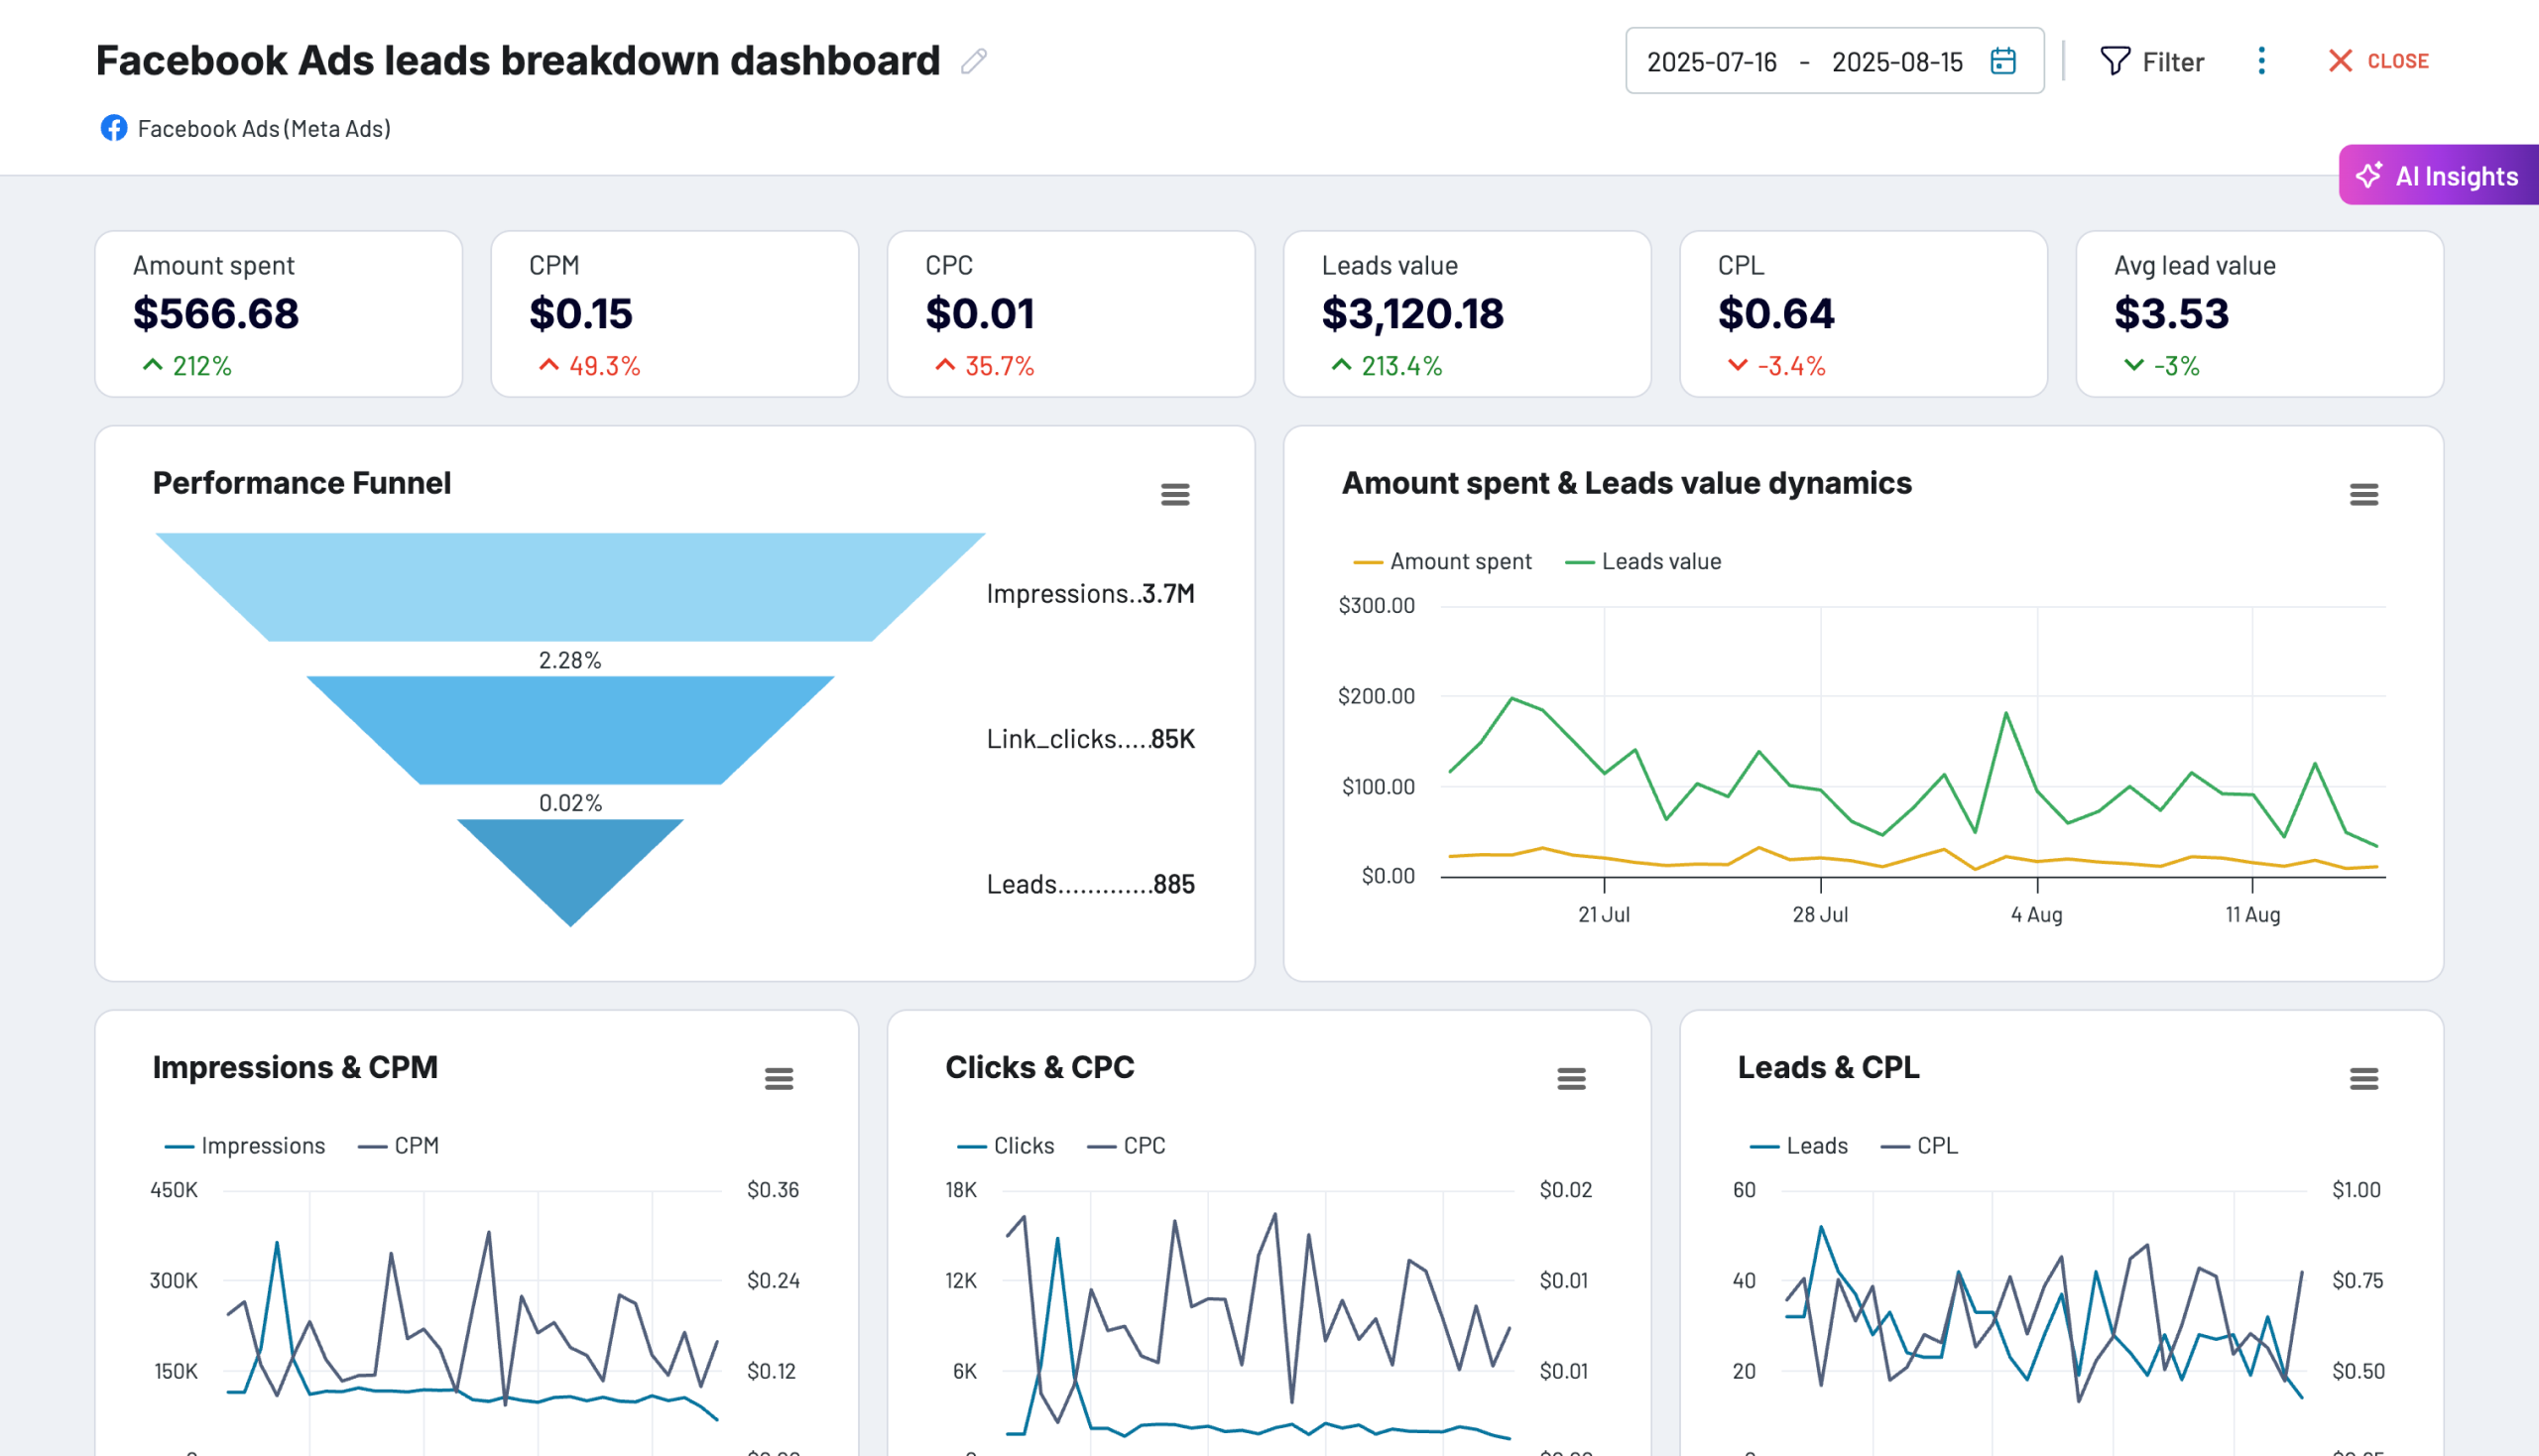
The lead generation performance report tracks the complete advertising funnel from impressions through to qualified leads, with particular focus on lead value metrics. This report visualizes how ad impressions convert to clicks and ultimately to captured leads, correlating lead generation with lead value over time against advertising spend. Month-to-month analysis identifies campaigns delivering valuable leads versus high-volume-low-quality sources. Demographic and geographic breakdowns reveal which audience segments and regions produce the most cost-effective leads, enabling precise targeting and budget allocation decisions.
The customer acquisition funnel report bridges marketing activity and CRM outcomes by tracking the path from advertising impressions to qualified opportunities in your sales pipeline. Integrating data from advertising platforms with Google Analytics 4 and CRM systems like HubSpot, Pipedrive, or GoHighLevel, this report shows conversion rates at each stage. Monthly breakdowns reveal seasonal patterns and correlate opportunity spikes with specific campaigns. Platform comparison identifies which channels deliver the highest visitor-to-opportunity conversion rates, while cost per opportunity calculations optimize budget allocation based on actual pipeline contribution.
The e-commerce conversion funnel report tracks the customer journey from advertising exposure to completed purchases, combining advertising metrics with website analytics and transaction data. Weekly performance breakdowns provide granularity for identifying short-term trends. The report displays advertising spend, impressions, and clicks alongside Google Analytics 4 traffic data, connected to WooCommerce or Shopify sales showing orders, revenue, and new customer acquisition. Multiple correlation charts reveal relationships between spend versus sales, order volume versus average order value, and platform-specific performance, enabling quick budget adjustments.
The geographic funnel performance report breaks down conversion paths by country, revealing how customer behavior varies across markets. Interactive maps display funnel metrics at each stage—page views, cart additions, checkout initiation, payment entry, and purchases—with separate data per region. Country-level tables compare conversion rates between markets and identify regions with high traffic but low conversion requiring localized optimization. This geographic lens helps prioritize international marketing investments, identify region-specific shipping or payment issues, and tailor experiences to address local preferences and behaviors.
What insights you can get with the funnel dashboard
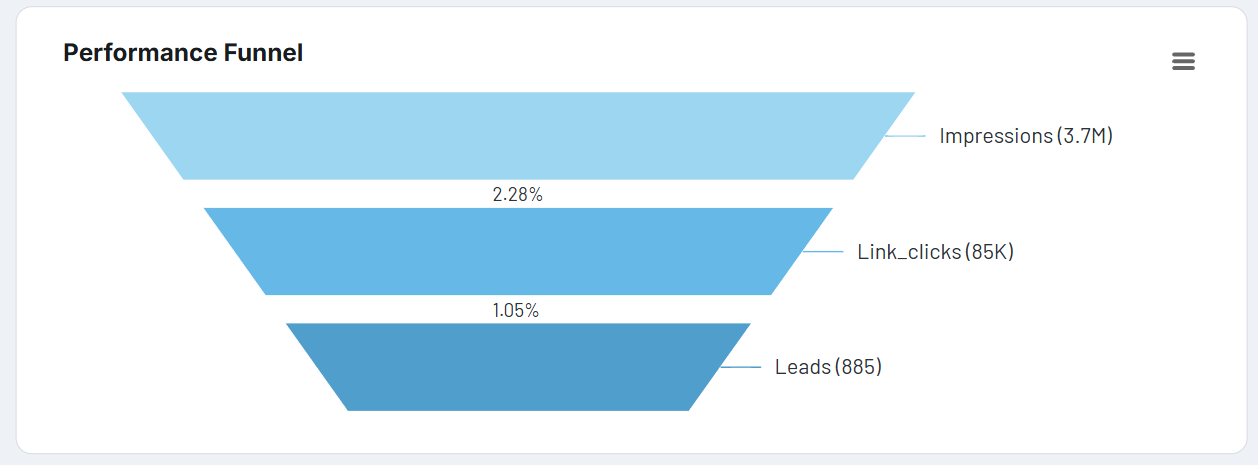
The lead funnel dashboard tracks not just lead volume but lead value dynamics over time, showing how the worth of generated leads correlates with advertising investment. This visualization reveals whether increased spending generates proportionally valuable leads or if there are diminishing returns beyond certain budget thresholds. The funnel progresses from impressions through clicks to leads, with lead value metrics displayed alongside cost data to calculate true ROI rather than just cost per lead.
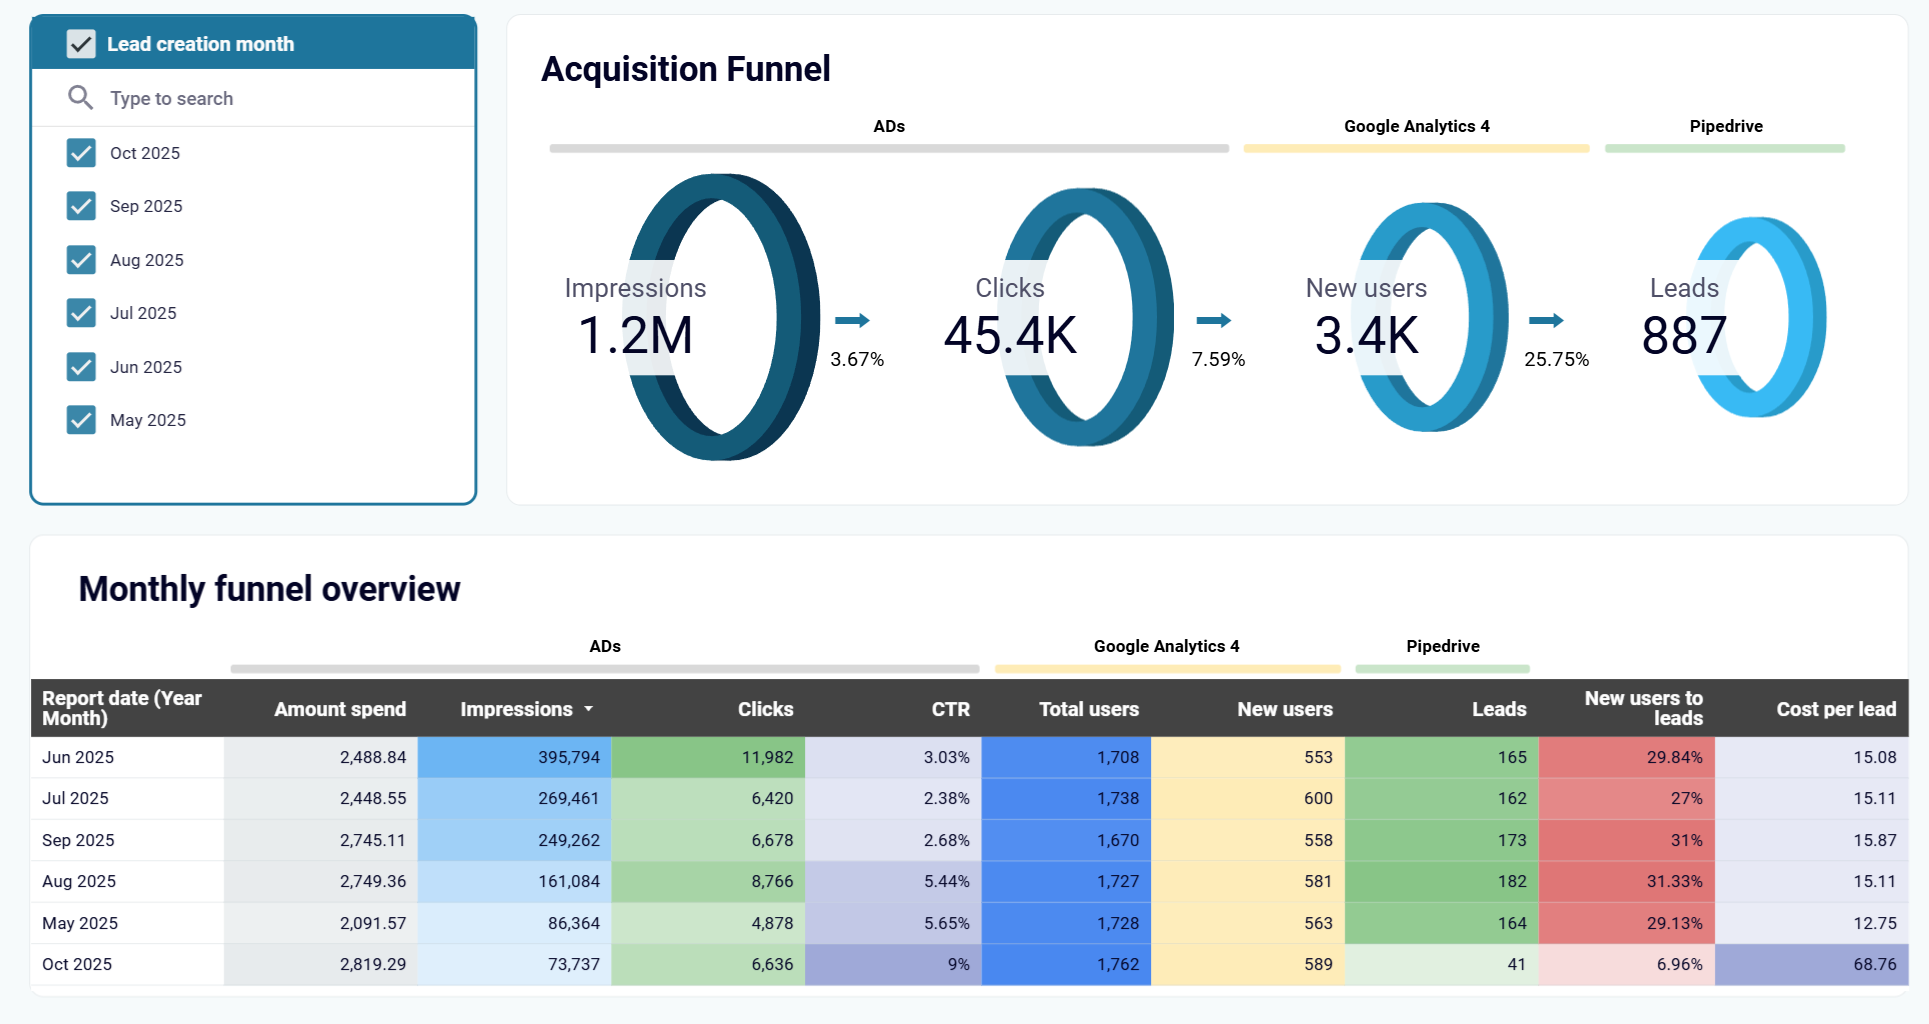
Tracking funnel performance month-over-month exposes patterns in conversion efficiency and helps identify which time periods or campaigns drive the strongest results. The conversion funnel dashboard displays the complete path from advertising impressions through website visits to CRM opportunities, with detailed monthly breakdowns combining spend, traffic, and conversion data. This temporal view reveals seasonal trends, helps forecast future performance based on historical patterns, and makes it simple to replicate successful campaign strategies.

Understanding how advertising translates to actual sales requires weekly granularity, combining ad platform metrics, website traffic, and transaction data. This funnel dashboard template displays the complete e-commerce journey from impressions to new customer acquisition with weekly performance tables showing advertising spend, impressions, clicks, CTR from multiple platforms, total users and new users from GA4, plus total sales, orders, and new customers from your store. The weekly view provides the responsiveness needed to quickly identify and address conversion rate drops.
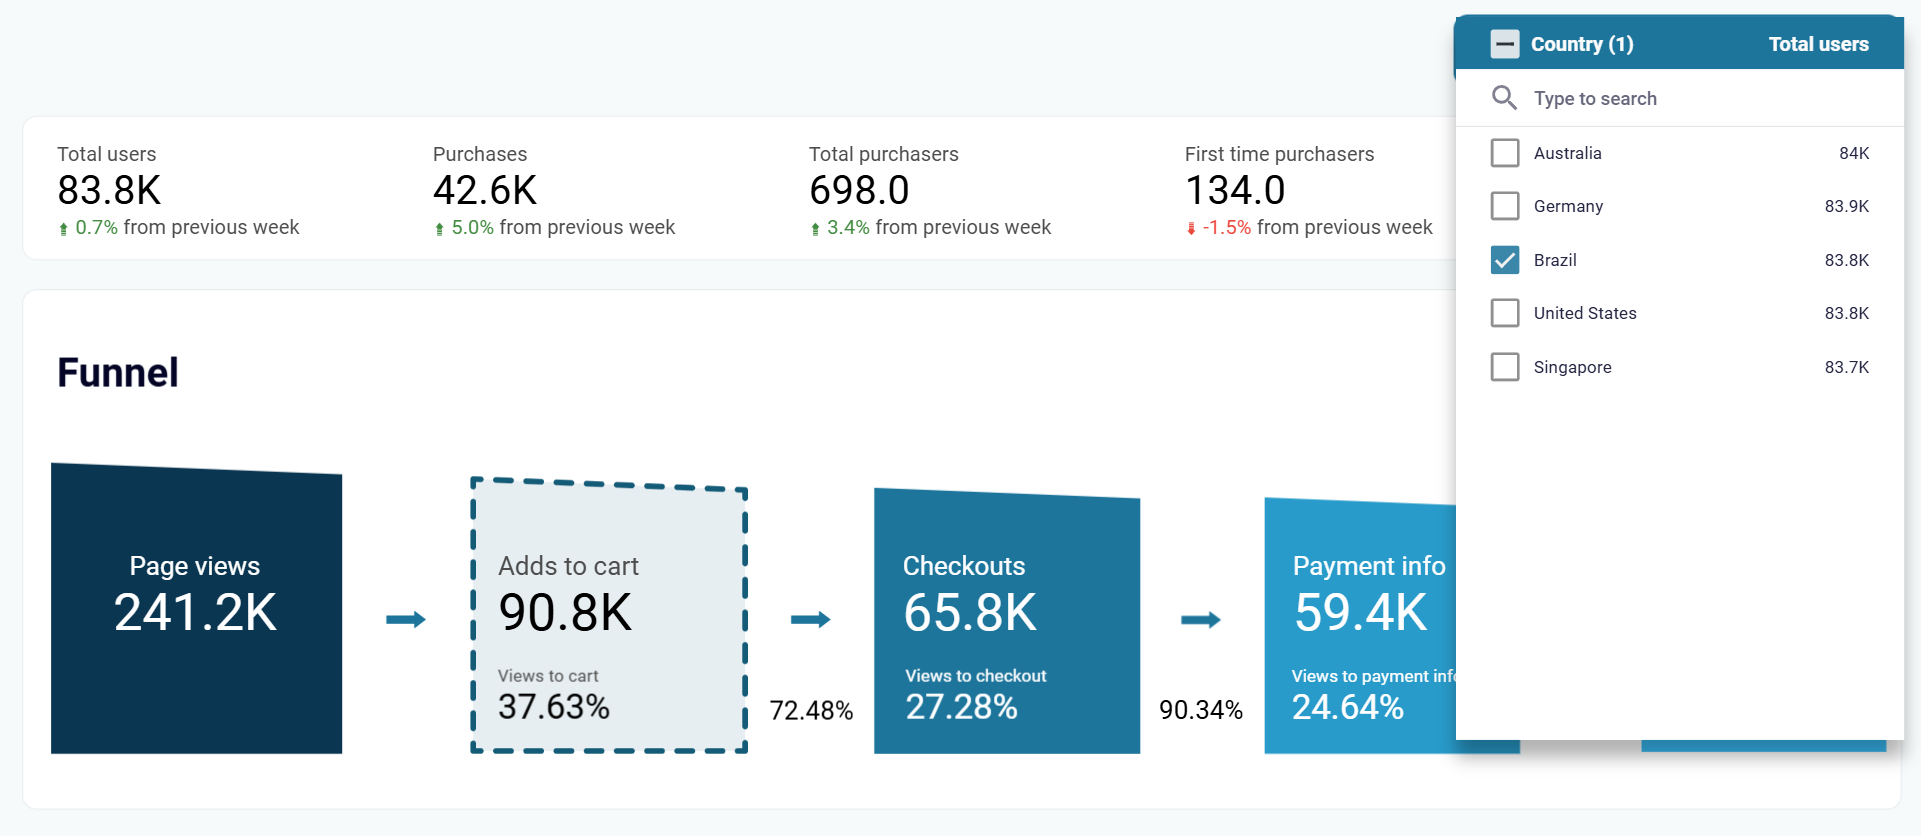
Sales funnel performance varies significantly across geographic markets, with different countries showing distinct drop-off patterns at various stages. The funnel dashboard template presents an interactive geographic view showing how customers in each country progress from page views through cart additions, checkout initiation, and payment entry to completed purchases. Country-level funnel tables display conversion rates at each stage, helping identify markets where specific improvements would have the greatest impact on overall sales performance.
How to create a funnel dashboard?

Metrics you can track with a funnel dashboard template
The percentage of ad impressions that result in user clicks reveals the effectiveness of your ad creative and targeting. This metric sits at the top of most funnels and indicates how well your messaging resonates with your target audience before they reach your website. Tracking this rate across different campaigns, demographics, and geographic regions helps optimize ad creative and audience targeting for maximum engagement.
This metric measures what percentage of users who click your ads actually become leads by completing forms or other conversion actions. A healthy clicks-to-leads rate indicates strong alignment between ad messaging and landing page content, while a low rate suggests disconnect between what ads promise and what landing pages deliver. Campaign-level tracking of this metric helps identify which message-to-page combinations work best.
For B2B companies, tracking how many website visitors become qualified opportunities in your CRM reveals the effectiveness of your lead qualification process. This metric connects marketing activity to sales pipeline, showing which traffic sources deliver visitors most likely to become viable prospects. Month-over-month tracking helps assess whether marketing quality improves over time or if volume increases come at the expense of lead quality.
This end-to-end metric shows the complete effectiveness of your e-commerce funnel from initial ad exposure through completed transaction. While naturally lower than intermediate conversion rates, tracking this metric reveals the true ROI of advertising campaigns. Comparing this rate across different products, geographic markets, and advertising platforms helps identify where to focus optimization efforts for maximum revenue impact.
For e-commerce businesses, this metric reveals product page effectiveness in convincing browsers to take the first concrete purchasing action. A strong page-view-to-cart rate indicates compelling product presentation, while a weak rate suggests issues with product descriptions, pricing, images, or trust signals. Product-level tracking of this metric helps prioritize which items need merchandising improvements.
This mid-funnel metric shows what percentage of users who add products to cart actually proceed to checkout. Drop-off at this stage often relates to unexpected costs revealed in the cart, limited payment options, or complicated checkout processes. Geographic tracking of this rate can reveal region-specific issues like unavailable shipping methods or unsupported payment types.
Measuring how many users who begin checkout actually reach the payment entry stage reveals friction in your checkout process. High drop-off between these stages suggests excessive form fields, unclear instructions, security concerns, or technical issues. A/B testing guided by this metric helps identify the optimal checkout flow for converting intent into completed purchases.
Beyond simple lead volume, tracking how much each campaign spends to acquire a single lead enables accurate budget allocation decisions. This metric becomes particularly valuable when combined with lead value data, as campaigns with higher cost per lead may still deliver better ROI if their leads convert to higher-value customers. Platform comparison using this metric reveals which advertising channels deliver the most cost-effective lead generation.
For businesses with longer sales cycles, tracking cost per qualified opportunity rather than just cost per lead provides more accurate ROI measurement. This metric accounts for lead quality differences across channels, showing which sources deliver visitors most likely to become viable sales prospects. Comparing cost per opportunity against historical close rates and deal values helps forecast revenue impact of marketing spend.
Understanding which marketing channels drive higher-value purchases rather than just more purchases helps optimize budget toward revenue rather than transaction volume. This metric reveals whether certain platforms attract more premium customers or if specific campaigns successfully promote higher-value products. Combined with customer acquisition cost data, average order value determines true channel profitability.