Facebook dashboard examples and reporting templates
Gain complete visibility into your Facebook page performance with automated Facebook reporting dashboards that consolidate data from Facebook Pages. Track reach metrics, monitor audience engagement, analyze content performance, and make strategic decisions based on real-time insights from your Facebook marketing platform.
Examples of Facebook dashboards for every need


about your case. It doesn't cost you a penny 😉
Choose your white label Facebook dashboard to kick off
What is a Facebook dashboard?
Facebook marketing dashboards can offer more than the native Facebook Insights and allow you to track page engagement over time, monitor audience growth, analyze post performance, and identify content optimization opportunities. With automated data refreshing through Coupler.io, Facebook dashboard templates ensure you're always working with the most up-to-date information without manual data exports or consolidation. It creates a single source of truth for your Facebook performance metrics.

What reports should be included on a meaningful Facebook analytics dashboard?
A comprehensive Facebook pages dashboard should include several key reports that provide complete visibility into your page's performance. Based on our analysis of Facebook dashboards, we recommend incorporating these four essential report types:
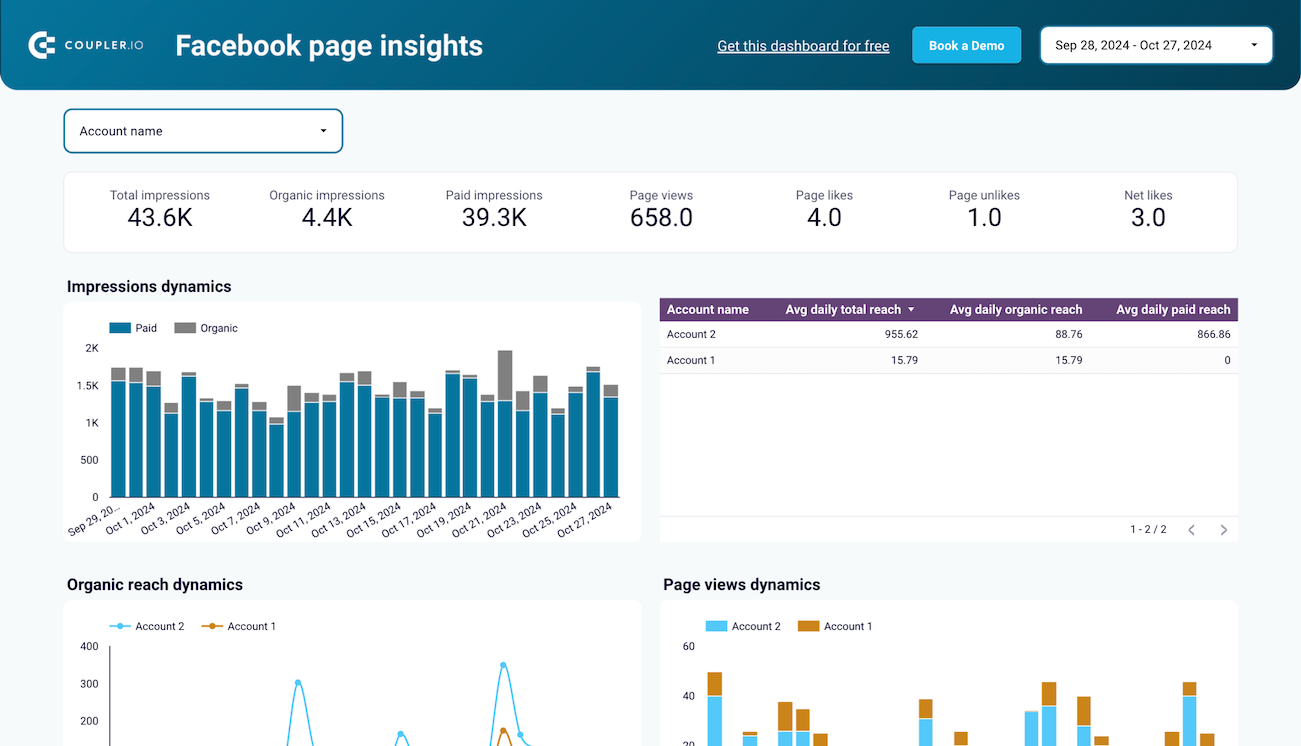
The engagement overview report provides a clear picture of how your audience interacts with your page. It tracks organic impressions alongside paid impressions, allowing you to distinguish between the impact of your organic content and paid promotions. This report also includes a breakdown of page views, showing how frequently users visit your page and engage with its content. By monitoring these metrics over time, you can identify trends in audience engagement and adjust your content strategy accordingly.
The audience demographics report breaks down your page likes by geographic location, giving you valuable insights into where your followers are based. This geographical breakdown is presented as an interactive map that highlights countries with the highest concentration of page likes. Understanding your audience's geographic distribution helps refine your targeting strategies, optimize content timing for different time zones, and identify potential markets for expansion. This data is crucial for creating more relevant, audience-specific content.
The content performance report provides a detailed analysis of your recent posts, showcasing metrics like impressions, reach, shares, and various reactions (likes, loves, wows, etc.). This comprehensive overview helps you understand which content types and topics generate the most engagement. By comparing performance across different post formats, publishing times, and content themes, you can identify patterns that indicate what resonates best with your audience. This insight is invaluable for developing a more effective content calendar.
The reach analytics report tracks the dynamics of organic reach and total reach over time, allowing you to measure how effectively your content is spreading across the Facebook platform. By visualizing these metrics side by side, you can quickly identify any fluctuations or trends that might indicate algorithm changes or shifts in audience behavior. This report helps you evaluate the true visibility of your content and make data-driven adjustments to maximize your organic reach potential.
What insights you can get with a Facebook reporting dashboard
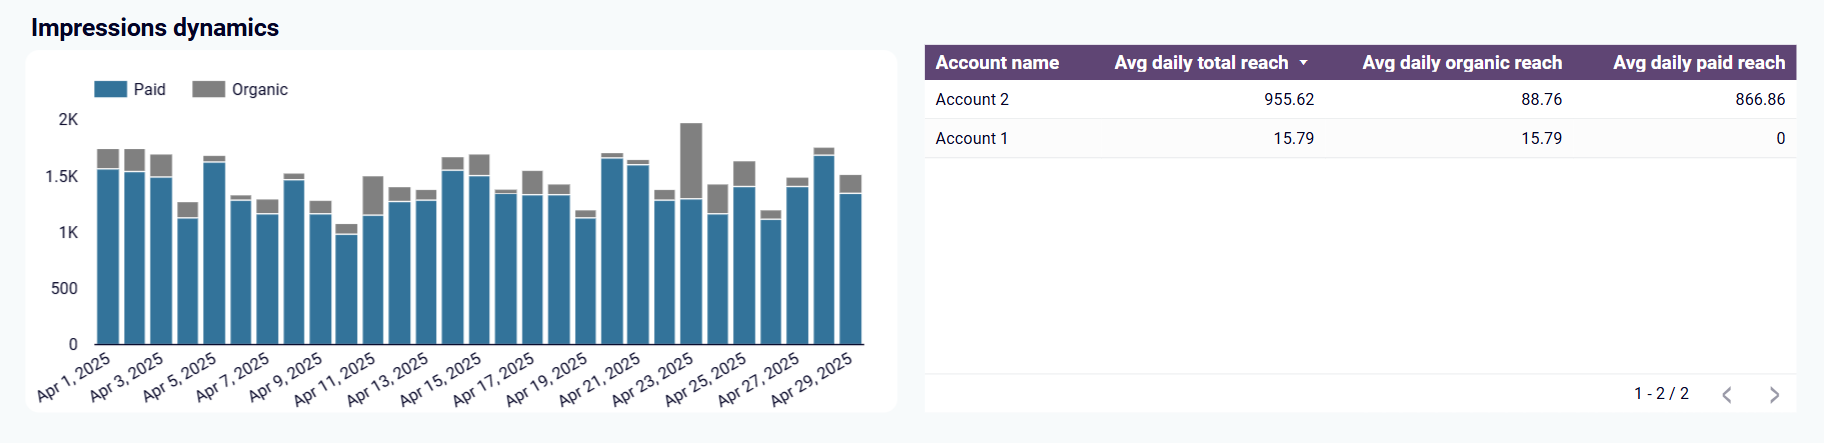
The Facebook dashboard provides clear visualization of both organic and paid impressions over time, allowing you to identify patterns and benchmark performance against previous periods. With this insight, you can spot seasonal fluctuations, assess the impact of content changes, and understand when your audience is most active. This data-driven approach helps optimize posting schedules and content strategy to maximize engagement with your page.
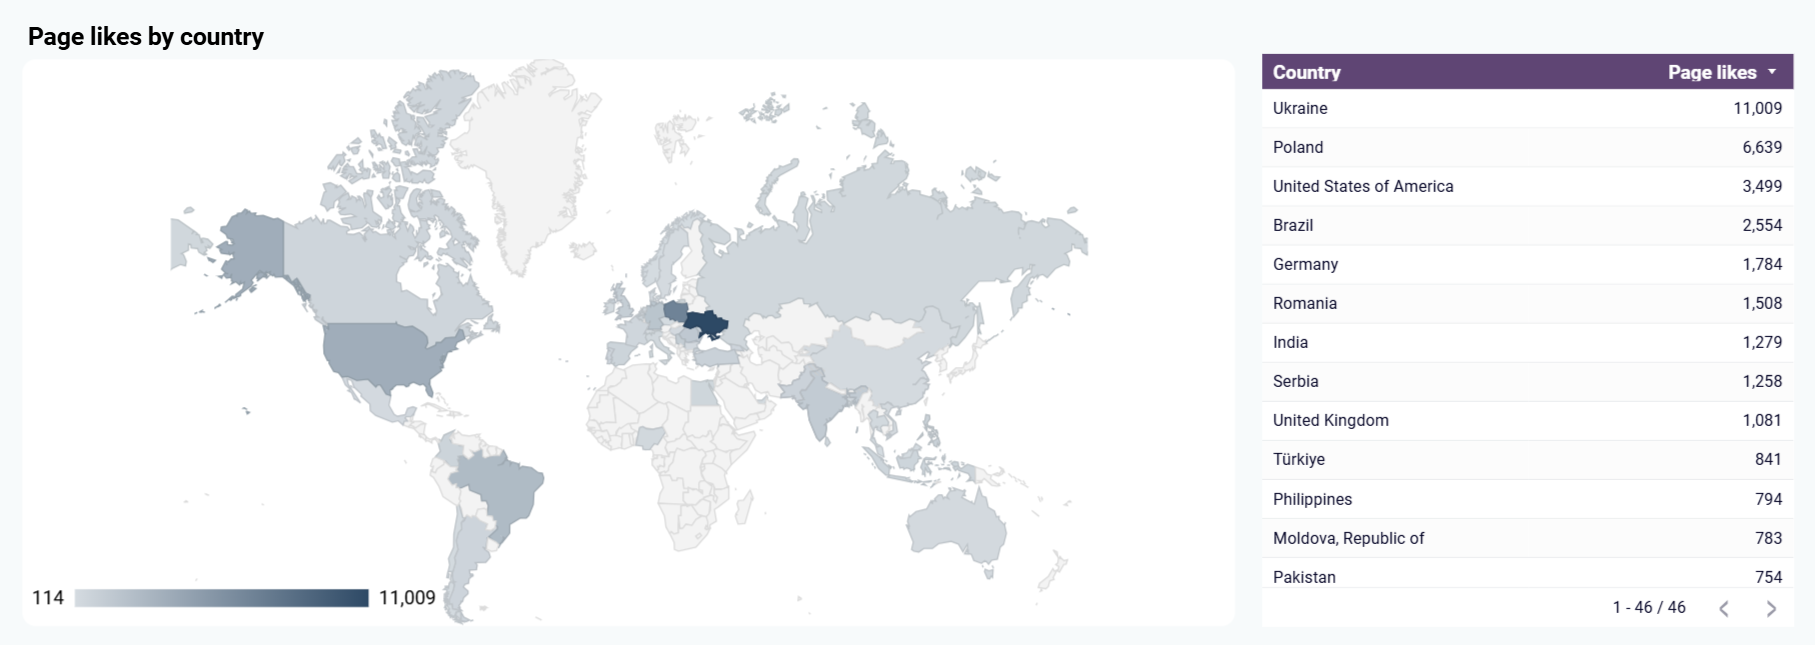
The dashboard's interactive map visualization breaks down page likes by country, revealing exactly where your audience is concentrated. This geographical intelligence helps you tailor content to specific regional interests, schedule posts during optimal hours for your most valuable territories, and identify untapped markets for expansion. By understanding your global audience distribution, you can create more relevant, localized content strategies.
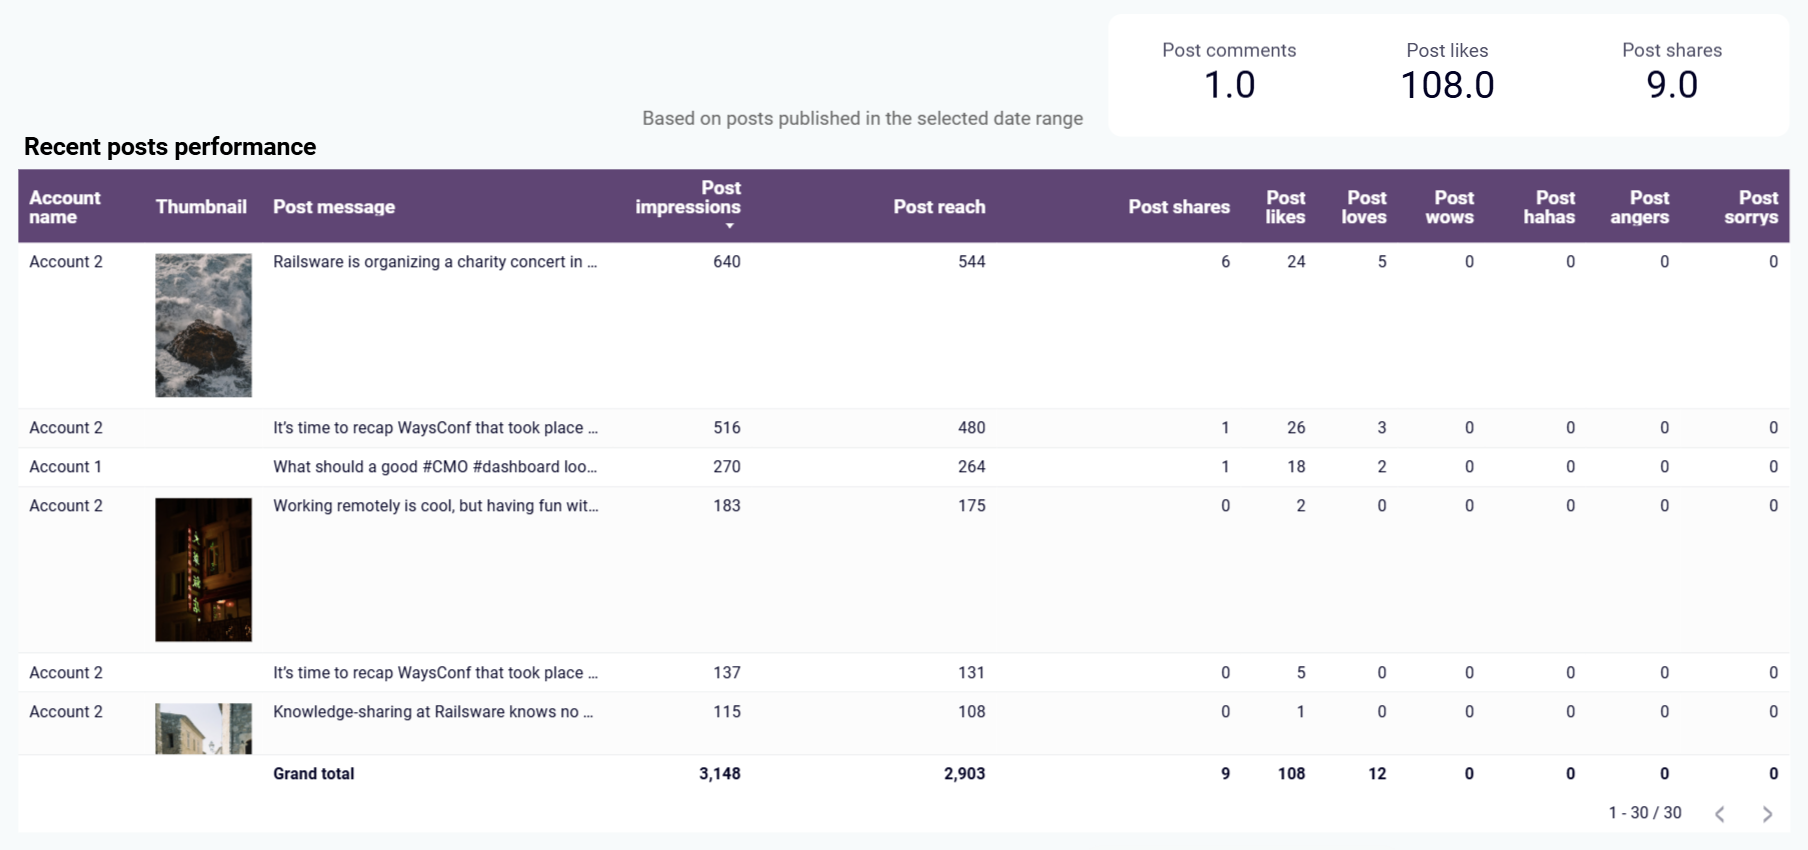
The recent post performance table provides comprehensive metrics for each piece of content, including impressions, reach, shares, and reactions. This detailed breakdown helps you quickly identify which posts generated the most engagement and understand why they resonated with your audience. By analyzing these patterns, you can refine your content approach, replicate successful formats, and eliminate underperforming content types from your strategy.
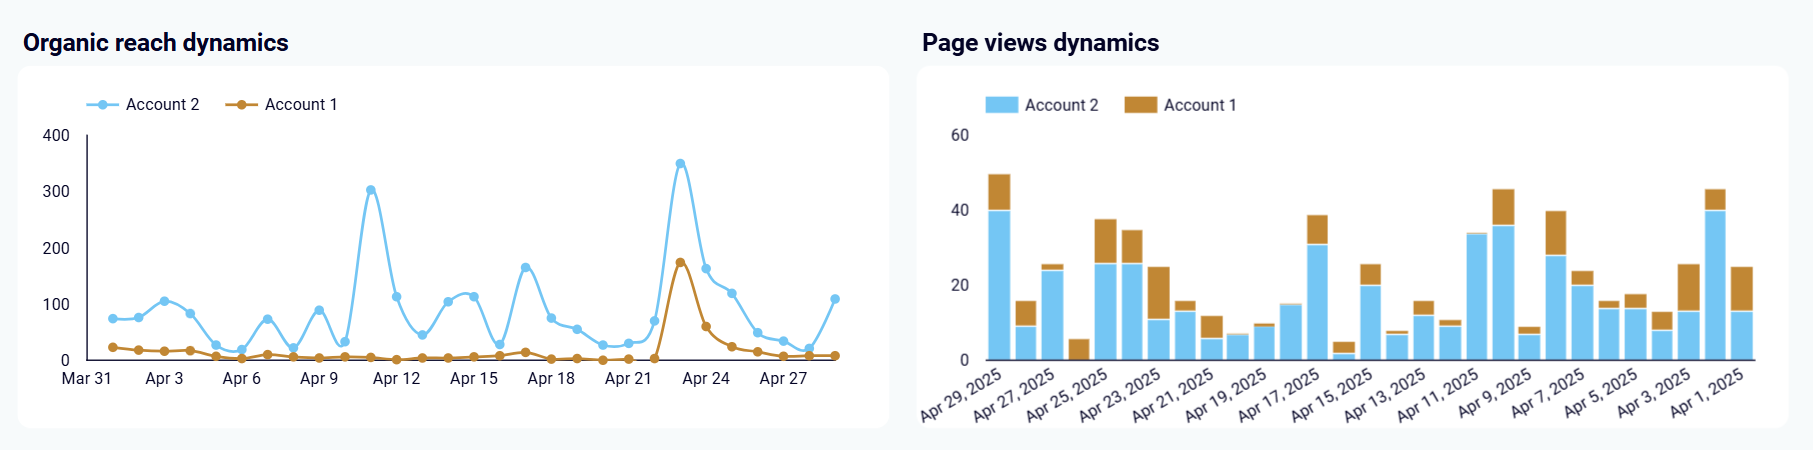
The dashboard's organic reach and page views charts show how your content visibility evolves over time, providing crucial context for your overall Facebook marketing strategy. By comparing organic reach with total reach, you can assess how effectively your content spreads naturally versus through paid promotion. This insight helps you balance organic and paid strategies, identify content with viral potential, and optimize your approach to maximize visibility within Facebook's algorithm.
How to create a Facebook dashboard?

Metrics you can track with a Facebook dashboard template
Monitor the number of times your page content was displayed organically in users' news feeds without paid promotion. This metric helps you understand your natural reach on the platform and evaluate how well your content performs within Facebook's algorithm. By tracking organic impressions over time, you can identify which types of posts have the greatest organic visibility and adjust your content strategy accordingly.
Track how many times users visit your Facebook page, providing insight into audience interest beyond news feed impressions. This metric helps identify spikes in curiosity about your brand and determines whether specific posts or external factors drive people to explore your page more deeply. Analyzing page view trends alongside other engagement metrics gives you a more complete understanding of how users interact with your brand on Facebook.
Monitor the growth of your audience base by tracking new page likes alongside unlikes. This net growth metric helps you understand audience retention and identify potential issues with content strategy when unlikes increase. By correlating likes and unlikes with specific posts or campaigns, you can determine which content types attract new followers and which might alienate existing ones.
Measure how many unique users saw your posts, providing a clearer picture of content visibility than impressions (which count multiple views by the same person). This metric helps you understand your actual audience size and evaluate how effectively your content spreads beyond your immediate follower base. Analyzing reach trends helps identify which content types have the greatest potential to expand your audience.
Track comprehensive engagement metrics including likes, comments, shares, and clicks, to measure how compelling your content is to your audience. This multi-dimensional engagement data helps you understand not just how many people see your content, but how they interact with it. By analyzing which posts generate which types of engagement, you can optimize your content to encourage the specific user behaviors that align with your marketing goals.
Analyze the specific reactions (like, love, wow, haha, sad, angry) your posts receive to gauge emotional responses to your content. This nuanced metric provides deeper insight than simple like counts, helping you understand the emotional impact of different content types. By tracking reaction patterns, you can create content that deliberately evokes specific emotional responses aligned with your brand messaging goals.
Monitor how frequently users share your content with their own networks, indicating content that resonates strongly enough for audiences to associate with personally. This powerful amplification metric helps identify your most valuable content—posts that audiences find worthy of redistributing to their peers. By analyzing shared content characteristics, you can create more posts with viral potential.
Visualize where your page followers are located with country-level breakdowns. This demographic insight helps tailor content to regional preferences, optimize posting times for different time zones, and identify opportunities for localized campaigns. Understanding the geographic spread of your audience enables more targeted, relevant content strategies that account for cultural and regional differences.