Conversion rate dashboard examples and reporting templates
Transform your marketing performance with automated conversion dashboard templates that track user behavior across all touchpoints. Monitor keyword conversion rates, analyze landing page effectiveness, and measure traffic quality from sources like YouTube to maximize your lead conversion dashboard insights and revenue growth.
Conversion rate dashboard examples for every need


about your case. It doesn't cost you a penny 😉
Choose your white label conversion rate dashboard to kick off
What is a conversion dashboard?
The dashboard connects Google Search Console performance metrics with Google Analytics 4 user behavior data, revealing the complete journey from first click to final conversion. Through automated data refreshing via Coupler.io, your conversion dashboard maintains real-time accuracy across multiple marketing channels. As a result, you can spot performance drops, identify high-converting keywords, and optimize landing pages based on actual user engagement patterns rather than assumptions.

What reports should be included on a conversion rate dashboard?
Effective conversion rate optimization depends on having the right data at your fingertips. The most successful conversion dashboards integrate reports that reveal not just what's happening, but why visitors convert or abandon their journey. Our experience with conversion tracking across thousands of campaigns shows that three core report categories consistently deliver actionable insights for improving conversion performance and identifying revenue opportunities.
The keyword performance report forms the foundation of effective conversion rate optimization by tracking how individual search terms drive actual business results. This report monitors impressions, clicks, conversion rates, and cost-per-conversion for each keyword cluster. This allows you to identify which terms generate the highest-value traffic. Beyond basic metrics, it reveals seasonal conversion patterns and performance changes over time. As a result, you can detect issues like declining click-through rates or rising competition before they impact your bottom line. The integration with Google Ads data provides insights into search impression share drops. This enables marketers to make proactive budget adjustments and maintain visibility for their best-converting keywords.
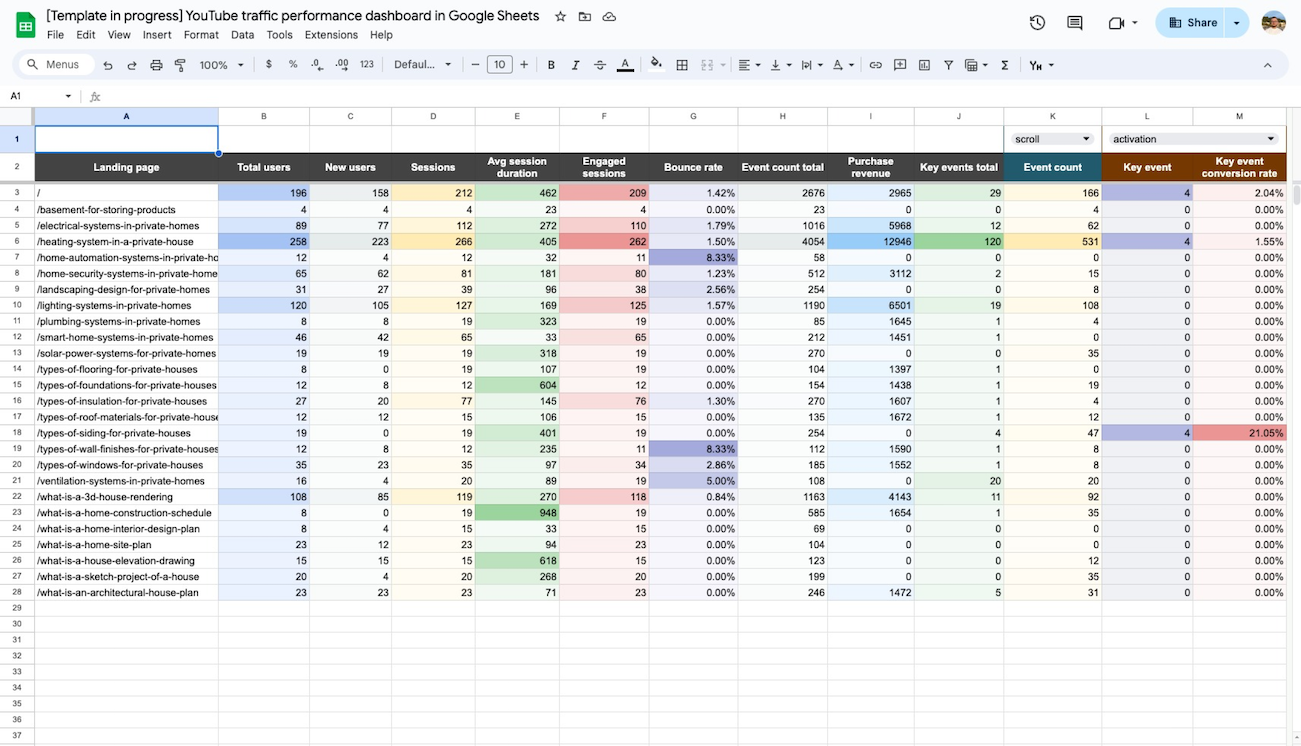
Landing page performance report reveals which pages effectively convert visitors into customers. It combines Google Search Console visibility metrics with Google Analytics 4 user behavior data. As a result, you can track clicks, impressions, average search position, and click-through rates alongside engagement metrics like bounce rate, session duration, and key event completions. The analysis identifies your top-performing pages by clicks, key events, and purchase revenue, while simultaneously highlighting conversion bottlenecks where high traffic fails to translate into business outcomes. This dual-source approach provides the context needed to optimize both search visibility and on-page conversion elements.
The traffic source analysis report examines conversion quality across different channels, with particular focus on understanding how platforms like YouTube drive website conversions. This report tracks user behavior patterns, including engagement time, bounce rates, and revenue generation from specific traffic sources. With this data, you can identify which channels deliver the highest-converting visitors. Monthly performance tracking reveals trends in traffic quality and conversion effectiveness. As a result, you can allocate marketing resources to the sources that generate the most valuable users rather than just the highest volume.
The monthly performance report tracks conversion trends from YouTube traffic over time to reveal seasonal patterns and campaign effectiveness. This report analyzes how visitors from YouTube videos perform month-over-month, measuring engagement time, bounce rates, and revenue generation from video-driven traffic. Monthly tracking helps identify which periods deliver the highest-converting YouTube visitors, enabling strategic video content planning and optimal timing for promotional campaigns that drive traffic from your video content to your website.
What insights you can get with the lead conversion dashboard
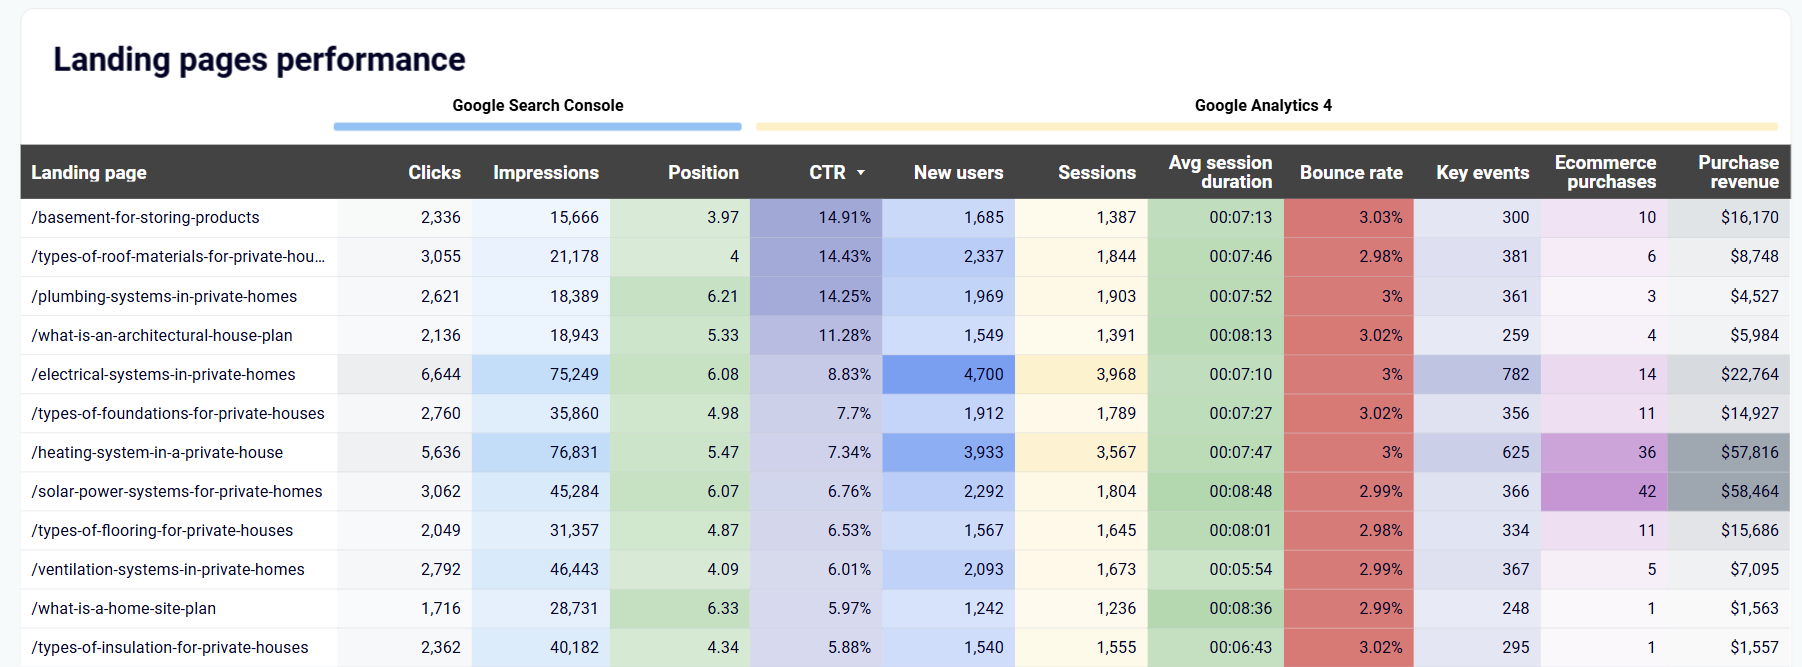
Monitor your most critical conversion touchpoints by combining Google Search Console visibility data with Google Analytics 4 user behavior metrics. The dashboard tracks clicks, impressions, average position, and CTR from search results while simultaneously measuring bounce rates, key events, and purchase revenue on your pages. This dual-perspective analysis reveals which landing pages attract the right traffic and successfully convert visitors into customers.
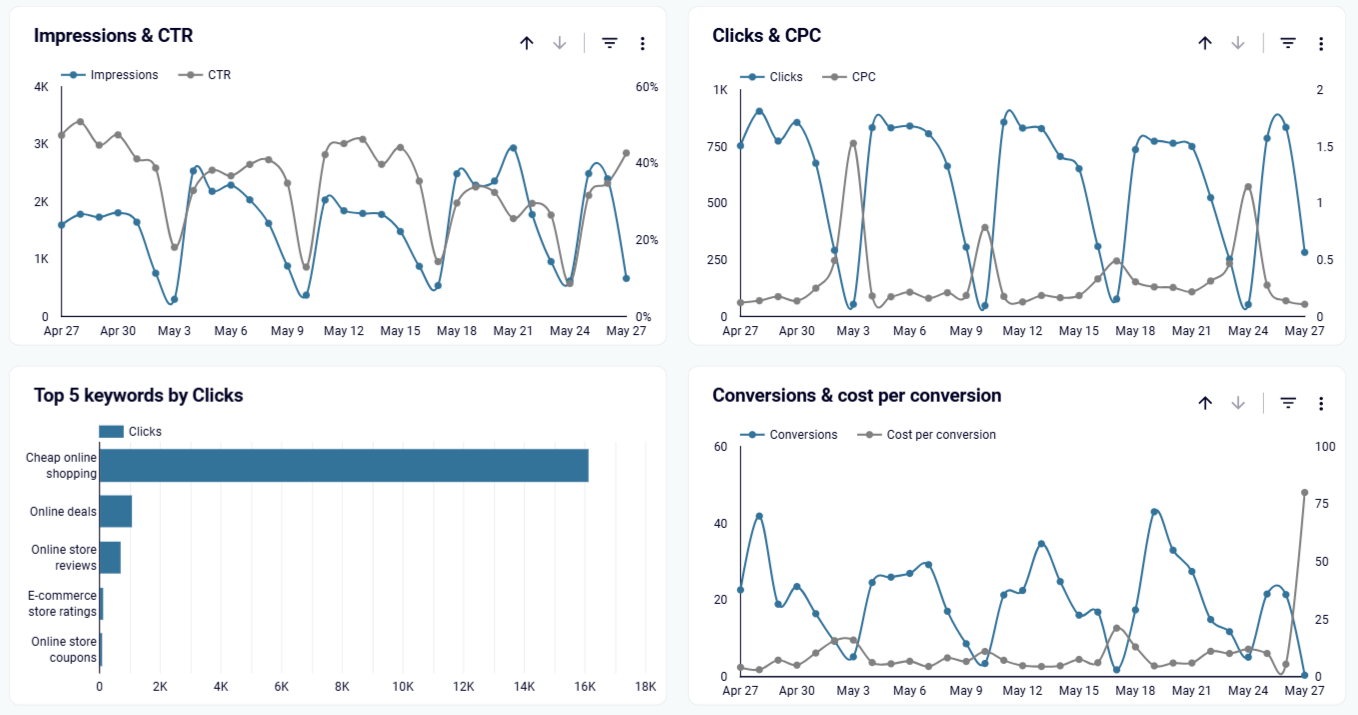
Detect conversion threats before they impact your business by monitoring how keyword impressions, CTR, clicks, and cost-per-click fluctuate over time. The dashboard automatically flags sudden drops in click-through rates that may indicate ineffective ad copy, or rising CPC that suggests increased competition. Early detection capabilities allow you to adjust campaigns, refine targeting, or increase bids before performance declines significantly affect your conversion rates.
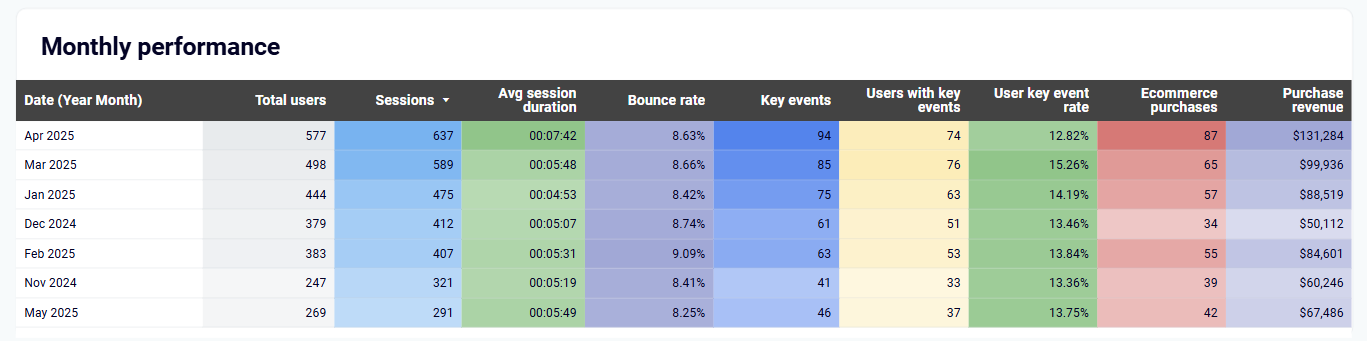
Track conversion trends and traffic quality patterns from YouTube through monthly breakdowns that reveal seasonal fluctuations and long-term performance trajectories. The dashboard shows how YouTube traffic performs month-over-month to understand when this channel consistently delivers high-converting users versus periods that generate volume without value. This insight enables strategic video content planning and campaign timing optimization for YouTube marketing efforts.
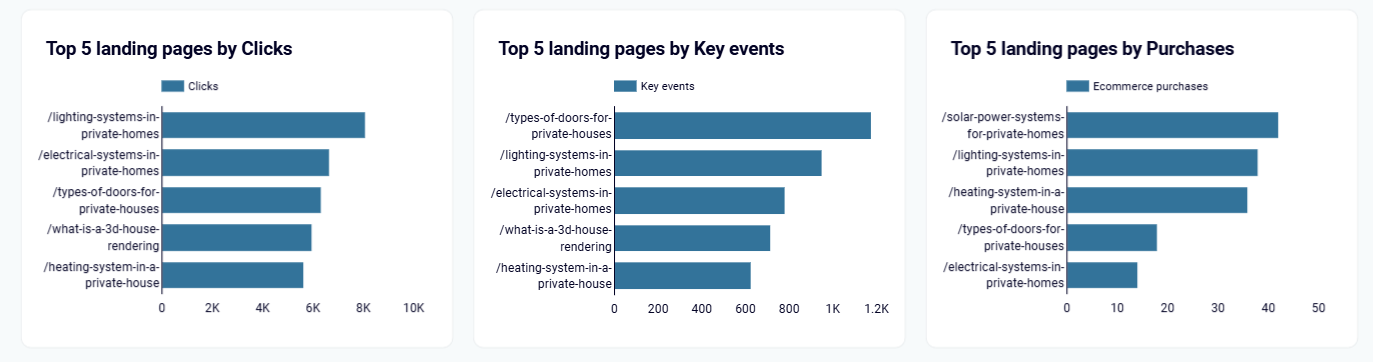
Instantly identify your highest-converting assets through automated rankings of landing pages by clicks, key events, and purchase volume. The dashboard highlights which pages generate the most valuable traffic and successful conversions, while also revealing underperforming pages that receive significant traffic but fail to convert. This insight guides content optimization priorities and helps replicate successful page elements across your site.
How to create a conversion dashboard?

Metrics you can track with a conversion rate dashboard template
Track the percentage of visitors who complete desired actions on your landing pages and campaigns. This fundamental metric reveals how effectively your marketing efforts turn traffic into customers, helping you identify high-performing pages and campaigns that deserve increased investment while spotting underperformers that need optimization.
Monitor the total number of completed conversion events across all your marketing channels and touchpoints. This metric provides the raw volume data needed to assess campaign scale and impact, enabling you to understand which traffic sources and keywords generate the most valuable user actions.
Measure the percentage of visitors who complete critical business actions like form submissions, downloads, or account registrations. This metric helps evaluate the quality of your traffic sources and identifies pages that successfully guide users toward meaningful engagement with your business.
Track important conversion activities that indicate user progression through your sales funnel, including newsletter signups, demo requests, and product inquiries. This metric reveals which pages and campaigns generate the most qualified leads and potential customers for your business.
Calculate the total revenue generated from conversions to understand the financial impact of your marketing efforts. This metric connects conversion optimization directly to business outcomes, helping prioritize campaigns and pages that deliver the highest return on investment.
Monitor completed purchase transactions to evaluate the effectiveness of your conversion funnel at driving actual sales. This metric is essential for ecommerce businesses to track which marketing channels and landing pages generate the most buying customers rather than just browsers.
Analyze the total marketing spend required to generate each conversion across different campaigns and keywords. This efficiency metric helps optimize budget allocation by identifying the most cost-effective paths to conversion and highlighting expensive campaigns that need refinement.
Track the percentage of impressions that result in clicks to measure initial engagement quality across your ads and organic listings. This early-funnel metric indicates how well your messaging resonates with target audiences and predicts downstream conversion potential.