Brand awareness dashboard examples and reporting templates
Measure how your advertising investments translate into brand recognition with an automated brand awareness reporting dashboard. These solutions connect multiple advertising platforms with Google Search Console to reveal the correlation between ad impressions and branded keyword searches, helping you optimize cross-platform campaigns and maximize brand visibility.
Brand awareness dashboard examples for every need


about your case. It doesn't cost you a penny 😉
Choose your white label brand awareness dashboard to kick off
What is a brand awareness reporting dashboard?
The dashboard provides time-series analysis of both advertising metrics and organic search patterns, helping you understand the delayed impact of brand-building campaigns. Since brand awareness effects often appear weeks or months after campaign launch, these dashboards offer historical tracking capabilities that reveal long-term trends rather than immediate conversions. Through automated data consolidation via Coupler.io, teams access real-time insights without manual reporting, enabling faster optimization decisions across multiple advertising channels.

What reports should be included in brand awareness dashboards?
Effective brand awareness reporting requires four foundational reports that connect advertising activity with brand search behavior. Each report addresses specific aspects of brand-building measurement, from geographic performance to platform-specific effectiveness.
This report consolidates impression, spend, and click data across Facebook Ads, Google Ads, and Microsoft Ads in unified visualizations. You can select which advertising metrics to display—impressions, spend, or clicks—and compare these dynamics over time. The multi-platform view reveals how combined advertising pressure across channels influences overall brand visibility.
This report tracks specific branded keywords and search queries from Google Search Console, showing impressions, clicks, CTR, and average position for terms containing your brand name. The query-level analysis reveals which branded searches are growing, which variations customers use most frequently, and how search rankings for brand terms evolve over time.
This report filters both advertising data and branded search metrics by country, enabling market-specific analysis of brand-building effectiveness. You can isolate specific geographic regions where campaigns run and examine how local advertising investments correlate with regional increases in branded searches. For businesses targeting multiple countries, this geographic breakdown reveals whether brand awareness develops uniformly across markets or if certain regions respond more strongly to advertising.
This report breaks down brand awareness impact by individual campaigns across platforms, showing which specific initiatives drive the strongest correlation with branded search growth. You can filter by campaign name from any connected advertising platform and analyze corresponding changes in branded impression and click patterns. The campaign-level view identifies your most effective brand-building strategies by comparing advertising metrics against search behavior changes during and after campaign periods.
What insights you can get with the brand awareness dashboard

Filter advertising and branded search data by country to understand regional brand-building performance. Geographic analysis reveals whether brand awareness develops uniformly across markets or if certain countries require adjusted strategies. For smaller brands, country-level filtering is necessary because aggregated data may obscure regional campaign performance patterns.
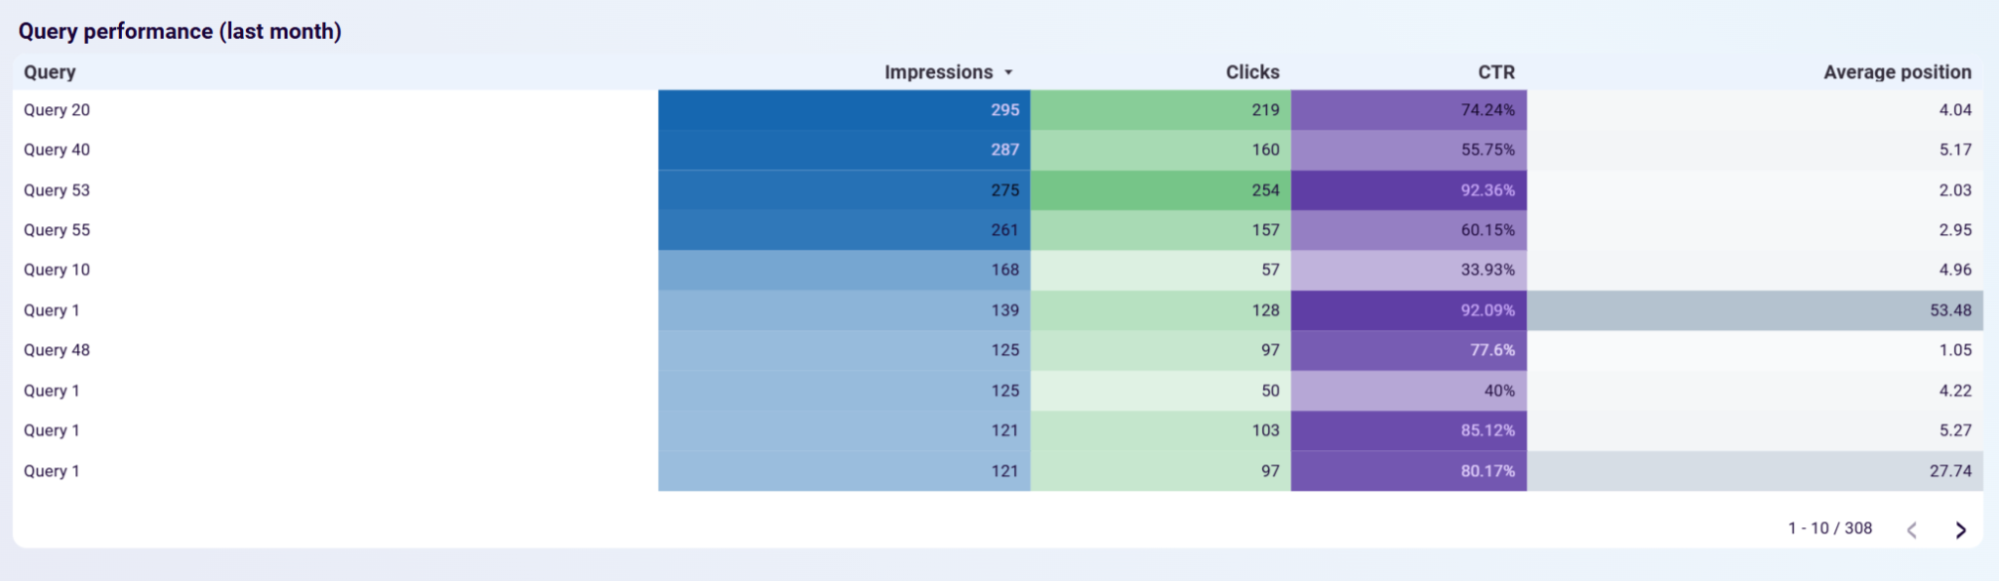
Analyze branded search queries through performance tables showing impressions, clicks, CTR, and position for each keyword variation. Query-level data reveals which branded searches gain traction and how visibility evolves. Identify high-CTR queries with lower impressions to adjust advertising messaging that reinforces specific brand associations.

Monitor Facebook, Instagram, LinkedIn, and YouTube metrics in unified performance tables showing platform-specific engagement indicators. Each social channel displays relevant metrics—from Facebook page views to YouTube watch time—enabling direct comparison of how different platforms contribute to overall brand visibility. This consolidated view eliminates switching between native platform interfaces for brand awareness assessment.
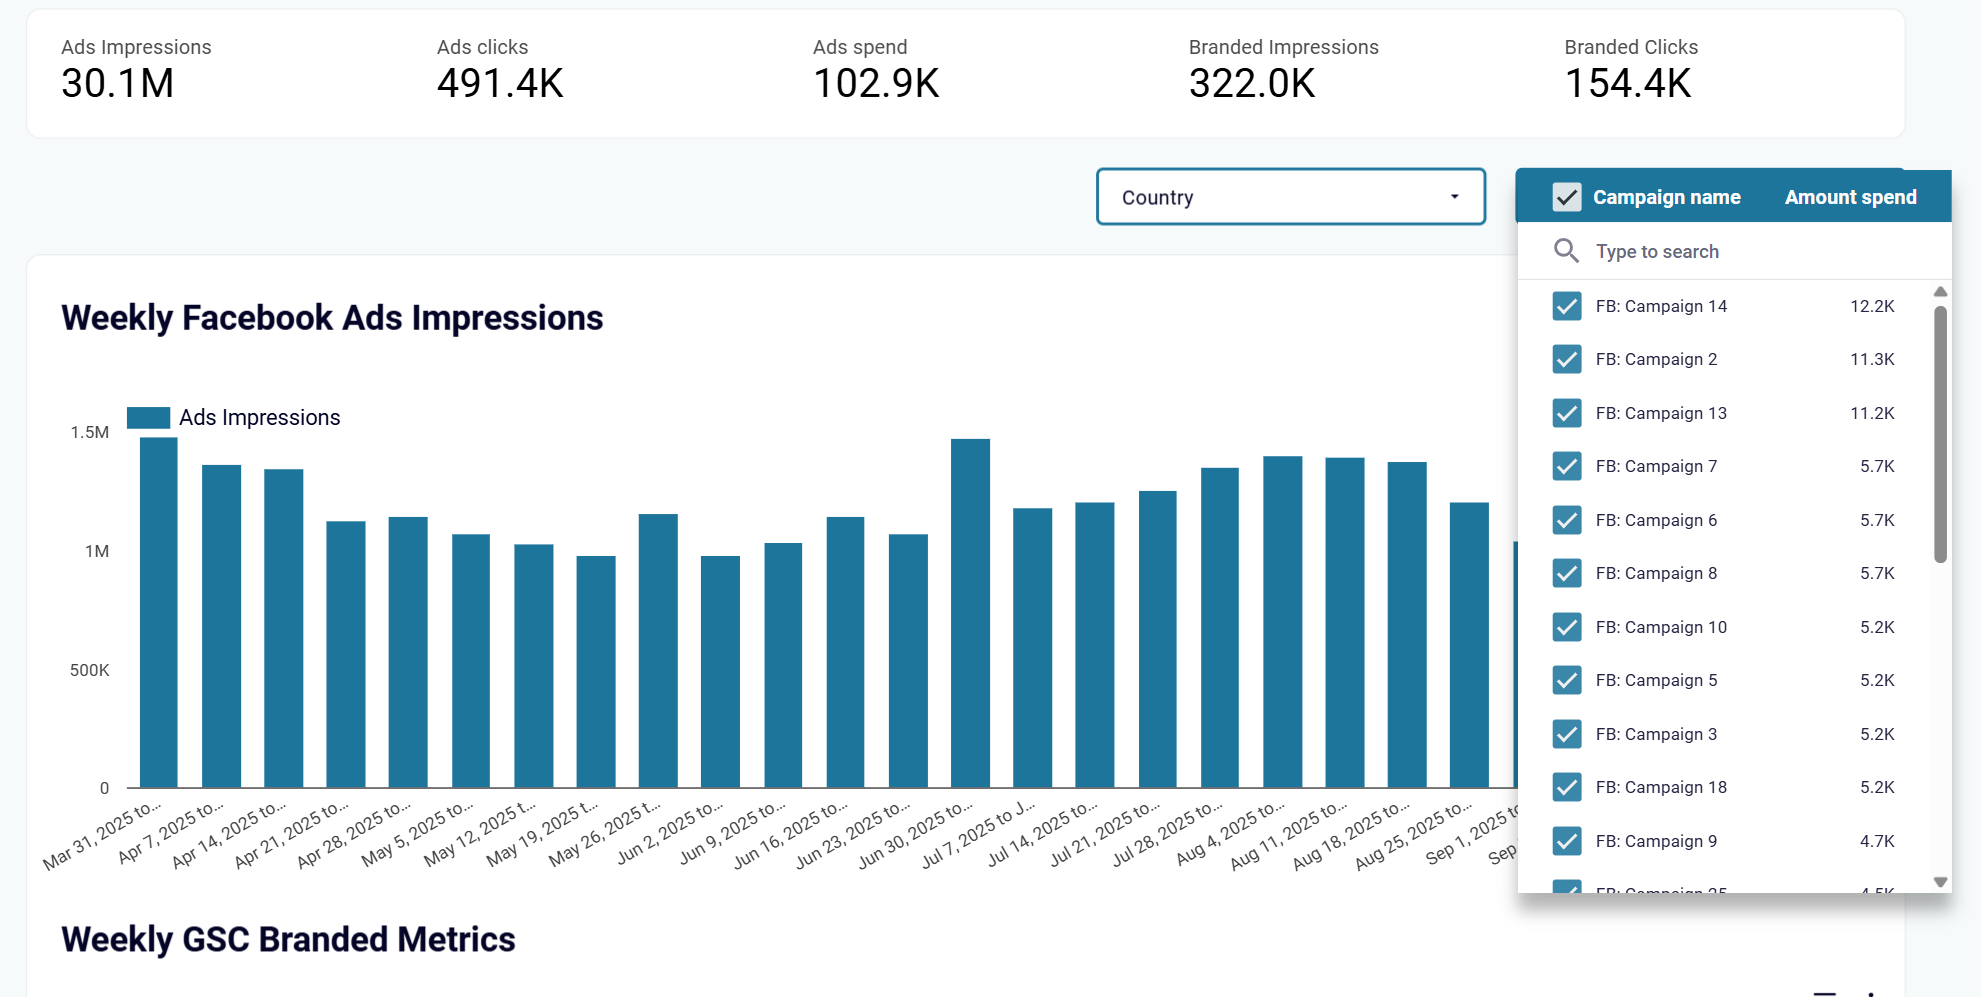
Apply campaign filters to isolate advertising initiatives and examine their impact on branded search behavior. Compare search patterns before, during, and after campaigns to identify which creative approaches and targeting strategies create lasting brand recognition. Replicate successful campaign elements across other initiatives to maximize brand-building efficiency.
How to create a brand awareness dashboard?

Metrics you can track with a brand awareness dashboard template
Monitor the total number of times your ads were displayed across Facebook Ads, Google Ads, and Microsoft Ads. This metric reveals your overall advertising reach and shows how consistently you maintain brand presence across platforms. Tracking impressions over time helps you understand whether your campaigns achieve sufficient visibility to influence brand recognition, as brand awareness typically requires repeated exposure before consumers actively search for your brand.
Track how often your brand appears in Google search results for branded queries, indicating the volume of brand-related searches. Growing branded search impressions suggest increasing brand familiarity and recognition in your target market. This organic metric serves as a key indicator of brand awareness success, as people who specifically search for your brand name demonstrate awareness that extends beyond paid advertising exposure.
Measure the number of clicks your website receives from branded search queries in Google Search Console. This metric shows not just awareness but active interest, as users who click branded search results are intentionally seeking your brand. Comparing branded clicks against branded impressions reveals how effectively your organic search presence captures interest from brand-aware audiences, with higher click rates indicating stronger brand preference.
Monitor your total investment in brand-building campaigns across connected advertising platforms. This consolidated spend metric enables ROI analysis by comparing advertising costs against branded search growth, helping you understand how much investment is required to generate measurable brand awareness increases. Tracking spend patterns over time also reveals optimal budget levels where additional investment continues driving brand recognition growth versus diminishing returns.
Calculate the percentage of branded search impressions that result in clicks to your website. High branded search CTR indicates that when people search for your brand, they find relevant results and choose to engage. Declining branded CTR despite growing impressions may signal that competitors are capturing branded search traffic or that search result presentation needs optimization to better represent your brand.
Track the average ranking position where your brand appears in Google search results for branded queries. Lower position numbers indicate higher rankings, with positions 1-3 representing top-of-page visibility. Monitoring position changes over time reveals whether increased advertising investment strengthens your organic search presence for branded terms. Declining average positions may signal growing competition for branded searches or search engine algorithm changes requiring optimization of branded content and metadata.