Billing dashboard examples and reporting templates
Automate your accounts receivable and payables tracking with billing reporting dashboards that pull data directly from QuickBooks or Xero. Visualize outstanding invoices, monitor vendor obligations, compare cash flow timing between incoming and outgoing payments, and make informed decisions about collections and disbursements based on scheduled data updates.
Billing dashboard examples for every need


about your case. It doesn't cost you a penny 😉
Choose your white label billing dashboard to kick off
What is a billing dashboard?
Our billing dashboard templates replace manual reconciliation by automating data extraction and transformation through Coupler.io. They ensure finance teams work with consistent information across multiple bank accounts and currencies. The SaaS billing dashboard approach eliminates the need to navigate through separate accounting reports, providing a single interface for monitoring both sides of your cash flow equation.

What reports should be included in billing dashboards?
Finance teams building effective billing analytics dashboard solutions need four interconnected report types that together provide complete visibility into cash position and payment obligations. Each report addresses specific decision-making needs while contributing to the broader picture of financial health.
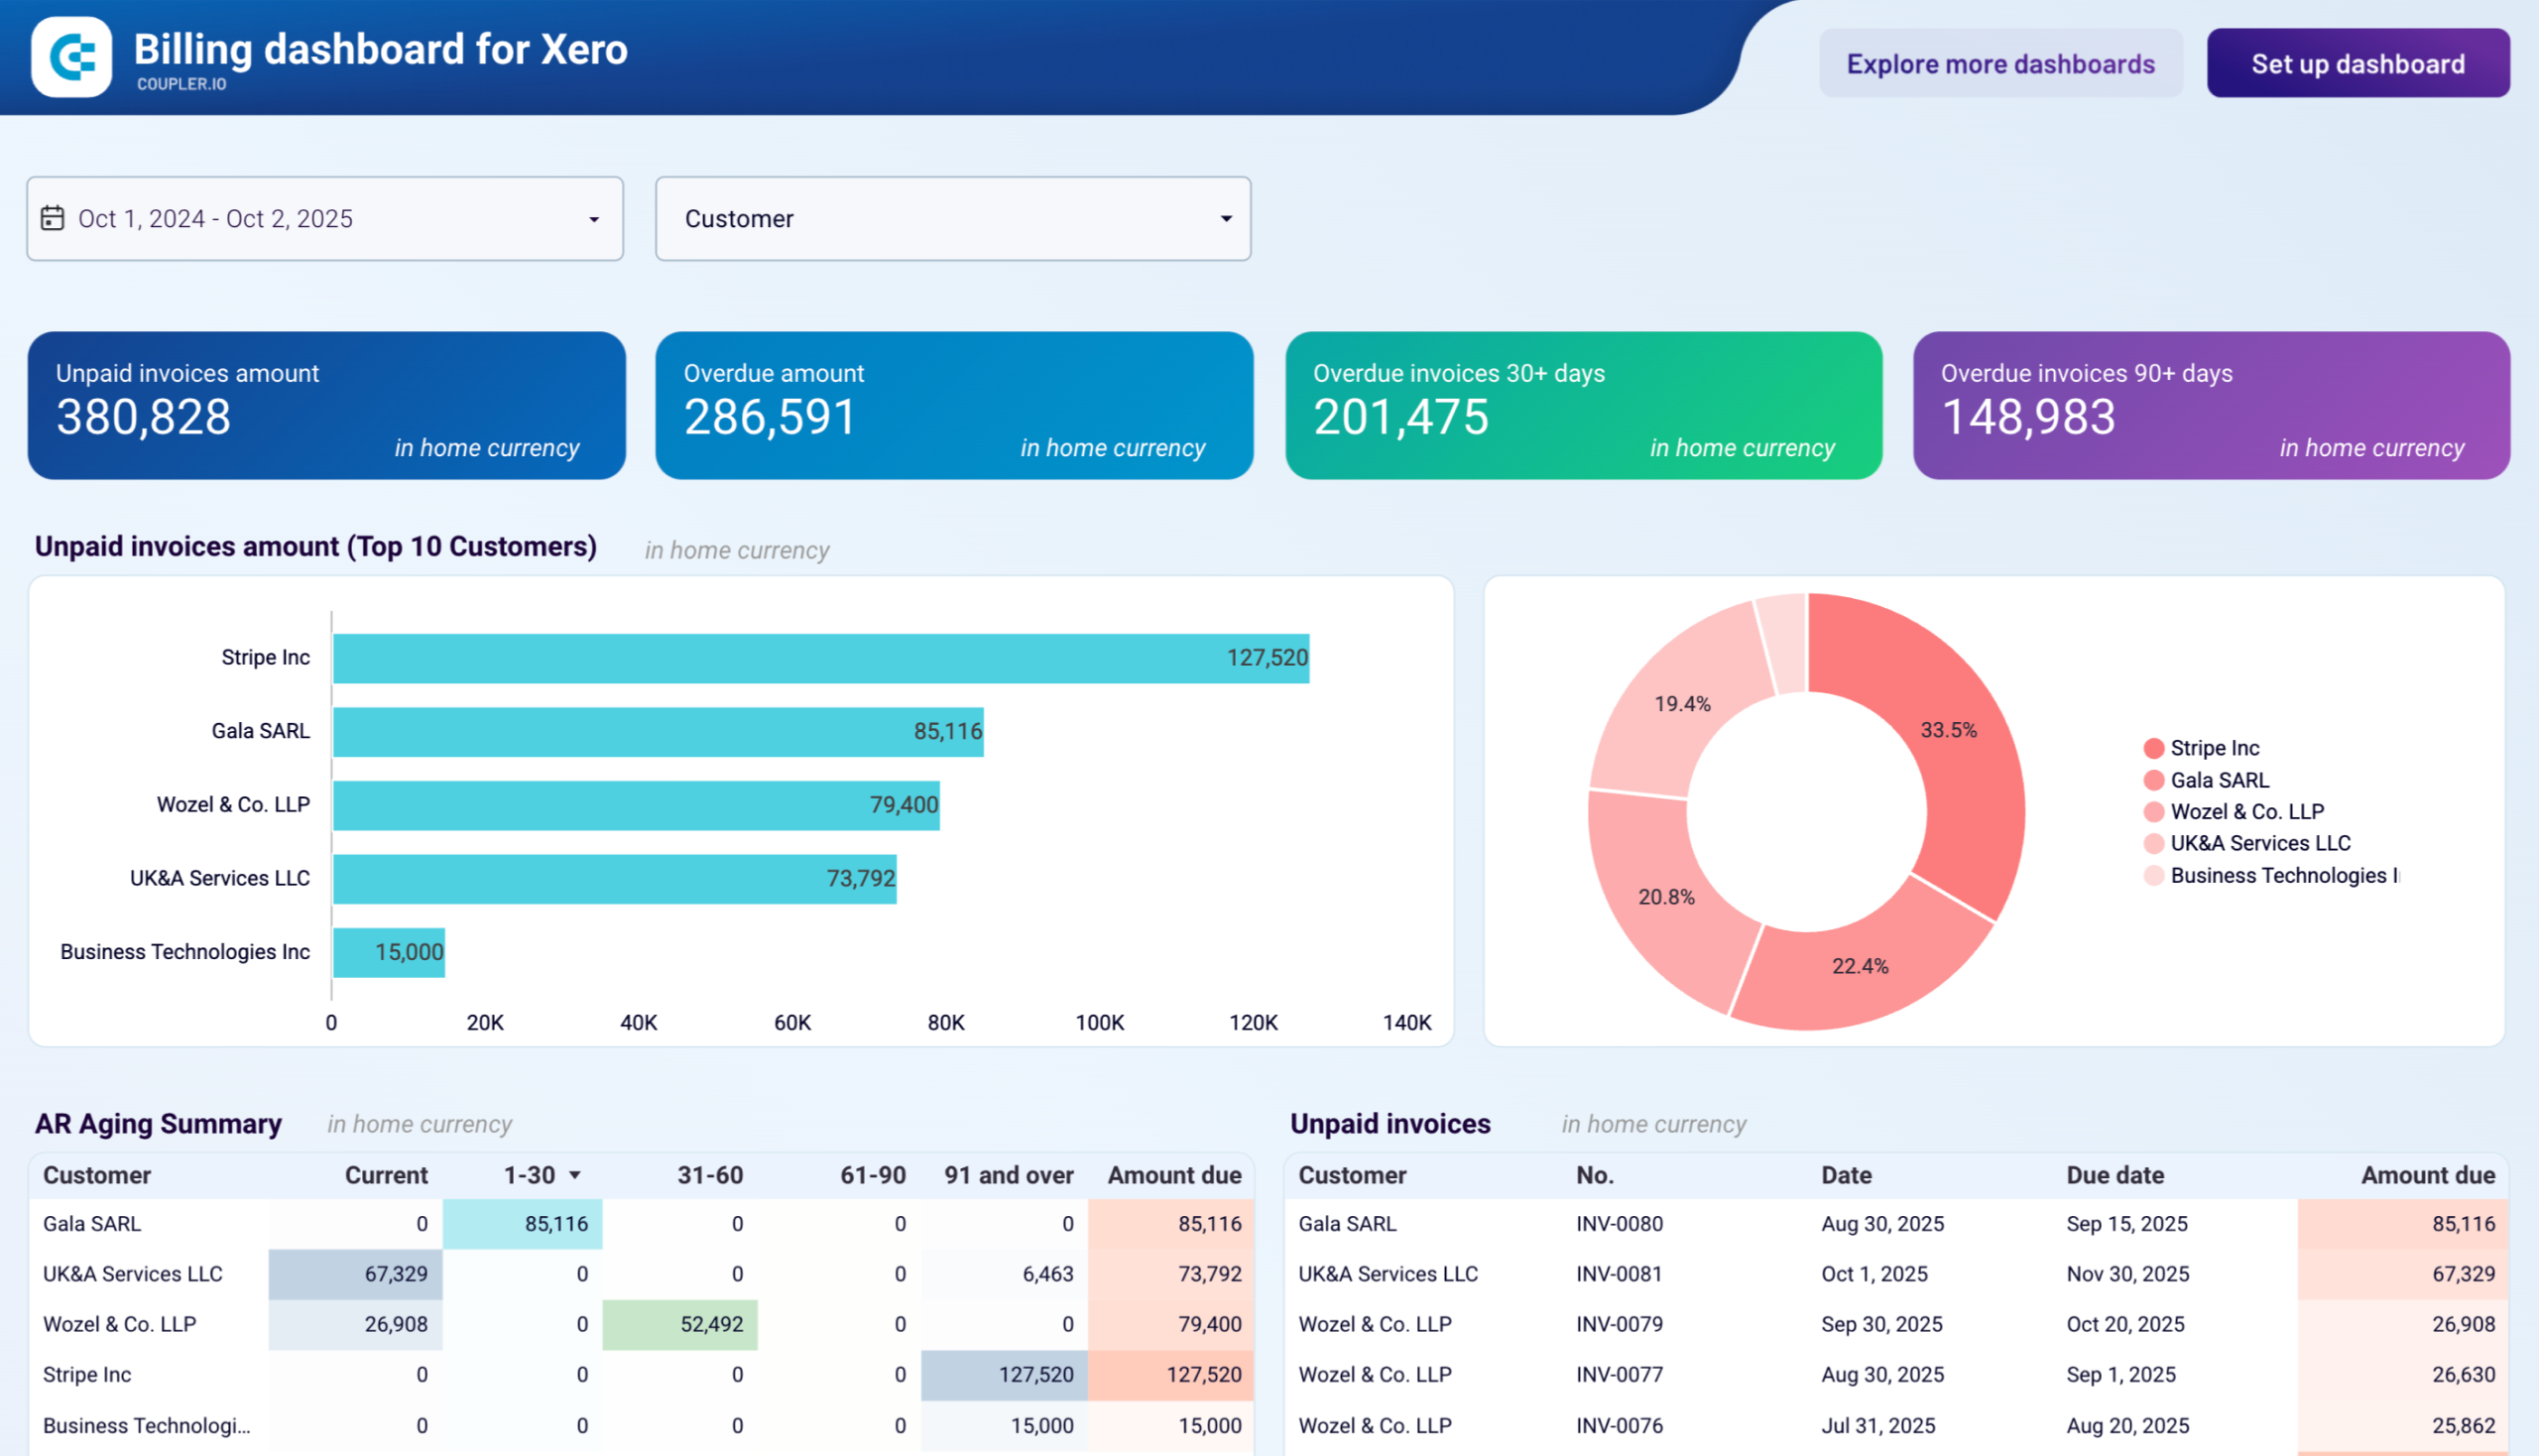
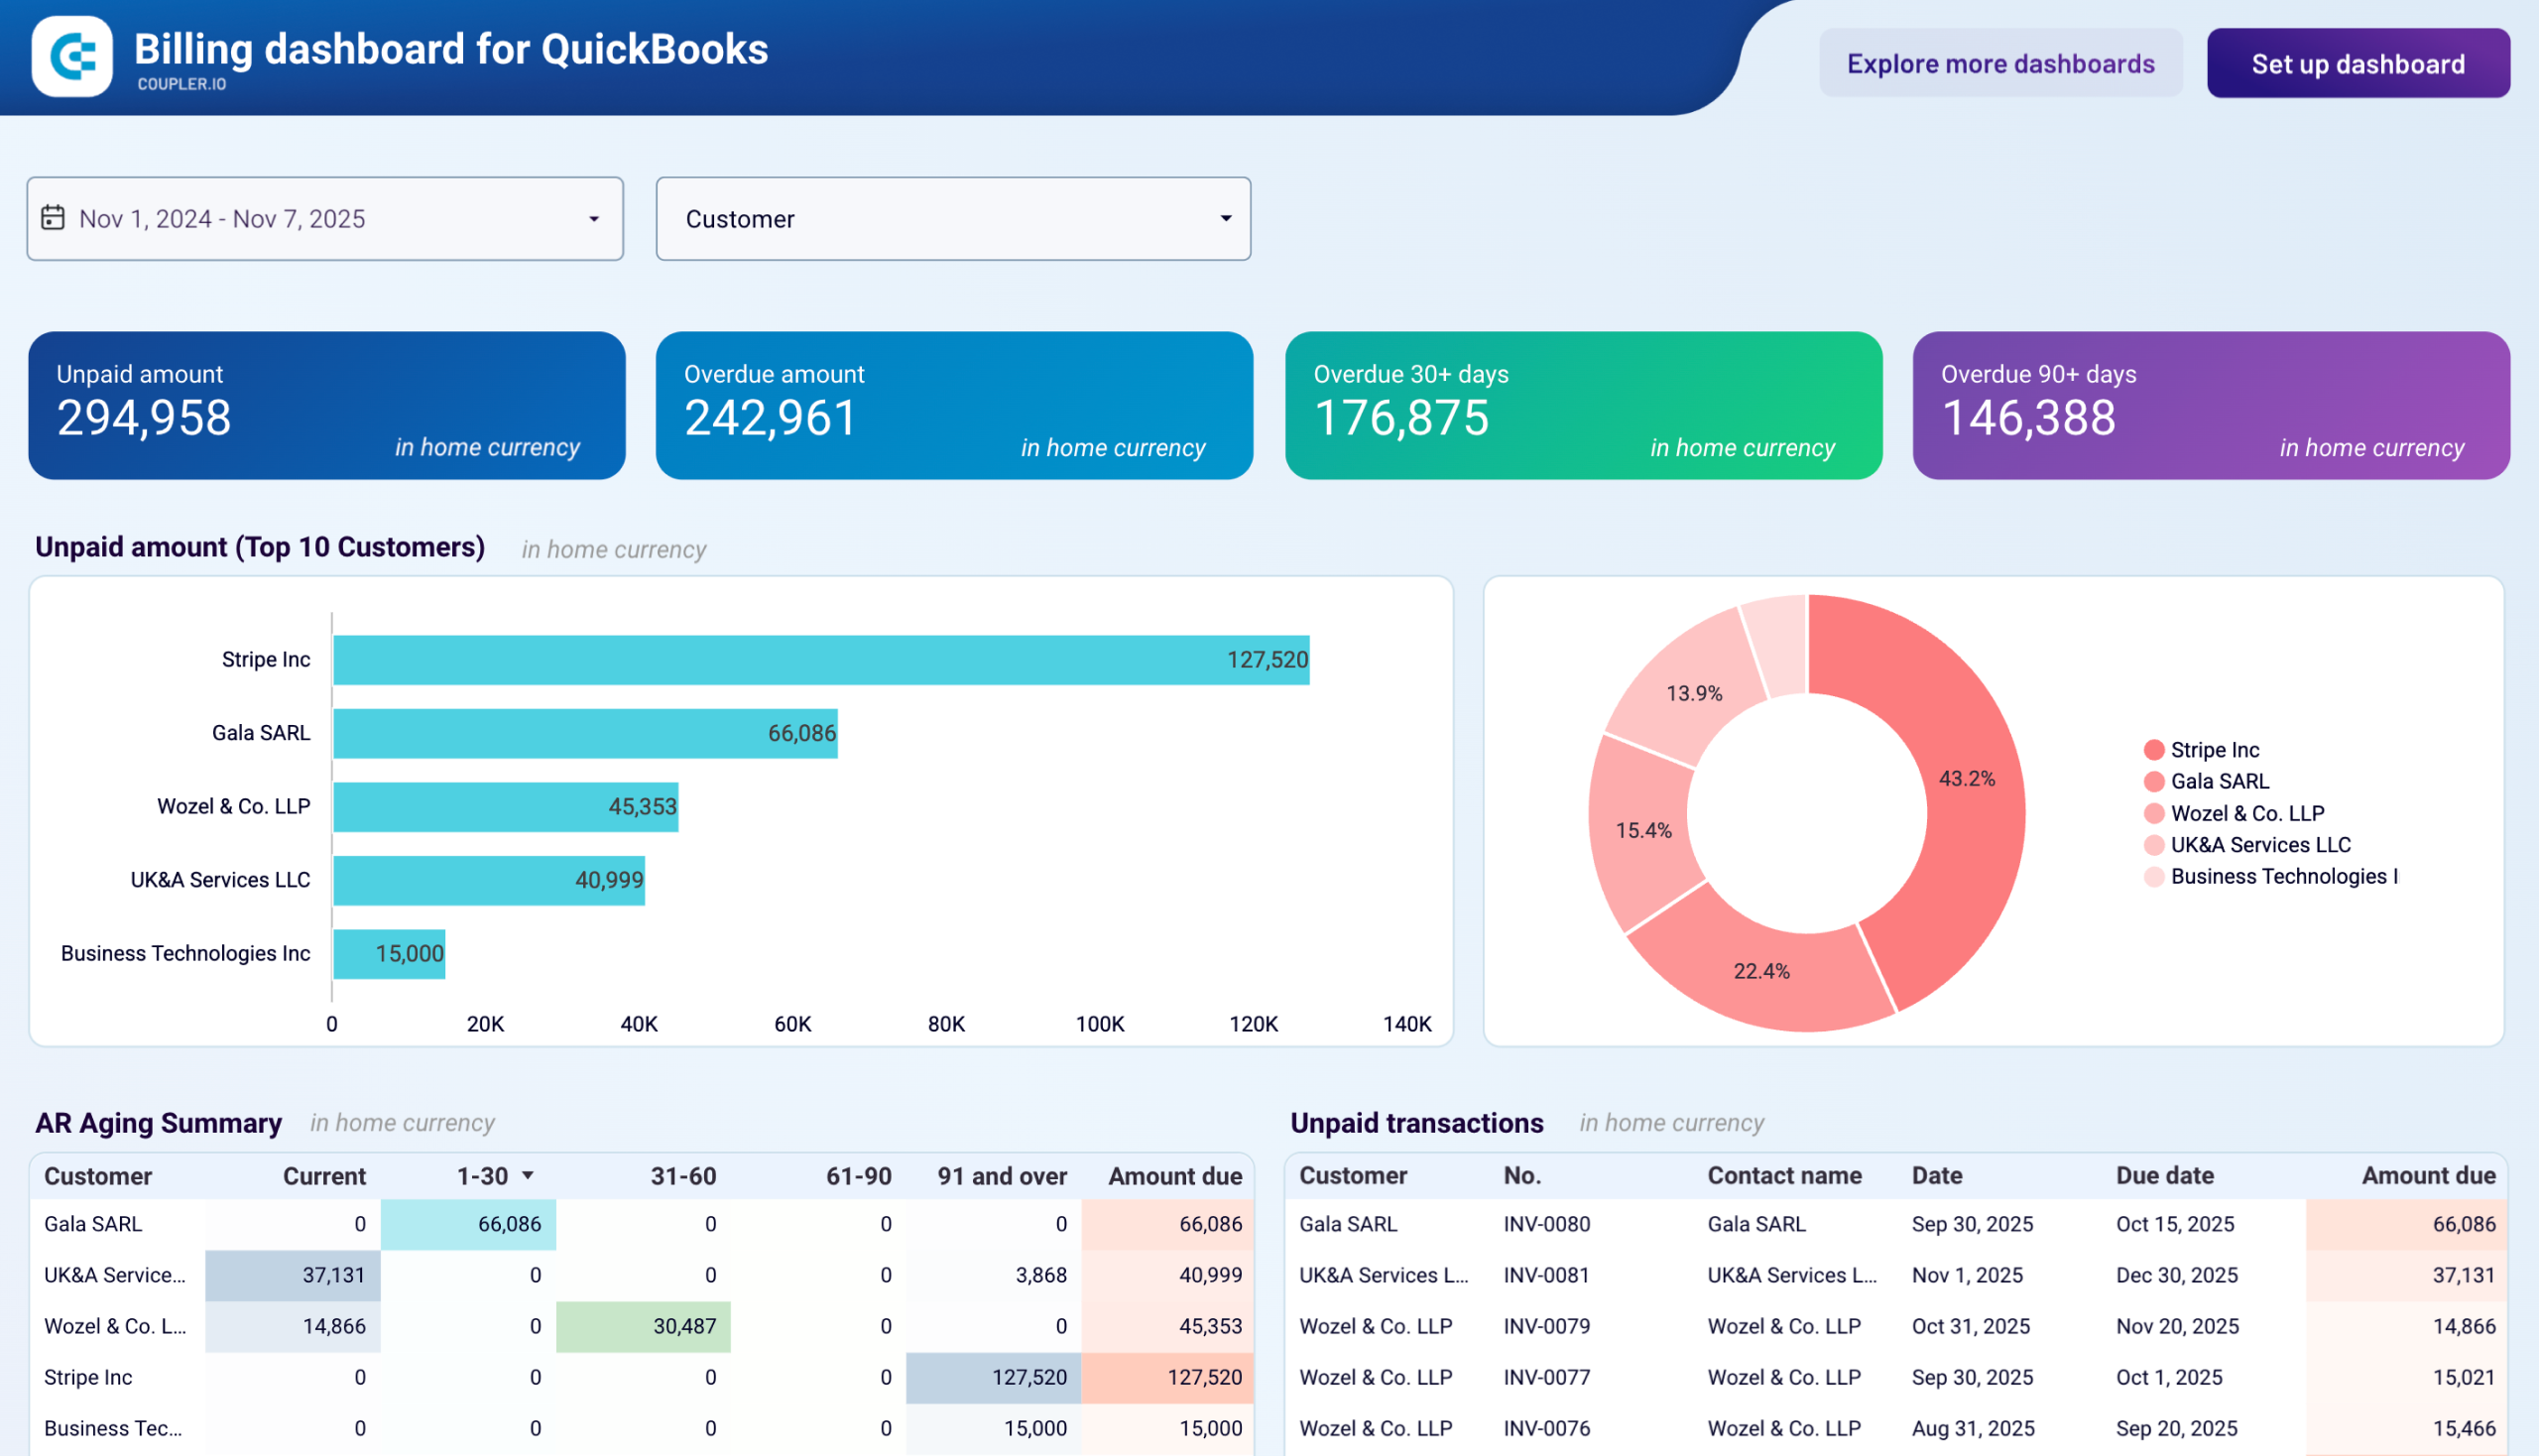
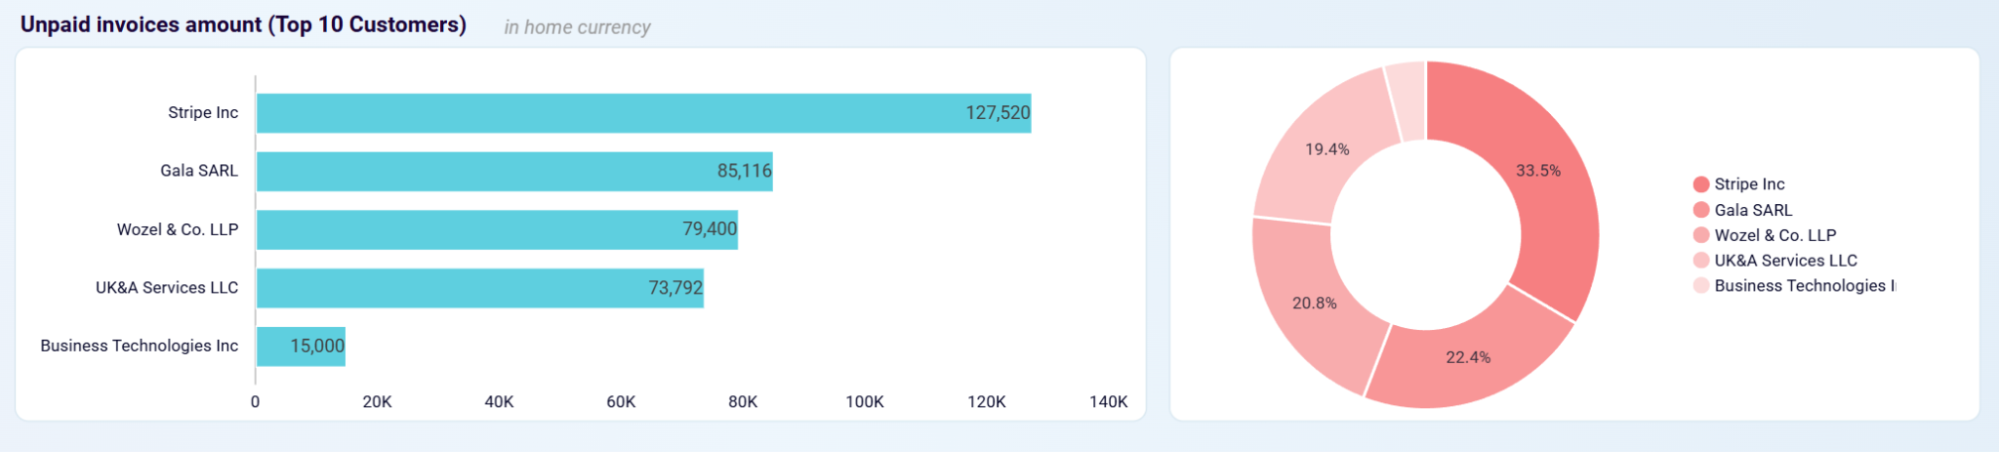
This report segments outstanding customer invoices by time periods—current, 1-30 days, 31-60 days, 61-90 days, and 91+ days overdue. The aging breakdown helps you prioritize collection efforts by identifying which customers have the oldest unpaid balances and the largest amounts at risk. Visual rankings display your top debtors by outstanding balance, while concentration analysis reveals whether your receivables risk is distributed across many customers or concentrated with a few key accounts. This foundation enables strategic decisions about credit policies, collection timing, and bad debt reserves.
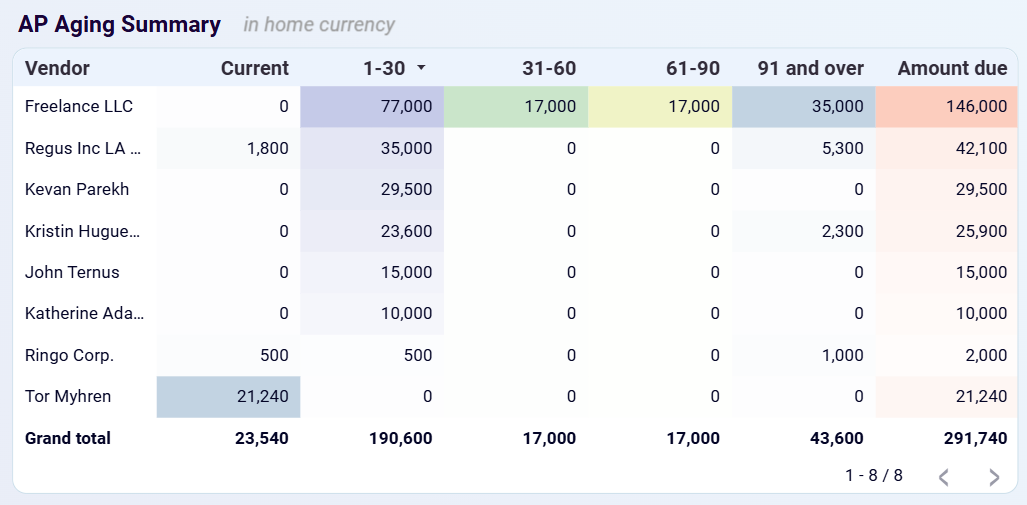
The payable side mirrors receivables with vendor bills categorized by the same aging periods. This report shows which suppliers represent your largest payment obligations and how those obligations are distributed across current and overdue periods. Vendor concentration charts identify dependency patterns where a small number of suppliers account for the majority of payables. Historical payment tracking compares spending patterns across the current month, last month, and trailing twelve months to spot cost increases, duplicate payments, or opportunities to consolidate vendors for better pricing terms.
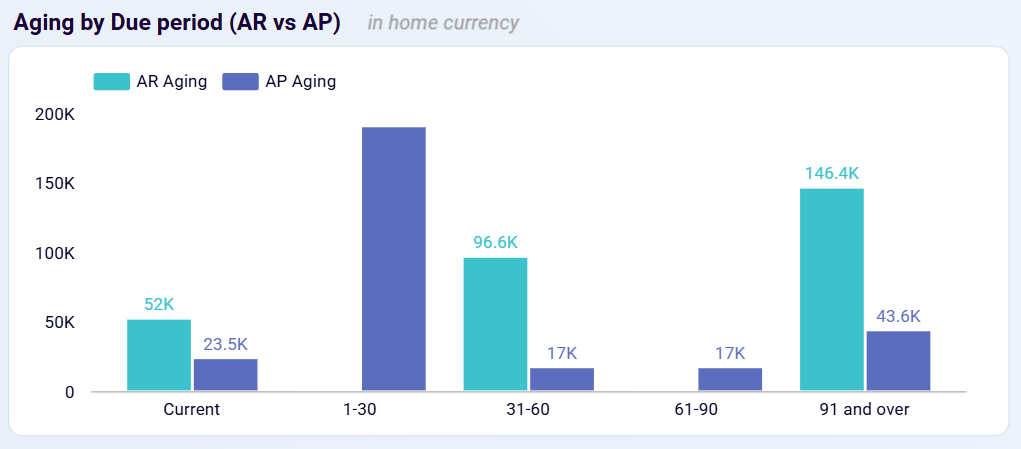
This distinctive component of billing analytics dashboard setups compares the aging structure of incoming customer payments against outgoing vendor payments side by side. The comparative view immediately reveals whether you're collecting from customers faster or slower than you're paying suppliers—a critical insight for anticipating cash crunches before they occur. Tracking trends over time shows whether the gap between overdue receivables and overdue payables is widening or narrowing, enabling proactive adjustments to payment timing or collection intensity before liquidity problems develop.
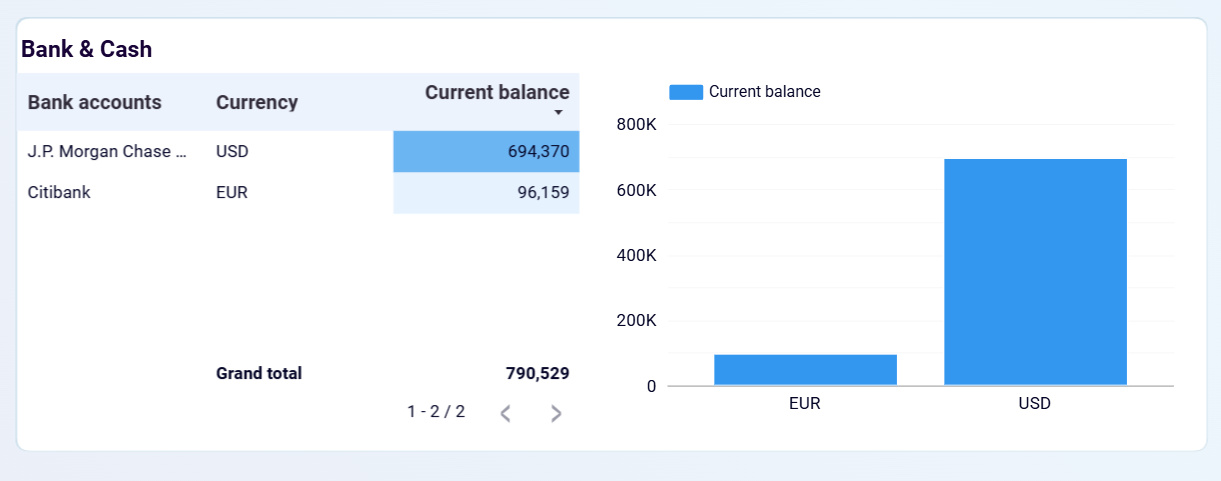
The final essential report displays current bank balances across all accounts and currencies, comparing total available cash against total bills due. This straightforward comparison answers the fundamental question of whether you have sufficient funds to meet immediate payment obligations or need to prioritize certain vendors, accelerate collections, or arrange short-term financing. Multi-currency tracking prevents exchange rate surprises by showing balances in each operating currency separately, helping you maintain appropriate reserves in each currency rather than relying on frequent conversions at unfavorable rates.
What insights you can get with the billing KPI dashboard
Monitor total unpaid amounts alongside overdue balances categorized by aging periods. The dashboard highlights your largest outstanding customer balances through visual rankings, enabling you to assess which accounts require immediate attention and understand the concentration of your receivables risk. Top 10 customers appear ranked by outstanding balance in descending order, while accompanying percentage distributions reveal whether your cash inflow depends heavily on a few large accounts or is distributed across many smaller customers.
Compare the aging structure of incoming payments against outgoing obligations to identify potential cash flow gaps. Track whether you're collecting from customers faster or slower than you're paying vendors, helping you anticipate liquidity challenges before they affect operations. The side-by-side aging comparison across identical time periods makes synchronization issues immediately visible. If you see significantly more payables in the current and 1-30 day buckets while receivables are concentrated in 61-90+ day buckets, you know cash flow timing is misaligned.
Review unpaid bills organized by vendor and aging period to determine payment urgency based on both relationship importance and days overdue. This helps you maintain critical vendor relationships while managing limited cash resources effectively. The aging summary breaks down vendor balances across current and overdue periods (1-30, 31-60, 61-90, 91+ days). You can identify which suppliers have the longest-standing obligations, which relationships are most critical to maintain, and which payment delays might trigger penalties or damage important partnerships.
Evaluate available cash across all bank accounts and compare liquid assets against total bills due. This insight helps you determine whether you can meet all payment obligations or need to prioritize certain vendors, seek financing, or accelerate collections to close the gap. Current balances display by account and currency, with visual comparison showing total cash position stacked against outstanding payables. When available cash falls short of payment obligations, you can immediately see the magnitude of the shortfall and make informed decisions about which vendors to pay first, which collections to pursue most aggressively, or whether external financing is necessary to maintain vendor relationships.
How to create billing dashboards?

Metrics you can track with a billing dashboard template
Monitor the total value of outstanding customer invoices across all aging periods, from current to significantly overdue. The billing dashboard displays this metric prominently in scorecards at the top of your accounts receivable view, giving you immediate visibility into how much revenue has been billed but not yet collected. This foundational metric helps you understand the gap between invoiced revenue and actual cash received, enabling better forecasting of when funds will become available.
Track the total value of customer invoices that have passed their payment due dates, distinguishing collection problems from normal payment timing. Dashboard scorecards display this metric alongside total unpaid invoices, helping you quickly assess what percentage of your receivables requires immediate collection attention. Rising overdue amounts signal deteriorating customer payment behavior that may require policy adjustments or more aggressive follow-up procedures.
Measure customer invoices remaining unpaid 30 or more days past due, with the AR Aging Summary table breaking these balances into 31-60 days, 61-90 days, and 91+ day categories. The 30+ day threshold indicates accounts that have moved beyond typical payment delays into serious collection territory, while the 90+ day segment represents your highest-risk receivables most likely to become bad debt write-offs. This metric helps you identify chronic payment problems and track aging progression.
Monitor the total value of outstanding vendor payment obligations across all aging periods, showing how much cash you need to satisfy current and overdue supplier bills. Dashboard scorecards display this metric at the top of your accounts payable view, providing immediate visibility into total payment obligations that will require cash disbursement. Comparing this metric against available bank balances helps you determine whether you have sufficient liquidity to meet all vendor commitments.
Track the total value of vendor bills that have exceeded their payment due dates, identifying payment discipline issues that could damage supplier relationships. The dashboard displays this metric in scorecards alongside total unpaid bills, helping you quickly assess what percentage of your payables is late and potentially subject to penalties or strained vendor relationships. Increasing overdue bill amounts indicate either cash flow problems or process failures needing correction.
Measure vendor bills remaining unpaid 30 or more days past their due dates, with the AP Aging Summary table segmenting these overdue balances across 31-60 days, 61-90 days, and 91+ day periods. The 30+ day threshold reveals serious payment delays that likely concern your suppliers and may affect future terms, while the 90+ day segment indicates severely strained relationships requiring immediate attention to prevent supplier restrictions or termination.