Connect your CRM
Link Salesforce, HubSpot, Pipedrive, Zoho CRM, Close, or Monday CRM to Coupler.io. Set a refresh schedule and your pipeline data stays current between each question you ask.
Connect Salesforce, HubSpot, or Pipedrive and ask about win rates, deal velocity, and rep performance in plain language. Your live CRM data, queried directly — no SQL and exports.
 Claude
 ChatGPT
 Gemini
 Cursor
 Perplexity
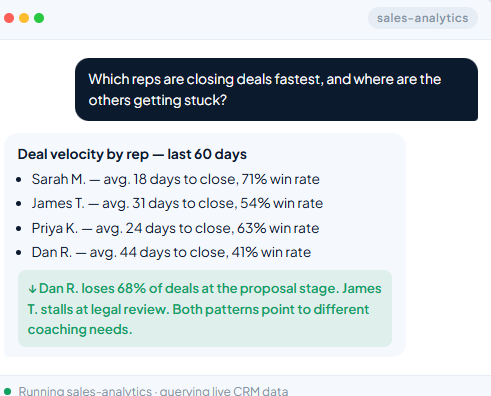


You'll get a pipeline health summary with win rate, deal velocity, and stage conversion so you can answer "are we going to hit the number?" with real data.
Start for freeYou'll see which channels are generating deals that actually close, not just leads that enter the funnel and stall.
Start for freeYou'll get rep-level performance and stage conversion broken down by deal type, so coaching conversations are based on what the data shows.
Start for freeYou'll receive a revenue forecast grounded in current pipeline velocity, not last quarter's assumptions.
Start for freeAnalyze sales performance using data from Coupler.io dataflows (Salesforce, HubSpot, Pipedrive, Close, Zoho, custom CRMs). This skill guides you through retrieving opportunity/deal data, computing pipeline and conversion metrics, investigating velocity and rep performance, detecting anomalies, and presenting actionable insights a sales leader can act on.
Before starting any analysis, the Data Context Check skill (generate-data-set-context) runs as a gate. It calls get-schema on each target dataset to determine whether meaningful context is attached — particularly stage definitions, segment mappings (SMB/MM/Enterprise), team/territory structure, lead source taxonomy, and how ‘closed-lost no decision’ is distinguished from ‘closed-lost competitive’.
Do not duplicate this check in Step 1d.
Default to search-datasets with sales-flavored keywords — salesforce, hubspot, pipedrive, close, zoho, opportunities, deals, pipeline, leads, activities, or whatever CRM the user named. Search keeps the response small and lands on the right dataflow when the domain is known.
Fall back to list-datasets only when the user is genuinely browsing or hasn’t given any source/keyword to anchor on. Each dataflow represents a CRM data pipeline (e.g. “Salesforce Opportunities”, “HubSpot Deals”, “Pipedrive Pipeline”, “Salesforce Activities”, “Lead Sources”).
Unambiguous match (1 dataflow) → use it; mention which one.
Obvious candidates (2–3) → state your selection with one-line reasoning, proceed but invite corrections.
Ambiguous (5+, or unclear) → present best candidates (up to 5–7) grouped by source/scope, with reasoning, and wait for confirmation:
I found 4 dataflows likely relevant to your win-rate question:
  1. salesforce_opportunities — full pipeline with stage history
  2. hubspot_deals — older deals not migrated to SF
  3. salesforce_activities — calls/emails per opportunity
  4. closed_lost_reasons — categorized loss reasons
Should I focus on 1 alone, or include 4 to break down the loss reasons?
Hard gate only when ambiguous.
Call get-dataflow for each candidate. Note schedule, source health, and last successful run — CRM extracts can lag, and pipeline snapshots become misleading fast.
Call get-schema on each target dataset. If context was generated in Step 0, use the enriched schema directly.
For sales/CRM schemas, watch for: opportunity_id, account_id, owner_id, stage, stage_history (rare; often requires snapshots), amount/expected_amount, close_date, created_date, won/lost flags, lead_source, segment, territory, probability. Stage history is the load-bearing one for cycle/conversion analysis — if it’s missing, flag that some metrics will be approximations.
Sample each dataset. Watch for: deals stuck in legacy stages, missing close_date on open deals, amount in mixed currencies, deals tagged closed-won but with empty amount (services or trials), duplicate deal records across systems.
Always compute via SQL in get-data.
Combining datasets: get-data reads one dataset at a time and cannot join across them. Query each separately and synthesize when you are comparing side by side or pulling something small. When the user wants to repeat an analysis that needs a real join (matching rows across datasets, or aggregating over the combined result), build it with create-dataset so it re-runs on every refresh; its inputs must all live in the same dataflow. For a one-off question, combine the results yourself, and if the data is too large for that, say so and suggest create-dataset.
Date alignment: created_date, last_modified, close_date, stage_change_date — confirm which the user wants. ‘Pipeline as of date X’ typically uses close_date filtered by stage status as of X (requires snapshot history).
Currency normalization: Multi-currency CRMs need conversion (most have a currency field per opportunity). State your conversion approach.
Open vs. closed: Be explicit which population you’re analyzing. ‘Pipeline’ usually means open deals. ‘Win rate’ usually means closed (won + lost) deals — open deals don’t count yet.
Snapshot vs. live: Live CRM data is point-in-time current. To compute ‘pipeline as of last quarter’, you need historical snapshots (often via daily extracts). Without snapshots, you can only approximate using created_date and close_date.
Before generating a full analysis, present a brief summary — top 3–5 findings, anomalies, direction. Wait for user response.
Snapshot the current open pipeline:
Never single out a rep negatively without enough data (n>10 closed deals minimum). Frame development opportunities, not failures.
Apply this framework whenever investigating a change, drop, or spike (e.g., ‘why did our win rate drop’):
Severity classification:
Baseline comparison: Same quarter prior year (sales has annual cycles), trailing 4-quarter average, target/budget.
Root cause investigation steps:
Lead with the headline. Plain language. Every finding gets a ‘So what?’ and ‘Now what?’
Abbreviation expansion: First use of CRM, ACV, ARR, MQL, SQL (sales-qualified lead, NOT structured query language — disambiguate if both meanings could apply), CAC, NRR — expand.
Sample size caveats: When breaking down by rep/source/segment, state n. “Inbound has a 28% win rate (n=42) vs outbound’s 14% (n=8).”
Tells your AI which sources you want to connect and sets up the data flow for you. No manual configuration required or coding agent required.

Add the skill, connect a source, and ask your first question in minutes.
Looking for an AI agent skill tuned to your exact workflow?