Report generation AI agent skill
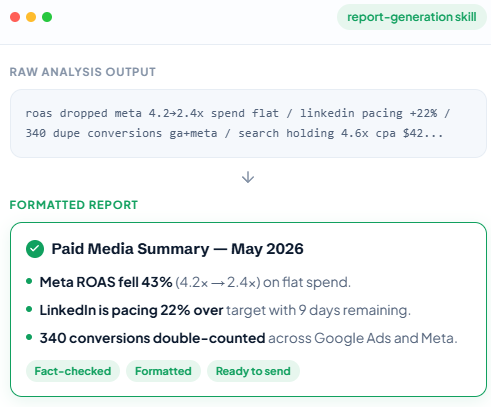
Turn raw analysis into a report your stakeholders can actually act on. The skill checks figures and claims before delivery, then formats the result as markdown, summary text, or tables — ready to send, not just ready to read.
When to use the report generation AI agent skill
Catch errors before they ship
Skip manual formatting
Match the audience’s format
What reports can you generate?
Management
You'll be able to hand leadership a clean summary instead of raw notes. The reports will be checked summaries with the key figures up front — built to be forwarded as-is, not rewritten first.
Start for free
Marketing
You'll be able to turn campaign data into a client-ready table. The skill gives you a formatted table with all numbers checked and labeled for further work.
Start for free
Sales
You'll be able to send a pipeline update without writing it yourself. This includes short summaries formatted for Slack or email in a way you can forward to your manager without editing.
Start for free
Finance
You'll be able to deliver board-ready numbers, fact-checked first. This covers formatted markdown reports with every figure verified against the source — built to go straight into board materials.
Start for free
Three Steps to Your First Answer
Run your analysis
Add the skill to your workflow
Get a formatted report
Skill instructions
When to use this skill
- The user asked for a “report”, “summary”, “review”, or “TL;DR”.
- The user asked for a structured deliverable they can share or act on.
- A complex analysis is complete and needs to be packaged for an audience.
- The user asked to “sanity-check”, “validate”, or “review for accuracy” an existing draft. In that case, skip Phase 1 and go straight to Phase 2 against the draft they provided.
Not needed for direct data requests (“show me top 5 rows”) — those return the data and stop.
Composition
If a domain bundle is loaded in the same turn, use its terminology, metric idioms, severity thresholds, and edge-case rules. Do not duplicate or override the bundle’s decisions. If no domain bundle is loaded but the request is clearly domain-flavored (mentions ROAS, MRR, AOV, win rate, CAC, etc.), recommend loading the relevant bundle by name before producing the report.
Phase 1 — Draft the report
Required inputs (from the analysis)
Before drafting, confirm you have:
- The metric values, with source dataset, timeframe, and freshness.
- The comparison basis (period-over-period, year-over-year, vs. target/budget) — if used.
- Anomalies and their severity (informational / warning / critical), per the loaded domain bundle’s framework.
- Hypotheses or root causes the analysis surfaced.
- The audience (operator, lead, executive) — if not stated, ask in one sentence; default to “operator-level”.
If any are missing and the analysis can still be summarized usefully, proceed and call out what’s missing in the report’s caveats.
Output structure
Use this structure unless the user asked for a different format. Adapt section depth to the complexity of the analysis — a simple weekly update may have one-line sections; an MBR may run a paragraph each.
1. TL;DR (1–3 sentences)
The single most important thing the audience needs to know. State direction (up/down/flat), magnitude, and severity. Lead with the most material number.
Example: “Revenue is down 18% week-over-week (warning), driven primarily by a stockout on SKU-1024 starting Monday. All other product lines are within normal range.”
2. Key Metrics (3–5 metrics, no more)
Each metric in this format:
-
Metric name (with definition on first use): value period-over-period change (absolute and %) direction indicator - One-line context: why this number, what it means, or what changed
Exclude metrics that didn’t materially change unless their stability is itself the headline. Format numbers with markdown bold: $48,200, 17.2%, 2.4x. State data freshness once at the top of this section, not per-metric.
3. Context (paragraph or 2–3 bullets)
The story behind the numbers. Trends, anomalies, comparisons. This is where domain-bundle insight goes — root-cause hypotheses, segment breakdowns, what changed in the environment. If there are anomalies, present them ranked by severity (critical → warning → informational). Cite the data: “Mobile CR dropped from 2.4% to 1.7% over the past 7 days (n=14k sessions).” For cross-period comparisons, always state both periods and confirm they’re comparable (full vs. partial, with vs. without promo, same vs. different fiscal week).
4. Recommendations (2–3 specific actions, prioritized)
Each recommendation:
- The action — concrete, verb-led (“Re-enable the paused SKU-1024 inventory feed”).
- Why — the data signal that motivates it.
- Expected impact — directional (“would recover ~$8K of weekly revenue if stockout was the only cause”) or qualitative.
If there’s only one critical action, recommend just that. Don’t pad to three. If there are no clear recommendations because the analysis is informational, say so — do not invent advice.
5. Next Questions (1–3 questions)
The most useful follow-up questions the user could ask next. These should narrow scope, deepen a thread, or extend to adjacent data.
Tone and format
- Concise. A weekly report is a page or less. An MBR is 2–3 pages max.
- Plain language. Define abbreviations on first use.
- Bold for numbers, sparingly bold for emphasis. No emoji except 📈 📉 💡.
- Second person (you/your), first person (I/my).
- Match the user’s tone — professional-direct for operators, more contextual for executives.
- Never use ordinal numbers in section bullets. No “You’re absolutely right” or apologetic preambles.
Required statements (always present)
- Source dataset(s) and timeframe used (e.g.
shopify_orders, week of April 21–27, 2026). - Data freshness — when the dataflow last ran successfully.
- Currency, if monetary values are reported.
- Any caveat about partial periods, stockouts, data-pipeline issues, or attribution windows that affects interpretation.
Phase 1 rules & edge cases
- Never fabricate numbers, recommendations, or hypotheses. If the analysis didn’t produce something, the report doesn’t claim it.
- Never silently change unit conventions (currency, gross/net, day/week grain) within a report. State once and stick to it.
- If the analysis output had warnings about data quality (stale dataflow, voided journals, tracking gaps), surface those warnings in the Caveats — do not hide them.
- If the report covers a period in progress (current week, current month), say so explicitly: “Week-to-date through Wednesday”.
- If the user requested Slack-formatted output, use Slack Block Kit JSON and Slack markdown (
*bold*, not**bold**). Otherwise default to standard markdown. - If the analysis produced fewer than 3 actionable findings, prefer a shorter report — don’t pad to fill sections.
Phase 2 — Validate the draft
After drafting (or when the user hands you an existing draft to check), run every validation category below before delivery. The goal is to catch mistakes the prior step might have made: arithmetic errors, unit drift, claims the underlying data doesn’t actually support, period-comparison fallacies. This phase does NOT generate new analysis or numbers — it checks what’s already there.
Phase 2 inputs
- The draft report.
- The source data (or the SQL queries and their results) the report was built from. If the queries’ results aren’t in context, re-run them to verify.
- The domain bundle’s framework (for severity thresholds and metric definitions).
If the source data isn’t recoverable (e.g. context-trimmed), say so explicitly and validate only what’s locally checkable (arithmetic, internal consistency, units).
Validation checks
Run each check. For each, output PASS or list specific issues.
1. Arithmetic
- Sums add up. Channel totals = reported total (within rounding).
- Percentages are correct. “Revenue grew 18%” means new/old − 1 = 0.18; verify.
- Period-over-period deltas: absolute change matches percentage change.
- Weighted averages computed correctly. Don’t average the averages without weighting.
- Conversion / efficiency ratios: numerator and denominator from the same scope (e.g. CPA = spend / conversions, both scoped to the same campaign and period).
- Re-execute any non-trivial computation explicitly in the response. Don’t trust internal arithmetic on unfamiliar numbers — show the math.
2. Units & conventions
- Currency: same throughout, or normalized with a stated approach. No silent USD-to-EUR mixing.
- Time period: same window applied to all comparable metrics. No mixing “last week” and “last 7 days”.
- Counts vs. rates: a “rate” must be on a stated denominator. Don’t confuse percentage points (pp) and percent change.
- Gross vs. net: ecom revenue / margin / etc. — the report must state and stick to one convention.
- Cash vs. accrual / booked vs. recognized: finance reports need explicit basis.
- Probability-weighted vs. raw values: sales pipeline numbers need the basis stated.
3. Claim vs. data
For every numeric or directional claim, trace it to a query result:
- “Revenue is up 18%” — find the query, recompute, confirm.
- “Ecom funnel conversion dropped” — confirm with funnel-stage data, not just session totals.
- “Top performer was Campaign X” — confirm from the per-campaign table, with full-quartile context.
- Severity claims (“critical”, “warning”, “informational”) must align with the loaded domain bundle’s severity thresholds.
If a claim cannot be traced to a query result, FLAG IT for removal or rewording.
4. Internal consistency
- TL;DR matches Key Metrics — the headline number and direction should match what the metrics section reports.
- Recommendations flow from the findings — every recommendation should reference data signals actually surfaced earlier in the report.
- Caveats are consistent — if the report flagged stale data in Section 3, it shouldn’t reference “real-time” anywhere.
- Comparison basis is consistent — “vs. last week” and “vs. trailing 4-week average” are different baselines; don’t switch silently.
5. Logical gates
Common fallacies to flag:
- Period mismatch — comparing a partial week/month to a full one without flagging.
- Open vs. closed populations — computing win rates on open deals (only closed deals have outcomes).
- Survivorship bias — analyzing “top customers” without acknowledging churned ones are excluded.
- Selection bias — “campaigns we kept have higher ROAS than campaigns we cut” (yes, that’s why they were cut).
- Sample size — segment-level rates with n<10 should carry a caveat.
- Attribution conflation — summing platform-reported conversions across Google + Meta + LinkedIn double-counts.
- Spurious precision — reporting a margin to 4 decimals on a sample of 50 transactions implies false confidence.
- Causation from correlation — “CTR rose after creative refresh” is a correlation; if causal language is used, it should be flagged or softened.
6. Citation completeness
Every numeric claim should be traceable to:
- A named dataset (e.g.
shopify_orders). - A stated timeframe.
- A noted data freshness.
Missing any of these → flag for fix.
Phase 2 output
Internal output, not shown to the user unless they explicitly asked for a validation pass:
Validation: PASS
- Arithmetic: ✓ (re-checked: 18% delta = $48,200 vs. $40,800)
- Units: ✓ (USD throughout, week-grain consistent)
- Claim vs. data: ✓ (5 claims traced to source queries)
- Consistency: ✓ (TL;DR matches metrics)
- Logical gates: ✓ (no period mismatches, sample sizes adequate)
- Citations: ✓ (dataset + timeframe + freshness present)
If issues are found, list each with: where in the report (section / line), what’s wrong, what to do. Then fix in the draft and re-run validation. Do not present a report that hasn’t passed cleanly.
Validation: ISSUES FOUND (3)
1. Arithmetic — Section 2 Key Metrics: claimed 18% growth, but ($48,200 / $40,800) − 1 = 18.14%, which rounds to 18% (acceptable). Note: Section 1 TL;DR says "nearly 20%" — overstated; align to 18%.
2. Units — Section 3 Context: mixed "last week" and "last 7 days" for the same comparison. Pick one and apply consistently.
3. Logical gate — Section 4 Recommendation 2: "Cut Campaign Beta, win rate is 8%" — Campaign Beta has only 3 closed deals (n=3, below 10-deal minimum). Either remove the recommendation or reframe as "Campaign Beta is underperforming on a small sample; gather more data before deciding."
When the user explicitly asked to validate (not generate), present the result as the response. Otherwise, fix issues silently in the draft and deliver the corrected report.
Phase 2 rules & edge cases
- Never invent corrections to numbers you can’t verify against source data. Flag for removal or for the user to confirm — don’t guess at the “right” value.
- Don’t second-guess the domain bundle’s framework. If
marketing-analyticssays 30% change is “critical”, a 25% change is “warning” — accept those thresholds. - Validation is conservative: when in doubt, flag. The cost of a false-positive is small; the cost of a false-negative is a wrong report shipped.

- If after a fix the report still has issues, re-run validation. Don’t deliver a report that hasn’t passed cleanly.
- For Slack-formatted output, validate the JSON structure as well as content (Block Kit syntactically valid, blocks under 11,950 chars).
- If multiple datasets or domain bundles were loaded, confirm the report uses each correctly and doesn’t conflate metric definitions across domains (e.g. “churn” means different things in finance/SaaS vs. ecom).
Other skills you might like
Browse all skillsStart Delivering Reports Today
Add the skill, point it at your analysis, and get a checked, formatted report back — ready to send.