Connect your data source
Link QuickBooks, Xero, Stripe, NetSuite, Sage, FreshBooks, or Chargebee to Coupler.io. Set a refresh schedule and your financial data stays current — no manual exports needed before you ask.
Connect QuickBooks, Xero, Stripe, or NetSuite and ask about P&L, margins, MRR/ARR, and cash runway in plain language. Your live financial data, queried directly — no SQL and exports.
 Claude
 ChatGPT
 Gemini
 Cursor
 Perplexity
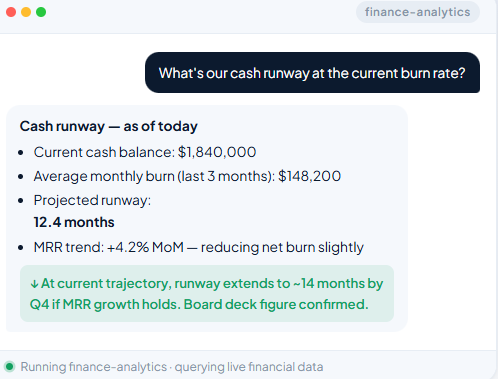


You'll get a live view of the cash runway, burn rate, and MRR — in plain language, ready to walk through with the board without building a slide first.
Start for freeYou'll see how marketing spend maps to revenue and margin over time — so you can argue for budget with numbers that come from the actual P&L.
Start for freeYou'll get pipeline-to-revenue conversion data paired with margin context, so you can see whether the deals you're closing are actually profitable.
Start for freeYou'll receive a full P&L, margin, and MRR/ARR breakdown from QuickBooks, Xero, Stripe, or NetSuite — without writing a single SQL query.
Start for freeAnalyze financial performance using data from Coupler.io dataflows (QuickBooks, Xero, Stripe, NetSuite, Sage, billing systems). This skill guides you through retrieving accounting and revenue data, computing P&L, margin, subscription, and cash metrics, detecting anomalies, and presenting actionable insights a finance lead can act on.
Before starting any analysis, the Data Context Check skill (generate-data-set-context) runs as a gate. It calls get-schema on each target dataset to determine whether meaningful context (chart of accounts mapping, entity/subsidiary structure, currency conventions, fiscal calendar, accrual vs. cash convention) is attached.
Do not duplicate this check in Step 1d.
Default to search-datasets with finance-flavored keywords — quickbooks, xero, netsuite, stripe, sage, gl, invoice, revenue, mrr, arr, bank, or whatever system the user named. Search keeps the response small and lands on the right dataflow when the domain is known.
Fall back to list-datasets only when the user is genuinely browsing or hasn’t given any source/keyword to anchor on. Each dataflow represents a data pipeline (e.g. “QuickBooks GL”, “Stripe Charges”, “NetSuite Revenue”, “Xero Invoices”, “Bank Transactions”).
Unambiguous match (1 dataflow) → use it; mention which one.
Obvious candidates (2–3) → state your selection with one-line reasoning, proceed but invite corrections.
Ambiguous (5+, or unclear) → present best candidates (up to 5–7) grouped by source/scope, with reasoning, and wait for confirmation:
I found 3 dataflows likely relevant to your MRR question:
  1. stripe_subscriptions — has plan, MRR amount, status
  2. quickbooks_gl — has revenue accounts, but at journal grain
  3. salesforce_opportunities — has booked ARR, less useful for recognized
Should I use Stripe alone, or combine Stripe and QuickBooks for cross-check?
Hard gate only when ambiguous. If you’re confident and stated reasoning, proceed.
Call get-dataflow for each candidate. Note schedule (data freshness), source health, and the close status of any GL data — finance refreshes are often slower than transactional sources.
Call get-schema on each target dataset. If context was generated in Step 0, use the enriched schema directly.
For finance schemas, watch for these critical column families: account/account_code (chart of accounts), entity_id/subsidiary, currency, transaction_date/posting_date, amount (signed: positive = credit, varies by source), invoice_status (paid/open/voided), customer_id, plan_id, billing_period_start/end, refund flags.
Sample each dataset to verify contents. Watch specifically for: signed-amount conventions (debit-positive vs. credit-positive), currency mixing, journal entry duplicates, voided/reversed entries that need exclusion. Flag anything off before proceeding.
Always compute via SQL in get-data. Floating-point aggregations over thousands of rows in-context are unreliable.
Combining datasets: get-data reads one dataset at a time and cannot join across them. Query each separately and synthesize when you are comparing side by side or pulling something small. When the user wants to repeat an analysis that needs a real join (matching rows across datasets, or aggregating over the combined result), build it with create-dataset so it re-runs on every refresh; its inputs must all live in the same dataflow. For a one-off question, combine the results yourself, and if the data is too large for that, say so and suggest create-dataset.
Date alignment: Posting date vs. transaction date vs. service date can differ — confirm which the user wants. Use fiscal calendar if the company doesn’t operate on calendar months.
Currency normalization: Multi-entity companies need consolidation; always state your conversion approach (period-end FX vs. average FX vs. native).
Cash vs. accrual: Critical distinction. Confirm which convention the user wants. Stripe data is mostly cash; QuickBooks/NetSuite GL can be either depending on configuration.
Recognized vs. booked: Booked = contract signed (Salesforce). Billed = invoice issued. Recognized = ASC 606 revenue recognition (subscription pro-ration). Don’t conflate; ask if unclear.
Voided/reversed entries: GL data often includes voided journals — exclude them in the WHERE clause. Don’t double-count refunds as new revenue.
Before generating a full analysis, present a brief summary — the 3–5 most important numbers, anomalies, and direction. Wait for user response before continuing.
Standard structure: Revenue → COGS → Gross Profit → Operating Expenses → Operating Income → Other → Net Income.
Flag concentration: if one customer/product is >20% of revenue, call it out as a concentration risk.
For SaaS or subscription businesses:
If bank/cash data isn’t in scope, say so. Don’t extrapolate runway from P&L data without cash data.
When the user asks ‘why did costs go up’ or ‘where is spend growing fastest’:
Any time the analysis involves investigating a change, drop, or spike — apply this framework:
Severity classification:
Finance has tighter sensitivity than marketing/ecom — a 10% gross margin drop is a ‘critical’ event, not ‘warning’.
Baseline comparison: Same period prior year (annual seasonality matters in finance), trailing 3-month average, budget if available.
Root cause investigation steps:
Lead with the headline, use plain language, ensure every finding has a ‘So what?’ and ‘Now what?’, structure for scannability.
Abbreviation expansion: First use of MRR, ARR, NRR, GRR, EBITDA, COGS, GAAP, ASC 606, AR, AP, FX — expand it.
Currency: Always state on first use. If multi-currency, state your normalization approach (period-end vs. average FX, source of rates).
Materiality: Note material vs. immaterial movements. A $5 swing in a $50M revenue line is noise.
Tells your AI which sources you want to connect and sets up the data flow for you. No manual configuration required or coding agent required.

Add the skill, connect a source, and ask your first question in minutes.
Looking for an AI agent skill tuned to your exact workflow?