Connect your data source
Link Shopify, WooCommerce, Magento, BigCommerce, Wix Stores, Stripe, or GA4 to Coupler.io. Set a refresh schedule and your store data stays live.
Connect Shopify, WooCommerce, or Magento and ask about conversions, top products, and revenue in plain language. Every number traces back to your live store data — not an estimate.
 Claude
 ChatGPT
 Gemini
 Cursor
 Perplexity


You'll get a store-level performance summary with top products, AOV trend, and repeat purchase rate without waiting for your analyst to pull a report.
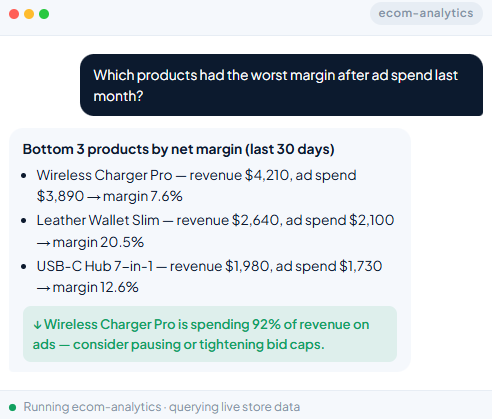
Start for freeYou'll see which products are driving margin after ad spend and which are dragging it down, across Shopify, WooCommerce, or Magento.
Start for freeYou'll get conversion funnel data broken down by stage, so you can see exactly where customers are dropping off and what to fix first.
Start for freeYou'll receive revenue and margin figures by product and time period, pre-aggregated and ready to use in financial planning or forecasting.
Start for freeAnalyze e-commerce performance using data from Coupler.io dataflows (Shopify, WooCommerce, BigCommerce, Magento, GA4, Stripe, Klaviyo, etc.). This skill guides you through retrieving order/session data, computing funnel and revenue metrics, detecting anomalies, and presenting actionable insights an ecom operator can act on.
Before starting any analysis, the Data Context Check skill (generate-data-set-context) runs as a gate. It calls get-schema on each target dataset to determine whether meaningful context (column descriptions, business rules, metric definitions, e.g. how returns are flagged, currency conventions, what counts as a ‘completed’ order) is attached.
Do not duplicate this check in Step 1d. If the context check skill has already run and context is present, Step 1d should use the enriched schema directly.
Every analysis starts by connecting to the user’s data through Coupler.io MCP tools.
Default to search-datasets with ecom-flavored keywords — shopify, woocommerce, bigcommerce, magento, orders, gmv, ecom, klaviyo, ga4, stripe, or whatever store/source the user named. Search keeps the response small and lands on the right dataflow when the domain is known (which it is, by definition, when this skill is loaded).
Fall back to list-datasets only when the user is genuinely browsing or hasn’t given any source/keyword to anchor on. Each dataflow represents a data pipeline (e.g. “Shopify Orders”, “GA4 Ecommerce Events”, “Klaviyo Email Engagement”, “Stripe Charges”, “WooCommerce Sales”).
How you handle selection depends on the match clarity, not just the count:
Unambiguous match (1 dataflow, clearly matches the request) → use it. Mention which one you’re using in your output. No confirmation needed.
Obvious candidates (2–3 dataflows clearly relevant) → state your selection with one-line reasoning. Proceed but invite corrections.
Ambiguous (5+ dataflows, or unclear which subset matters) → present your best candidates (up to 5–7) grouped by source/scope, with reasoning, and wait for confirmation:
I found 3 dataflows likely relevant to your repeat-purchase question:
  1. shopify_orders — has customer_id, order date, line items
  2. klaviyo_engagement — email touchpoints around purchases
  3. ga4_ecommerce — session-level conversion data
Should I use all three, or focus on one?
Hard gate only when ambiguous: wait for user confirmation when the right datasets aren’t obvious. If you’re confident and stated your reasoning, proceed — the user can redirect you.
For each selected dataset, call get-dataflow to read its current state — sources, destinations, last run, schedule. Note data freshness (when the dataflow last ran) so you can mention it in the output.
Call get-schema on each target dataset. If context was generated in Step 0, use the enriched schema directly. Otherwise build a mental mapping between columnName (used in SQL) and label (used when communicating).
For ecom-specific schemas, watch for these critical column families: order_id, customer_id/email, created_at/processed_at, total/subtotal/tax/shipping, currency, financial_status (paid/refunded/partially-refunded), fulfillment_status, line_items (often nested), discount_codes, customer_segment (new/returning).
Sample each dataset to verify contents. For wide tables (>15 columns), sample only the columns relevant to the analysis. Flag anything off (empty columns, unexpected formats, null-heavy fields, refund flags missing, etc.) before proceeding.
Always compute metrics via SQL in get-data. Floating-point aggregations over thousands of rows in-context are unreliable; the Coupler.io SQL engine handles this correctly.
Combining datasets: get-data reads one dataset at a time and cannot join across them. Query each separately and synthesize when you are comparing side by side or pulling something small. When the user wants to repeat an analysis that needs a real join (matching rows across datasets, or aggregating over the combined result), build it with create-dataset so it re-runs on every refresh; its inputs must all live in the same dataflow. For a one-off question, combine the results yourself, and if the data is too large for that, say so and suggest create-dataset.
Date alignment: Different sources use different date formats and grains (Shopify: ISO timestamp; GA4: date string; Stripe: Unix). Aggregate to a common grain before comparing.
Currency normalization: Multi-currency stores need explicit normalization (always confirm the conversion source/rate with the user before reporting).
Refund handling — critical: Decide upfront whether you’re reporting gross revenue (includes refunded orders), net revenue (excludes refunds), or paid revenue (excludes pending). The user often doesn’t realize these differ. State your choice in the output and check the assumption.
New vs. returning customers: If joining order data with customer history, define ‘new’ explicitly (first-ever order in the data window vs. first order in the analysis window). Flag the choice.
Joining sessions and orders: Web session data (GA4) and order data (Shopify) often don’t share a join key. Be explicit about whether you’re presenting them side-by-side (no join) or attempting an attribution join (typically requires client_id or UTM consistency).
Before generating a full analysis, present a brief summary — the 3–5 most important numbers, anomalies, and direction. Wait for the user’s response before continuing.
Based on what the user asked for, follow the appropriate analysis path:
Quantify the path from visit → product view → add to cart → checkout → purchase. Key stages and standard metrics:
Identify the biggest drop-off stage. A funnel with strong product-view → add-to-cart but weak checkout → purchase signals checkout friction (shipping cost surprise, payment issues, account-required friction). A weak product-view → add-to-cart suggests product/pricing/imagery issues.
Flag asymmetries: if mobile and desktop convert very differently, present them separately.
Group customers by acquisition month/week. Compute repeat-purchase rate at month 1, 2, 3, 6, 12. Healthy ecom businesses see clear retention plateaus; declining cohorts signal product/experience issues.
Report the curve, not just a single number. “Month-3 repeat rate has dropped from 22% (Q1) to 14% (Q3)” tells the operator more than “repeat rate is 14%”.
Distinguish between LTV (true lifetime, requires long history) and windowed LTV (proxy, comparable across cohorts). Always state the window.
Any time the analysis involves investigating a change, drop, or spike — whether the user explicitly asks ‘why did revenue drop’ or you notice unusual patterns during a routine report — apply this framework:
Severity classification:
Baseline comparison: Compare against same day-of-week last week, trailing 4-week average for the same day-of-week, and same period last year (seasonality matters a lot in ecom — Black Friday, holiday, Mother’s Day, back-to-school).
Root cause investigation steps:
Lead with the headline, use plain language, ensure every finding has a ‘So what?’ and ‘Now what?’, structure for scannability.
Abbreviation expansion: First time using AOV, LTV, CAC, ROAS, CR, etc. — expand it. After first use, the abbreviation alone is fine.
Currency: Always state the currency on first use. If multi-currency, normalize and state the conversion approach.
Tells your AI which sources you want to connect and sets up the data flow for you. No manual configuration required or coding agent required.

Add the skill, connect a source, and ask your first question in minutes.
Looking for an AI agent skill tuned to your exact workflow?