Dashboard examples and reporting templates
Take control of your business performance and save hours of manual work with Coupler.io’s easy-to-use dashboard templates. Simply choose the report that fits your needs, connect your data source, and gain visualized insights to tackle challenges in marketing, sales, finances, e-commerce, and more. Save time, make informed decisions, and grow your business with confidence.


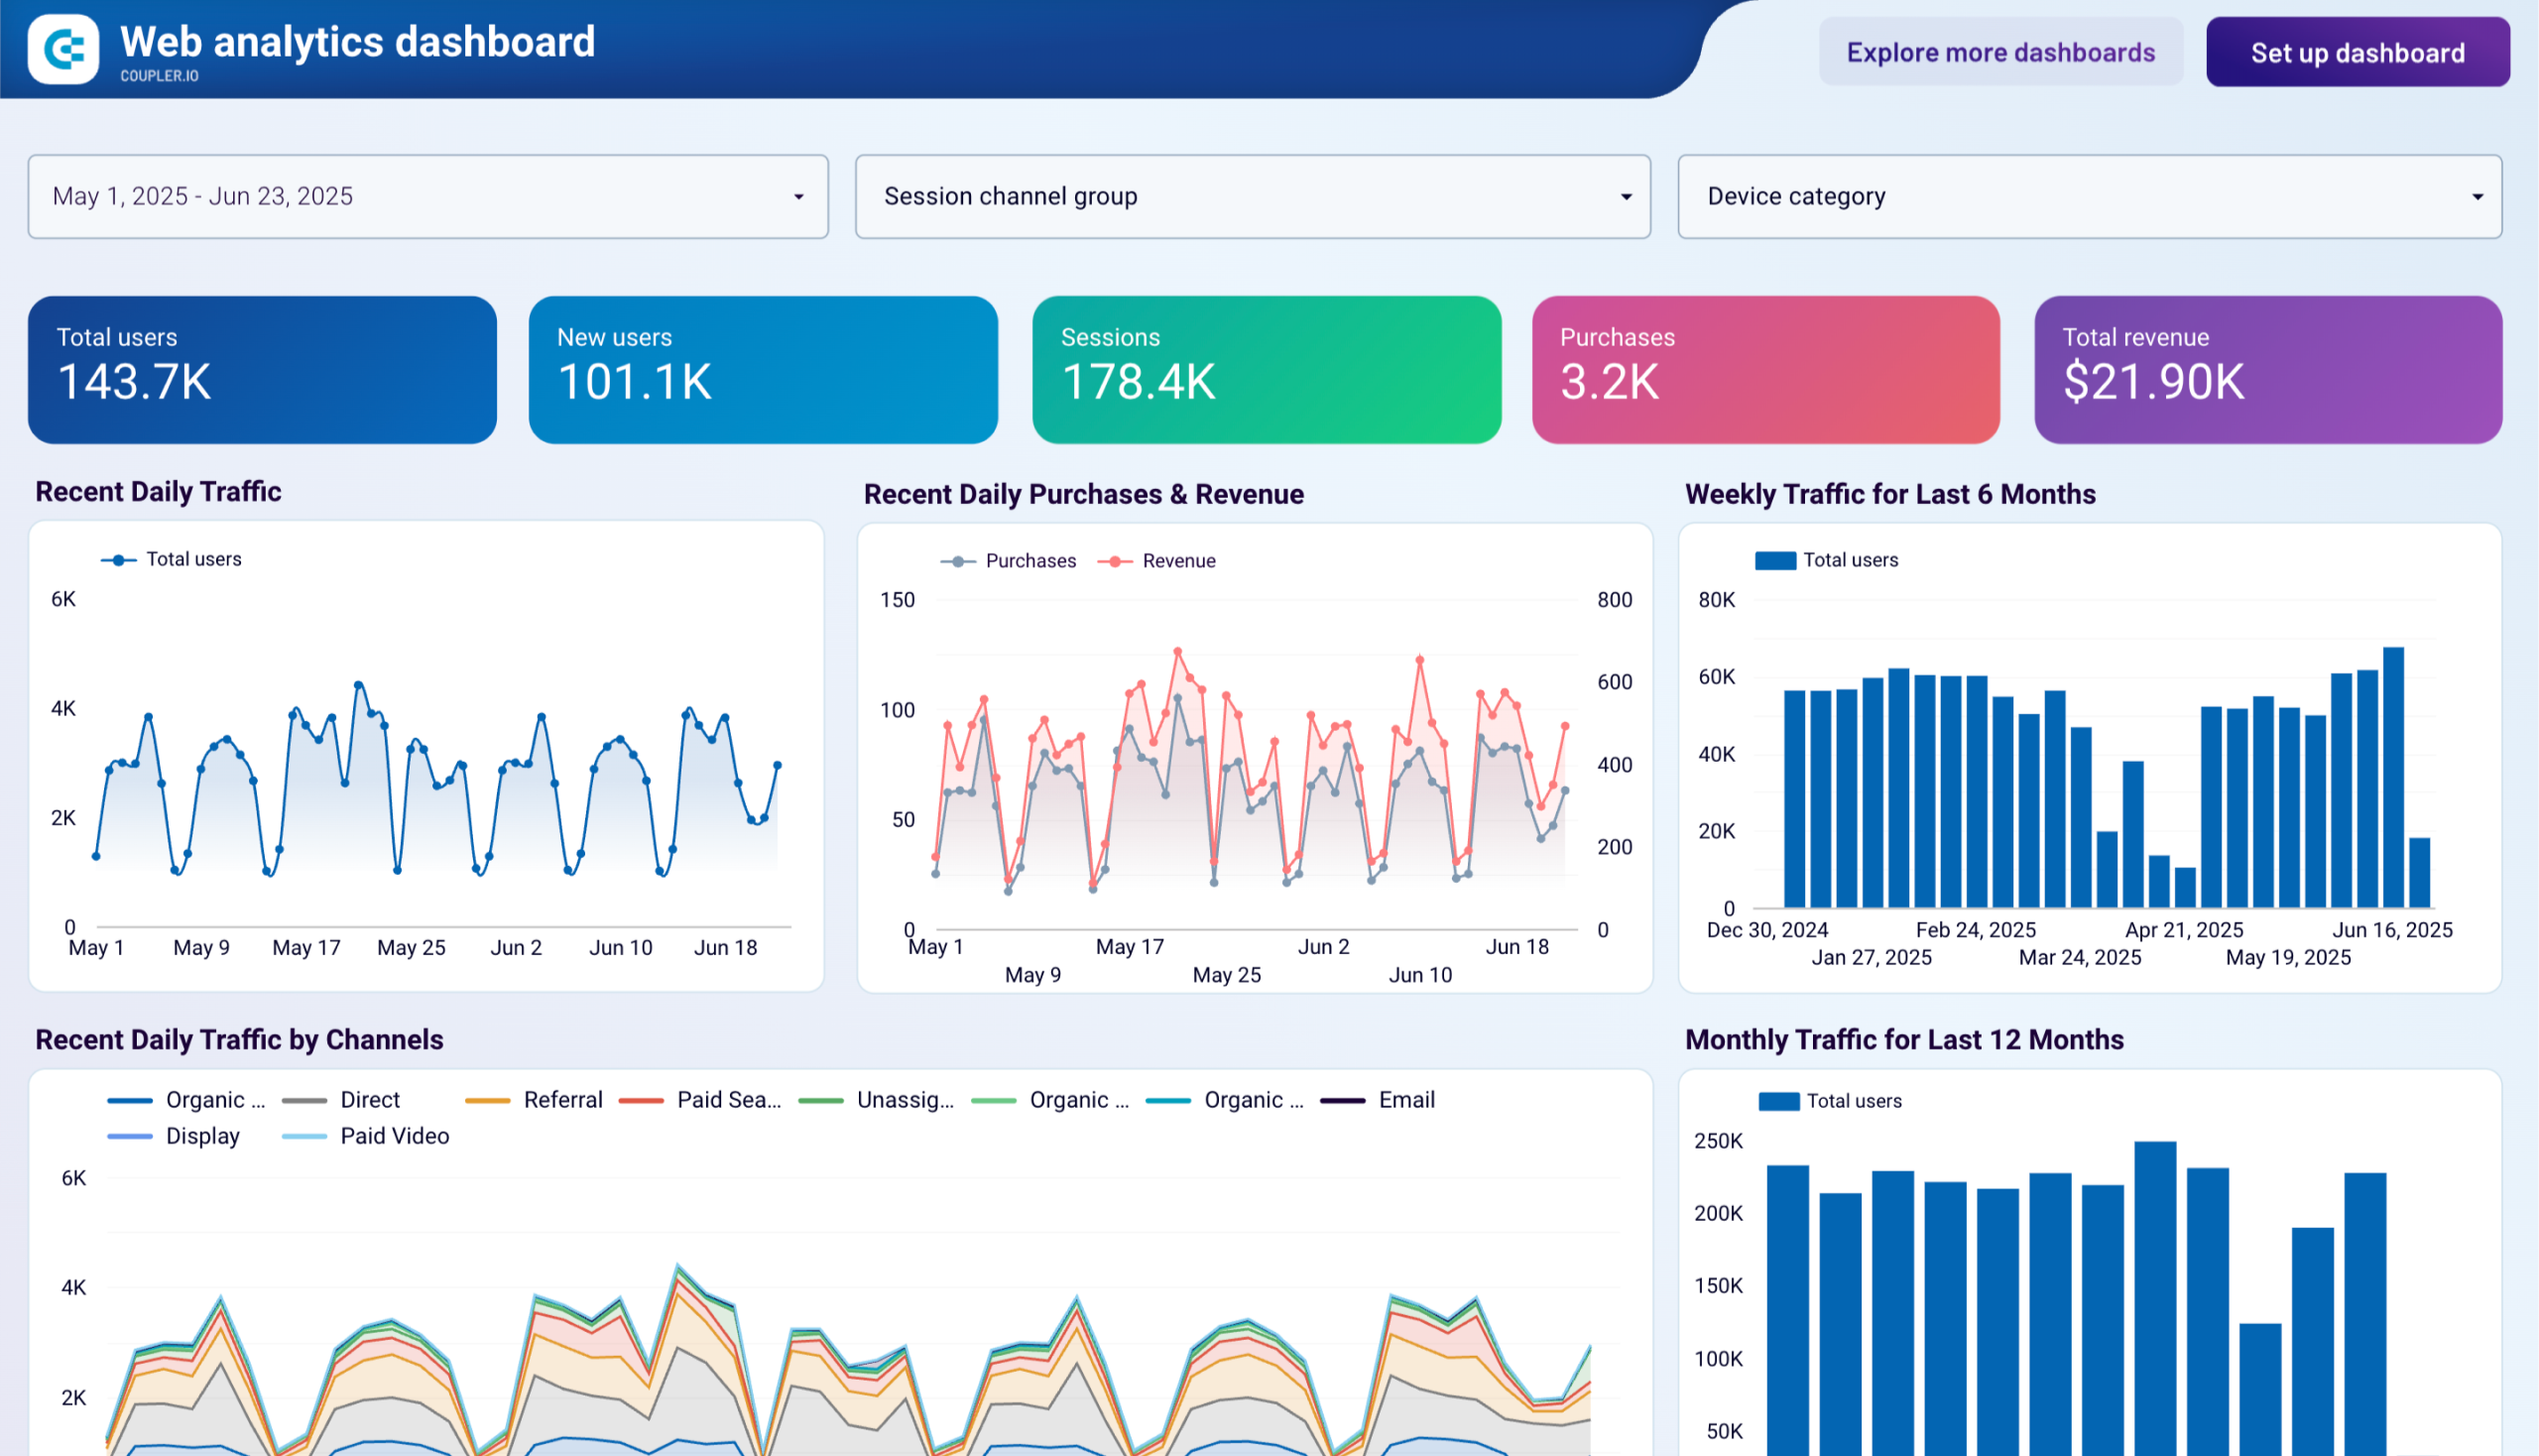
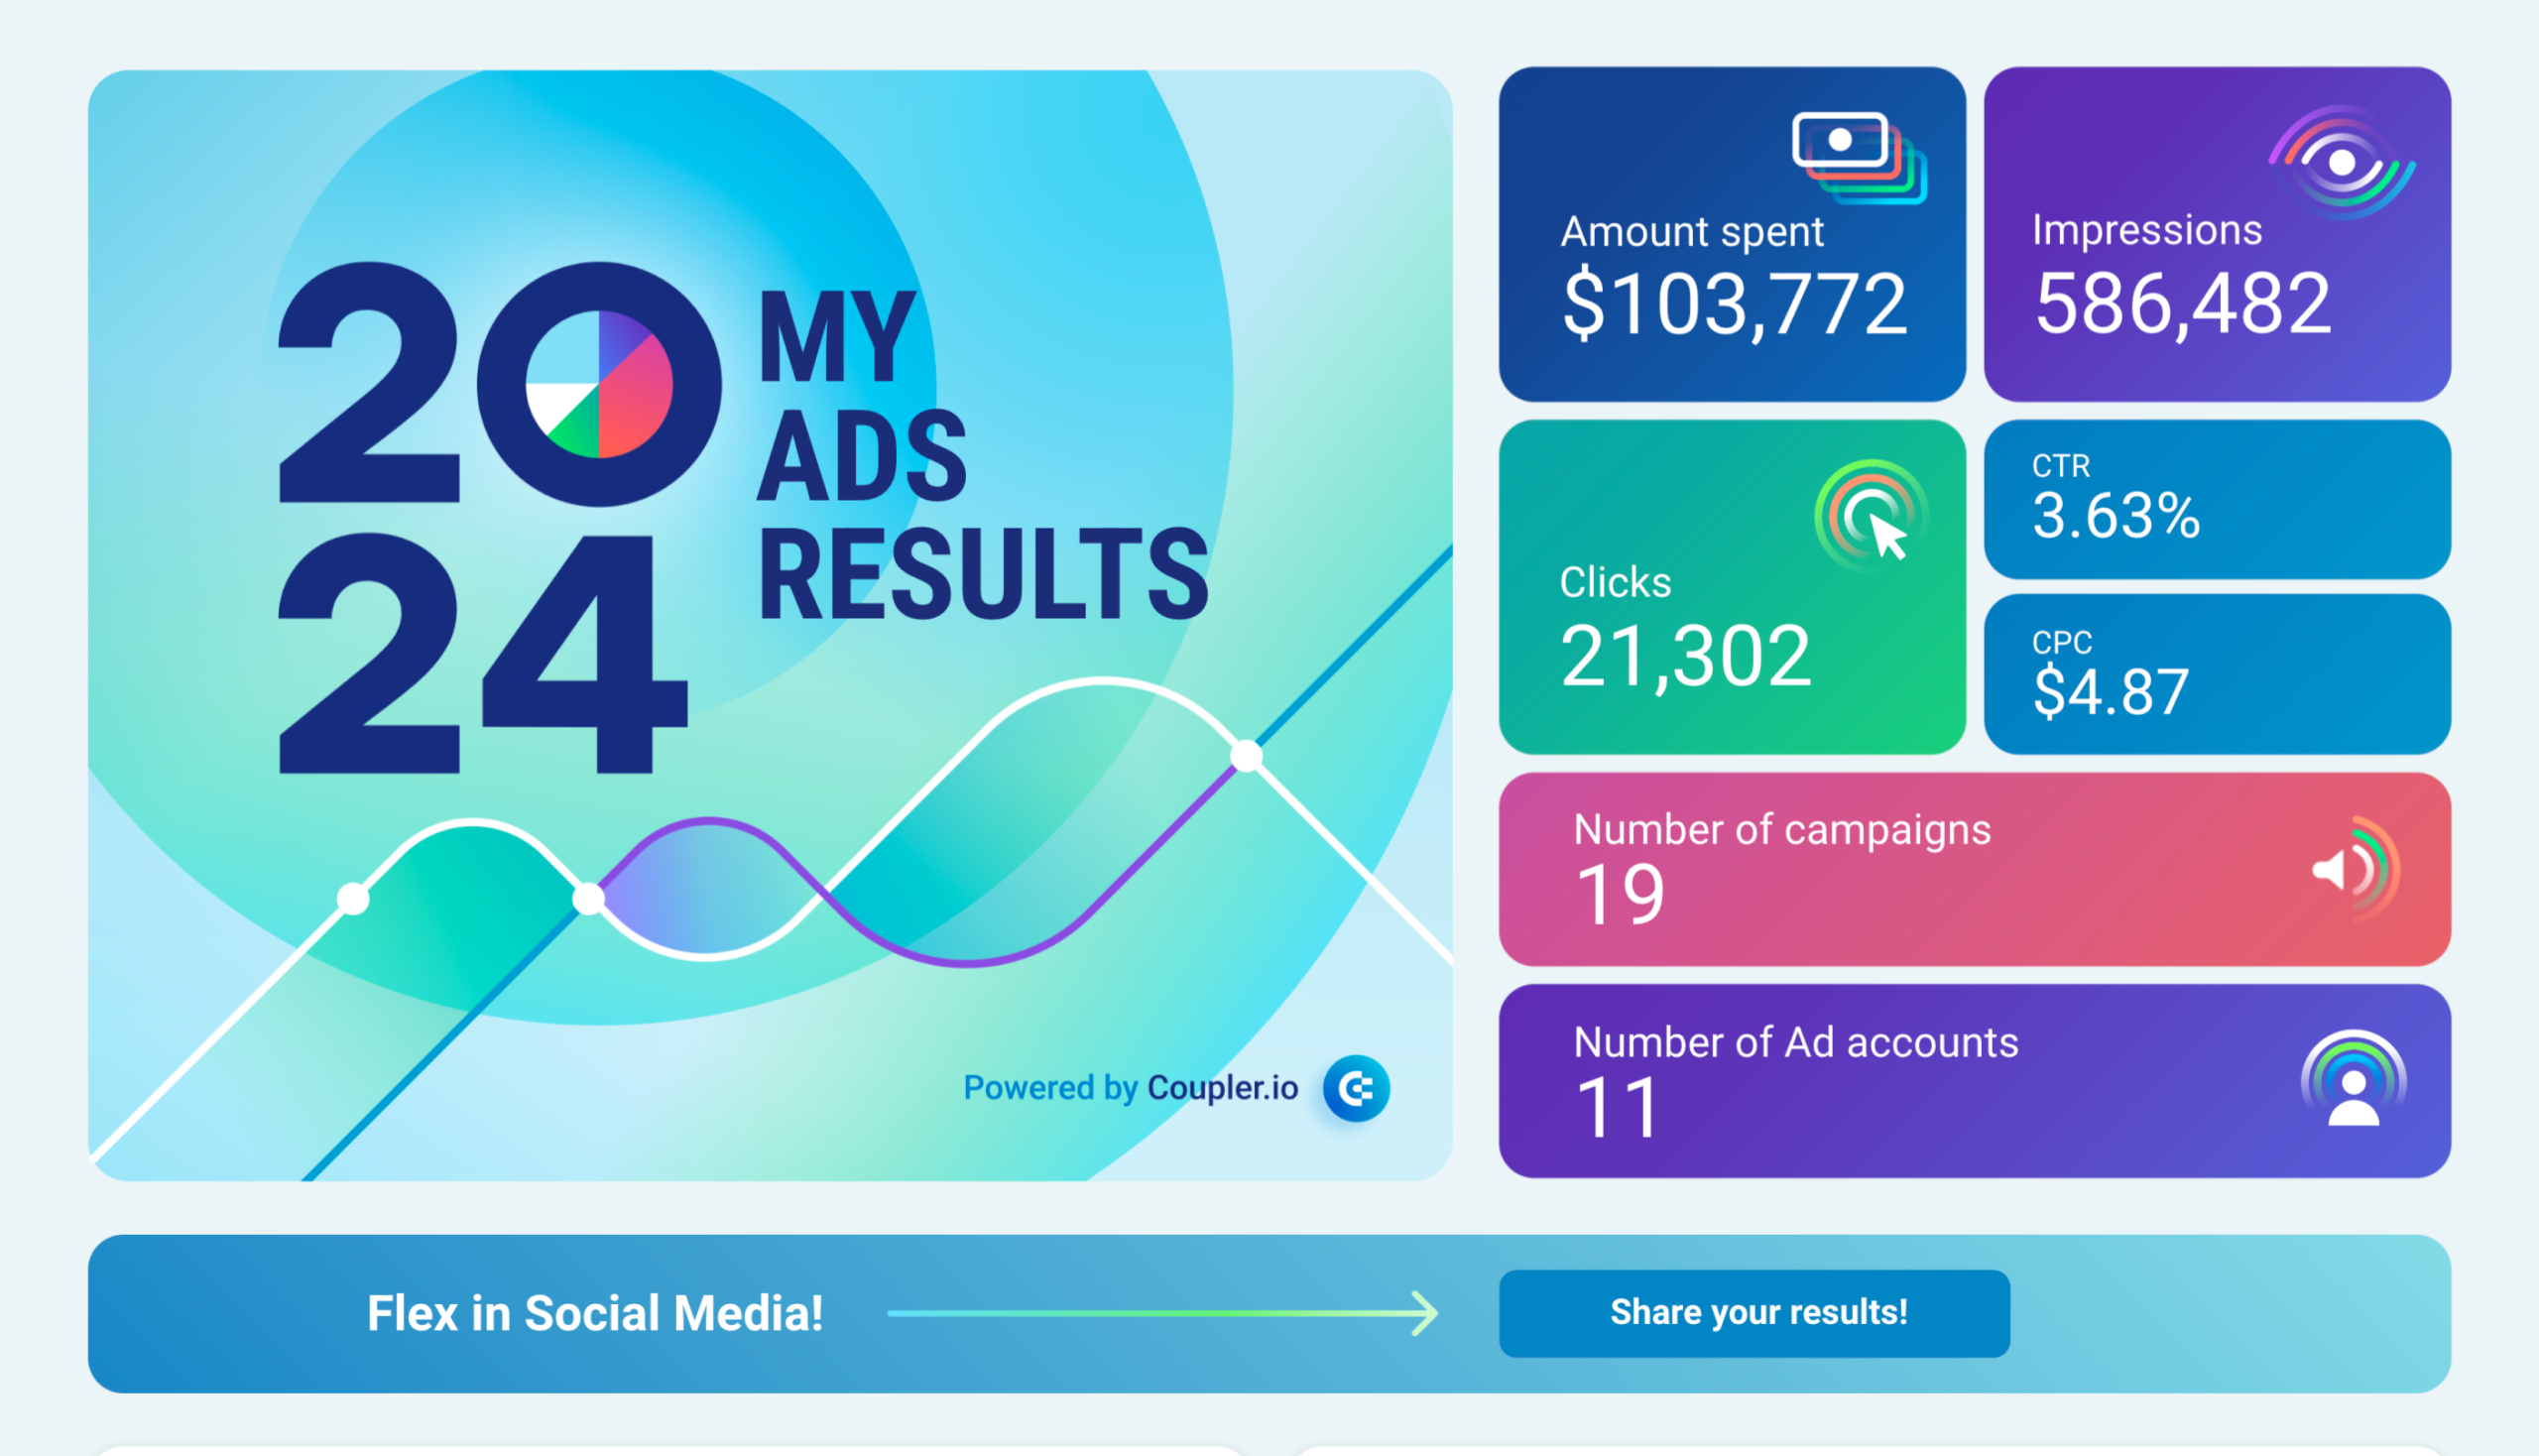
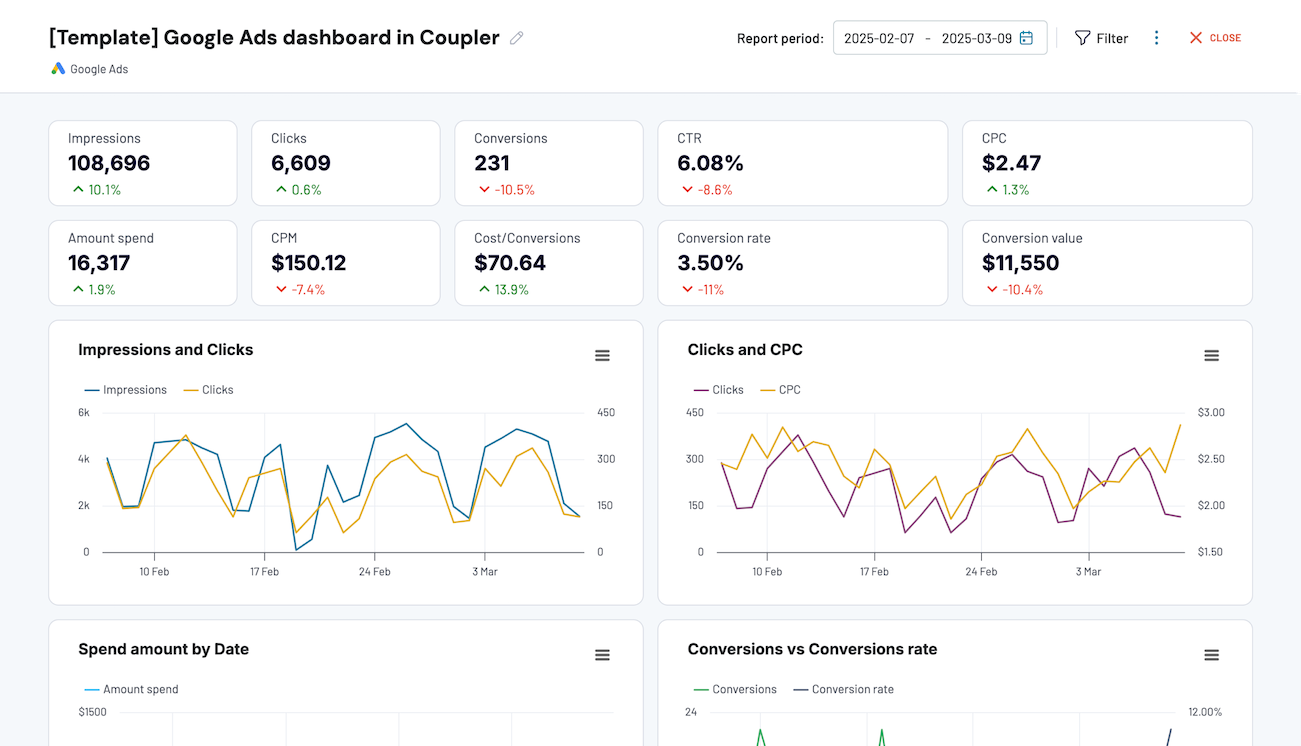
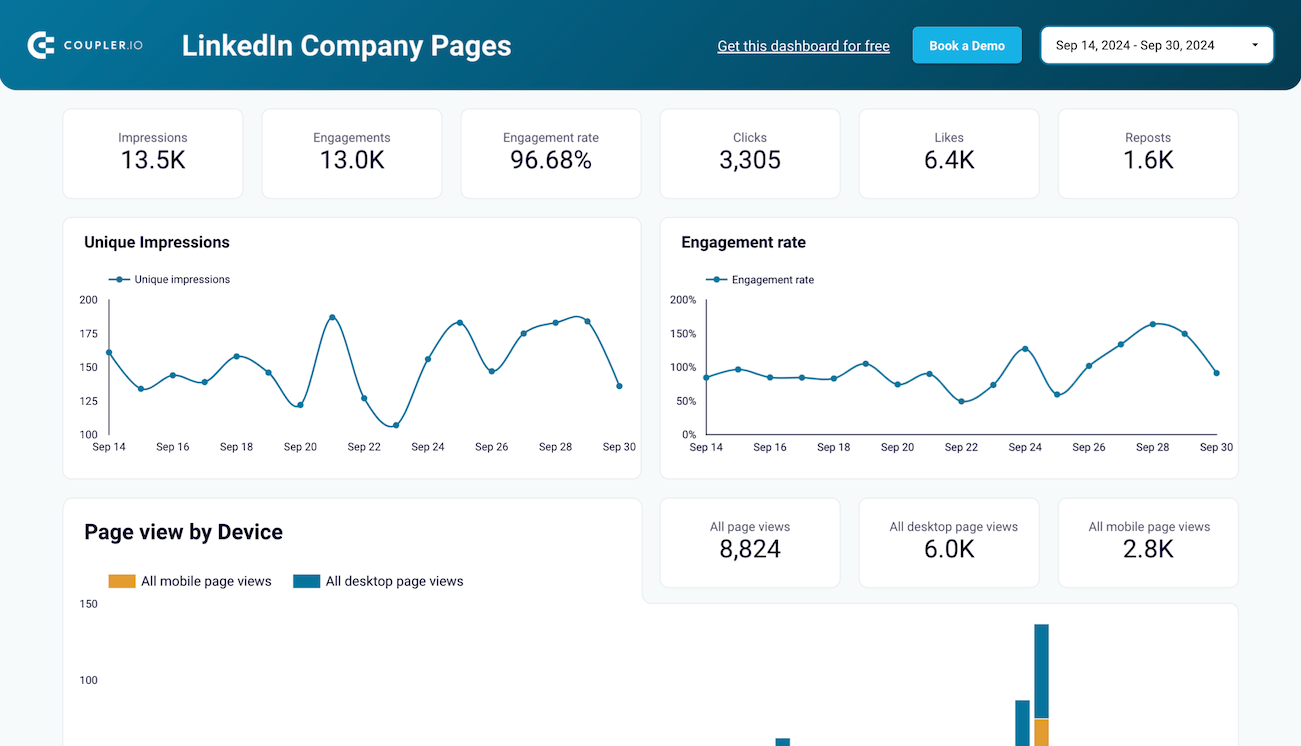
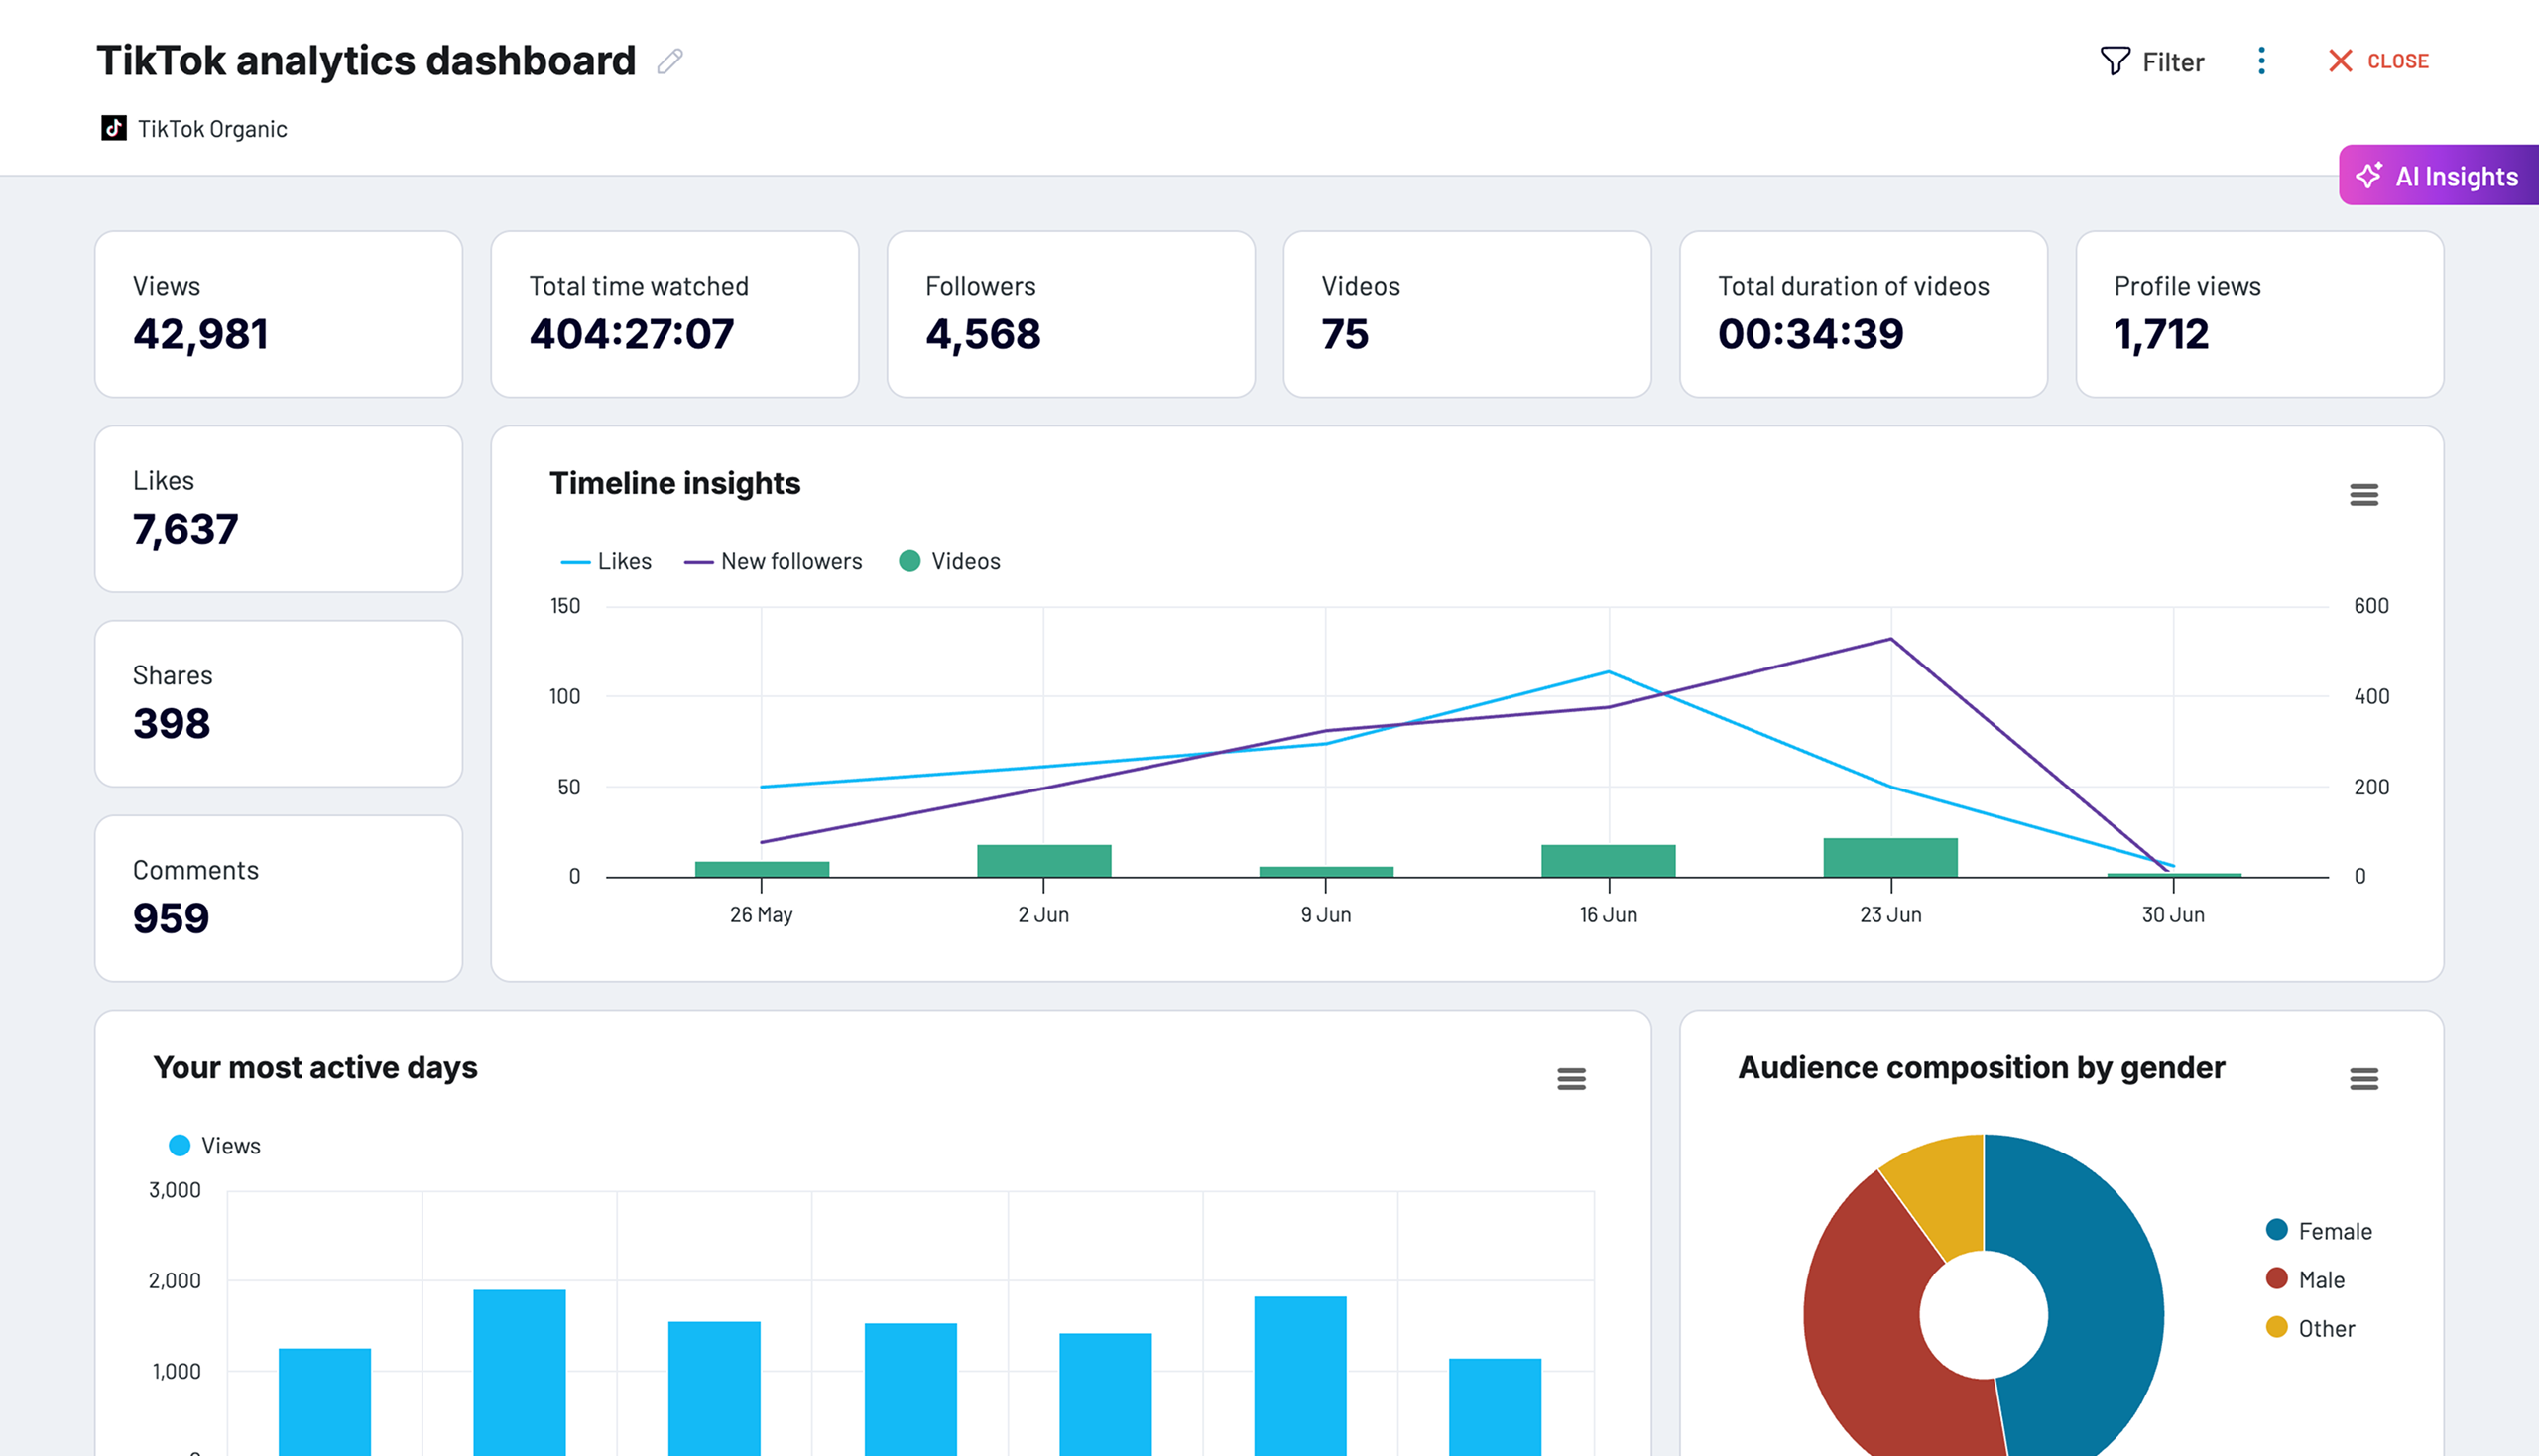
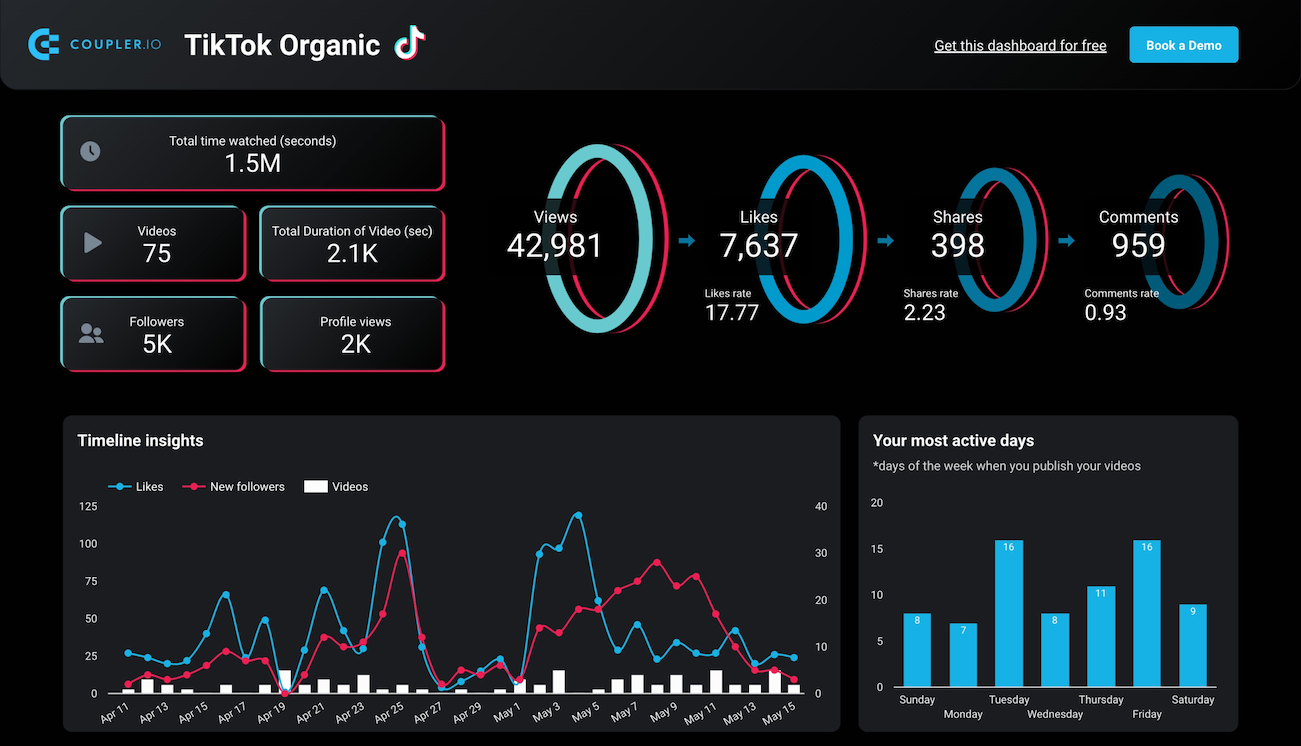
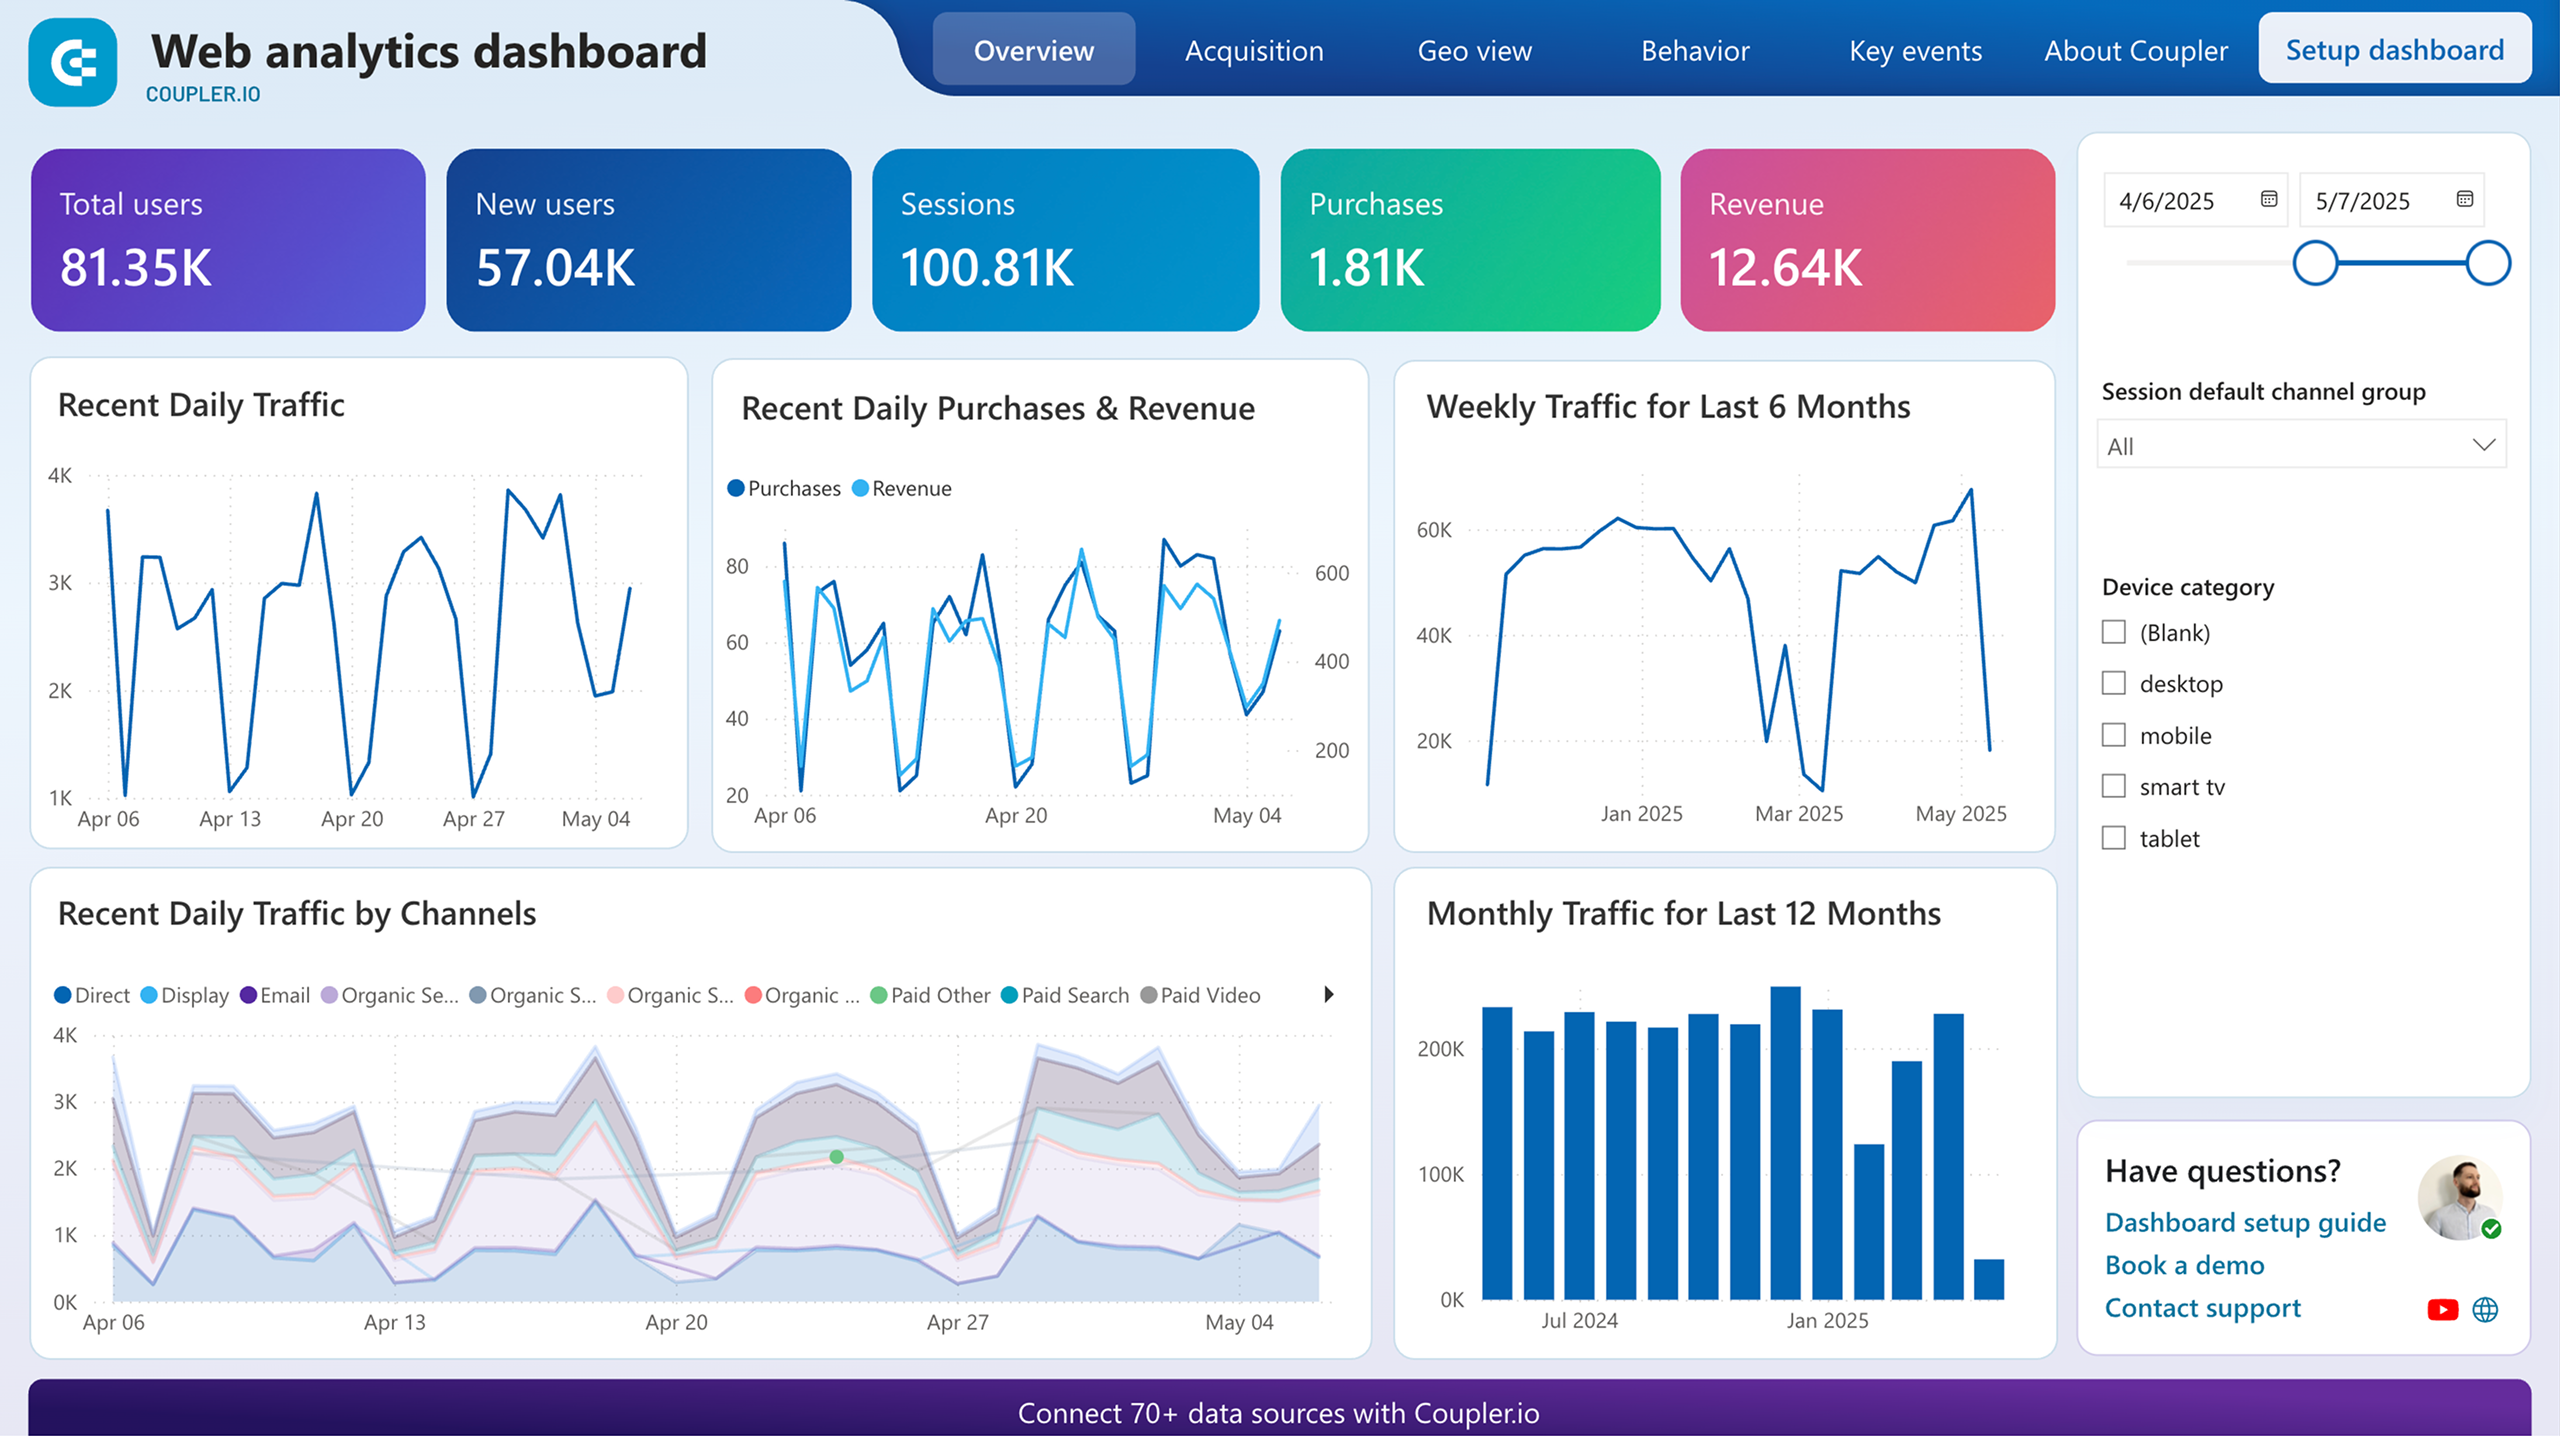
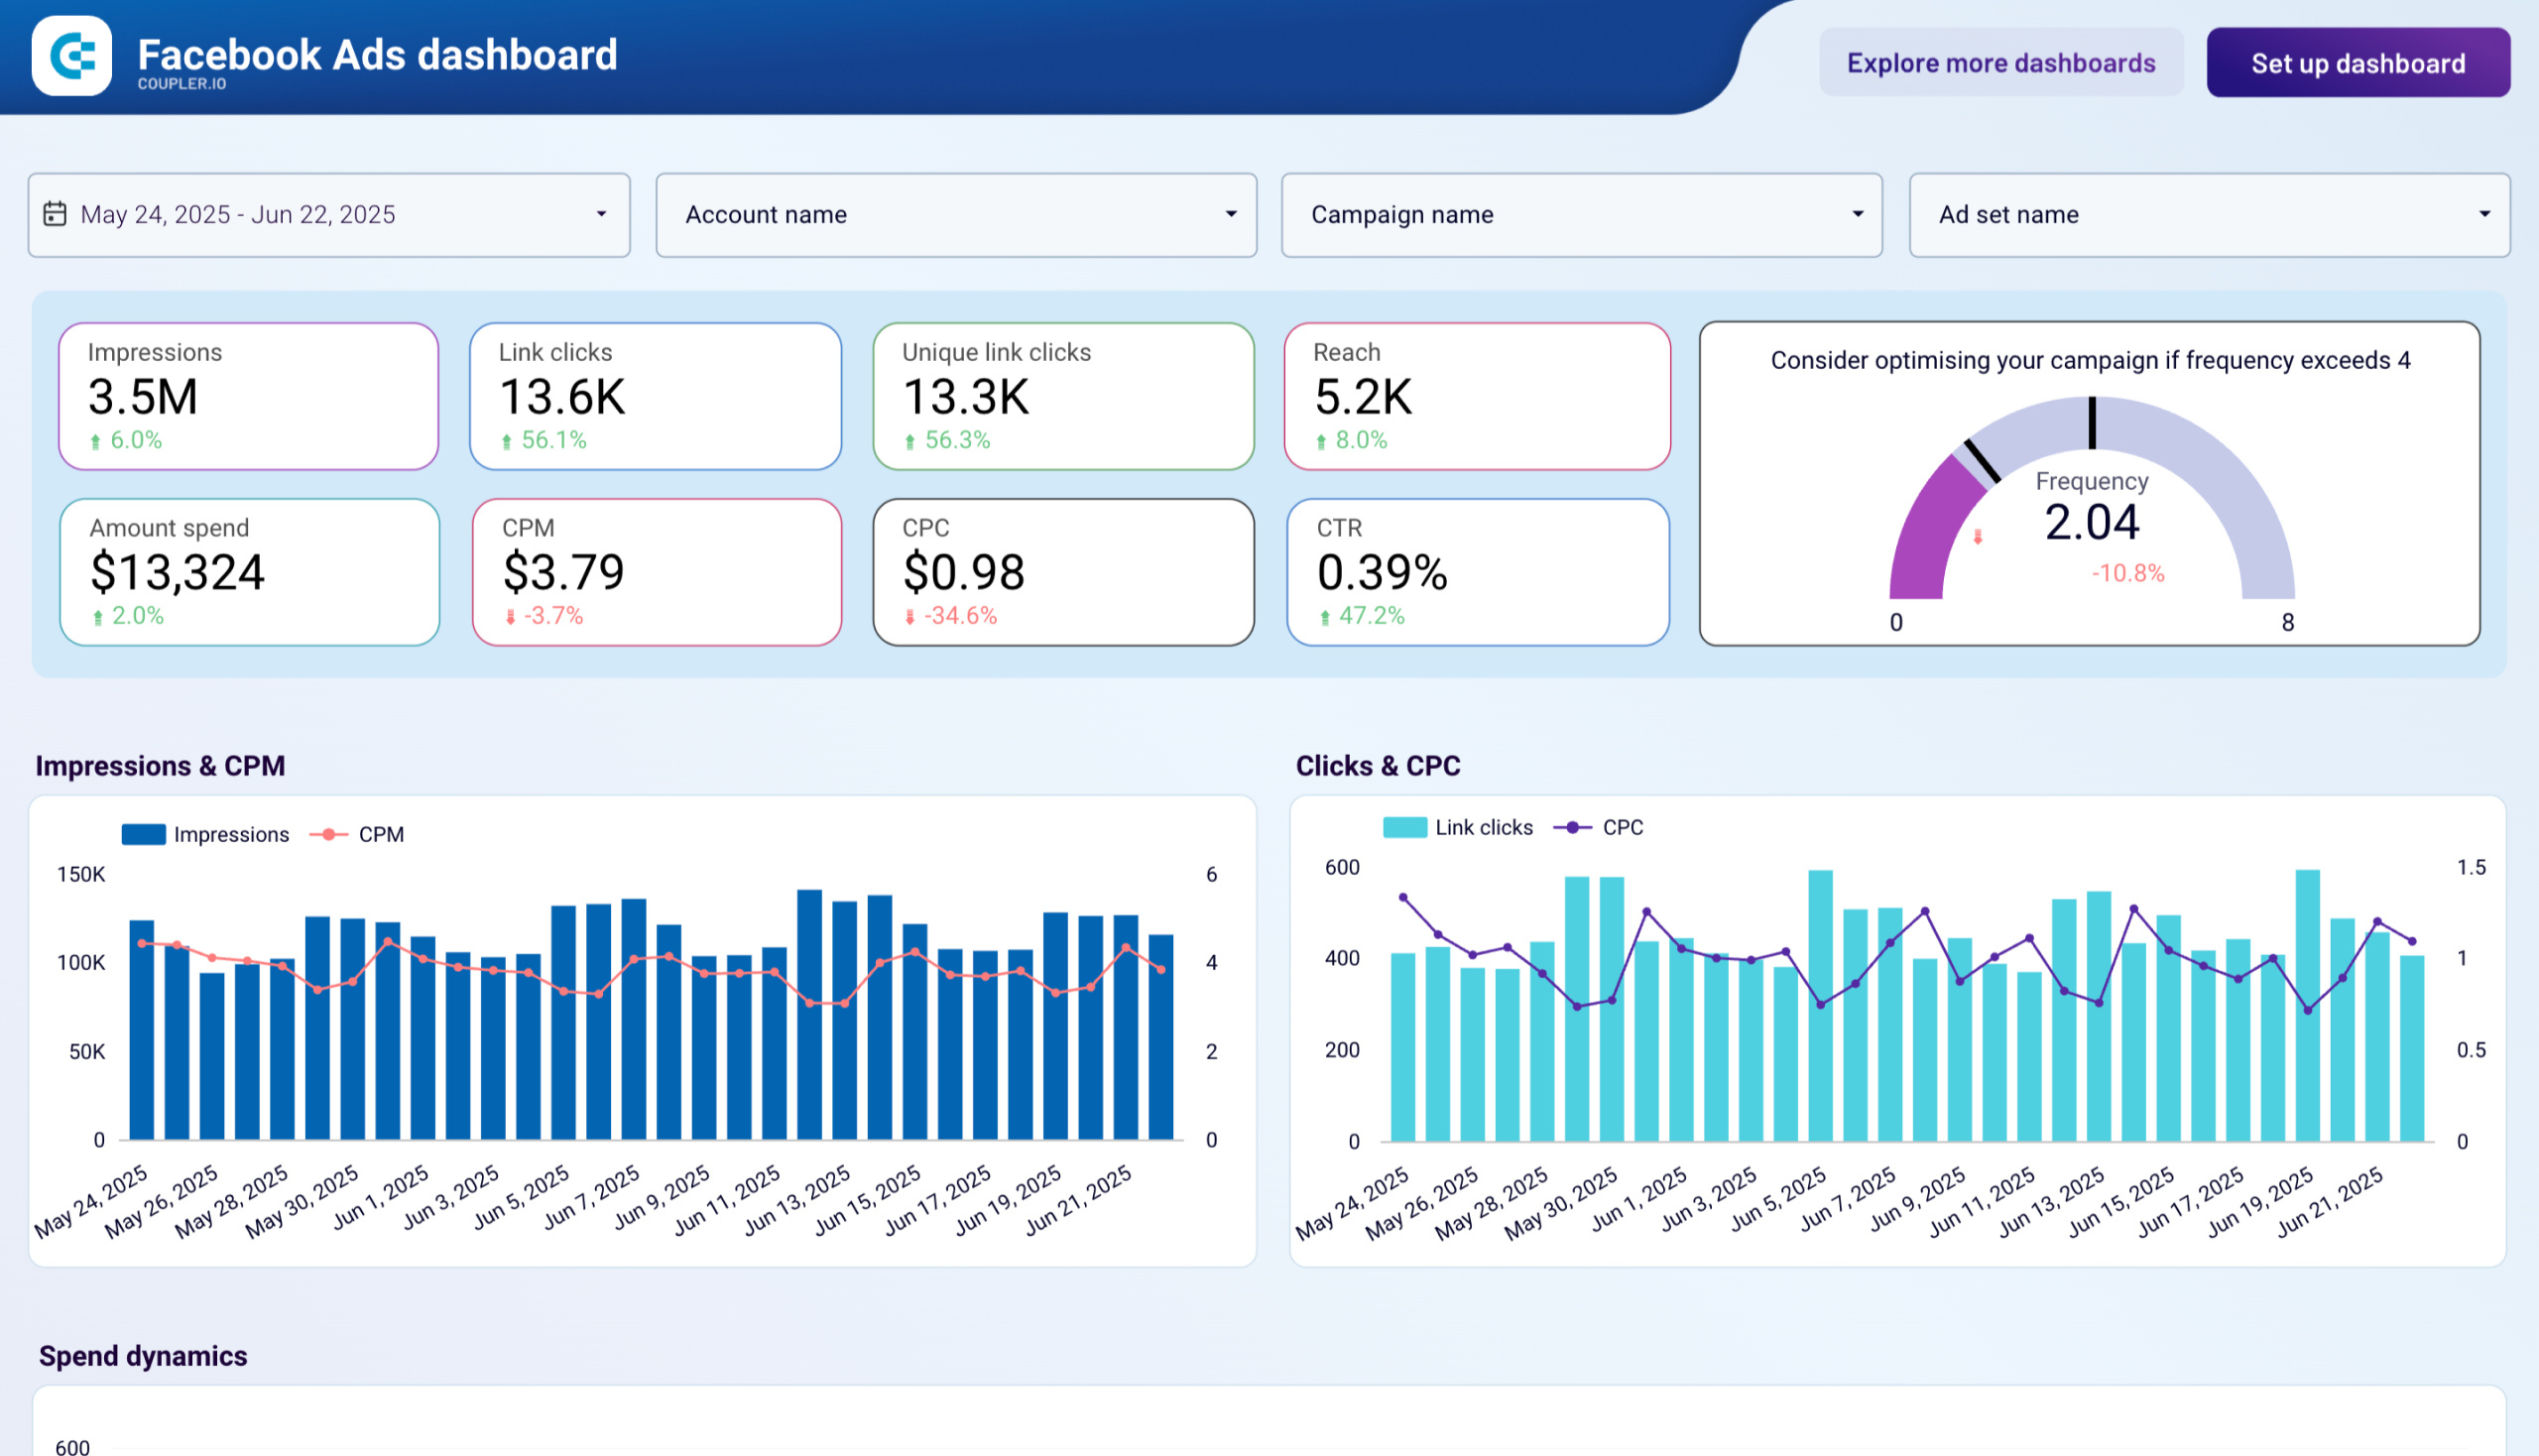
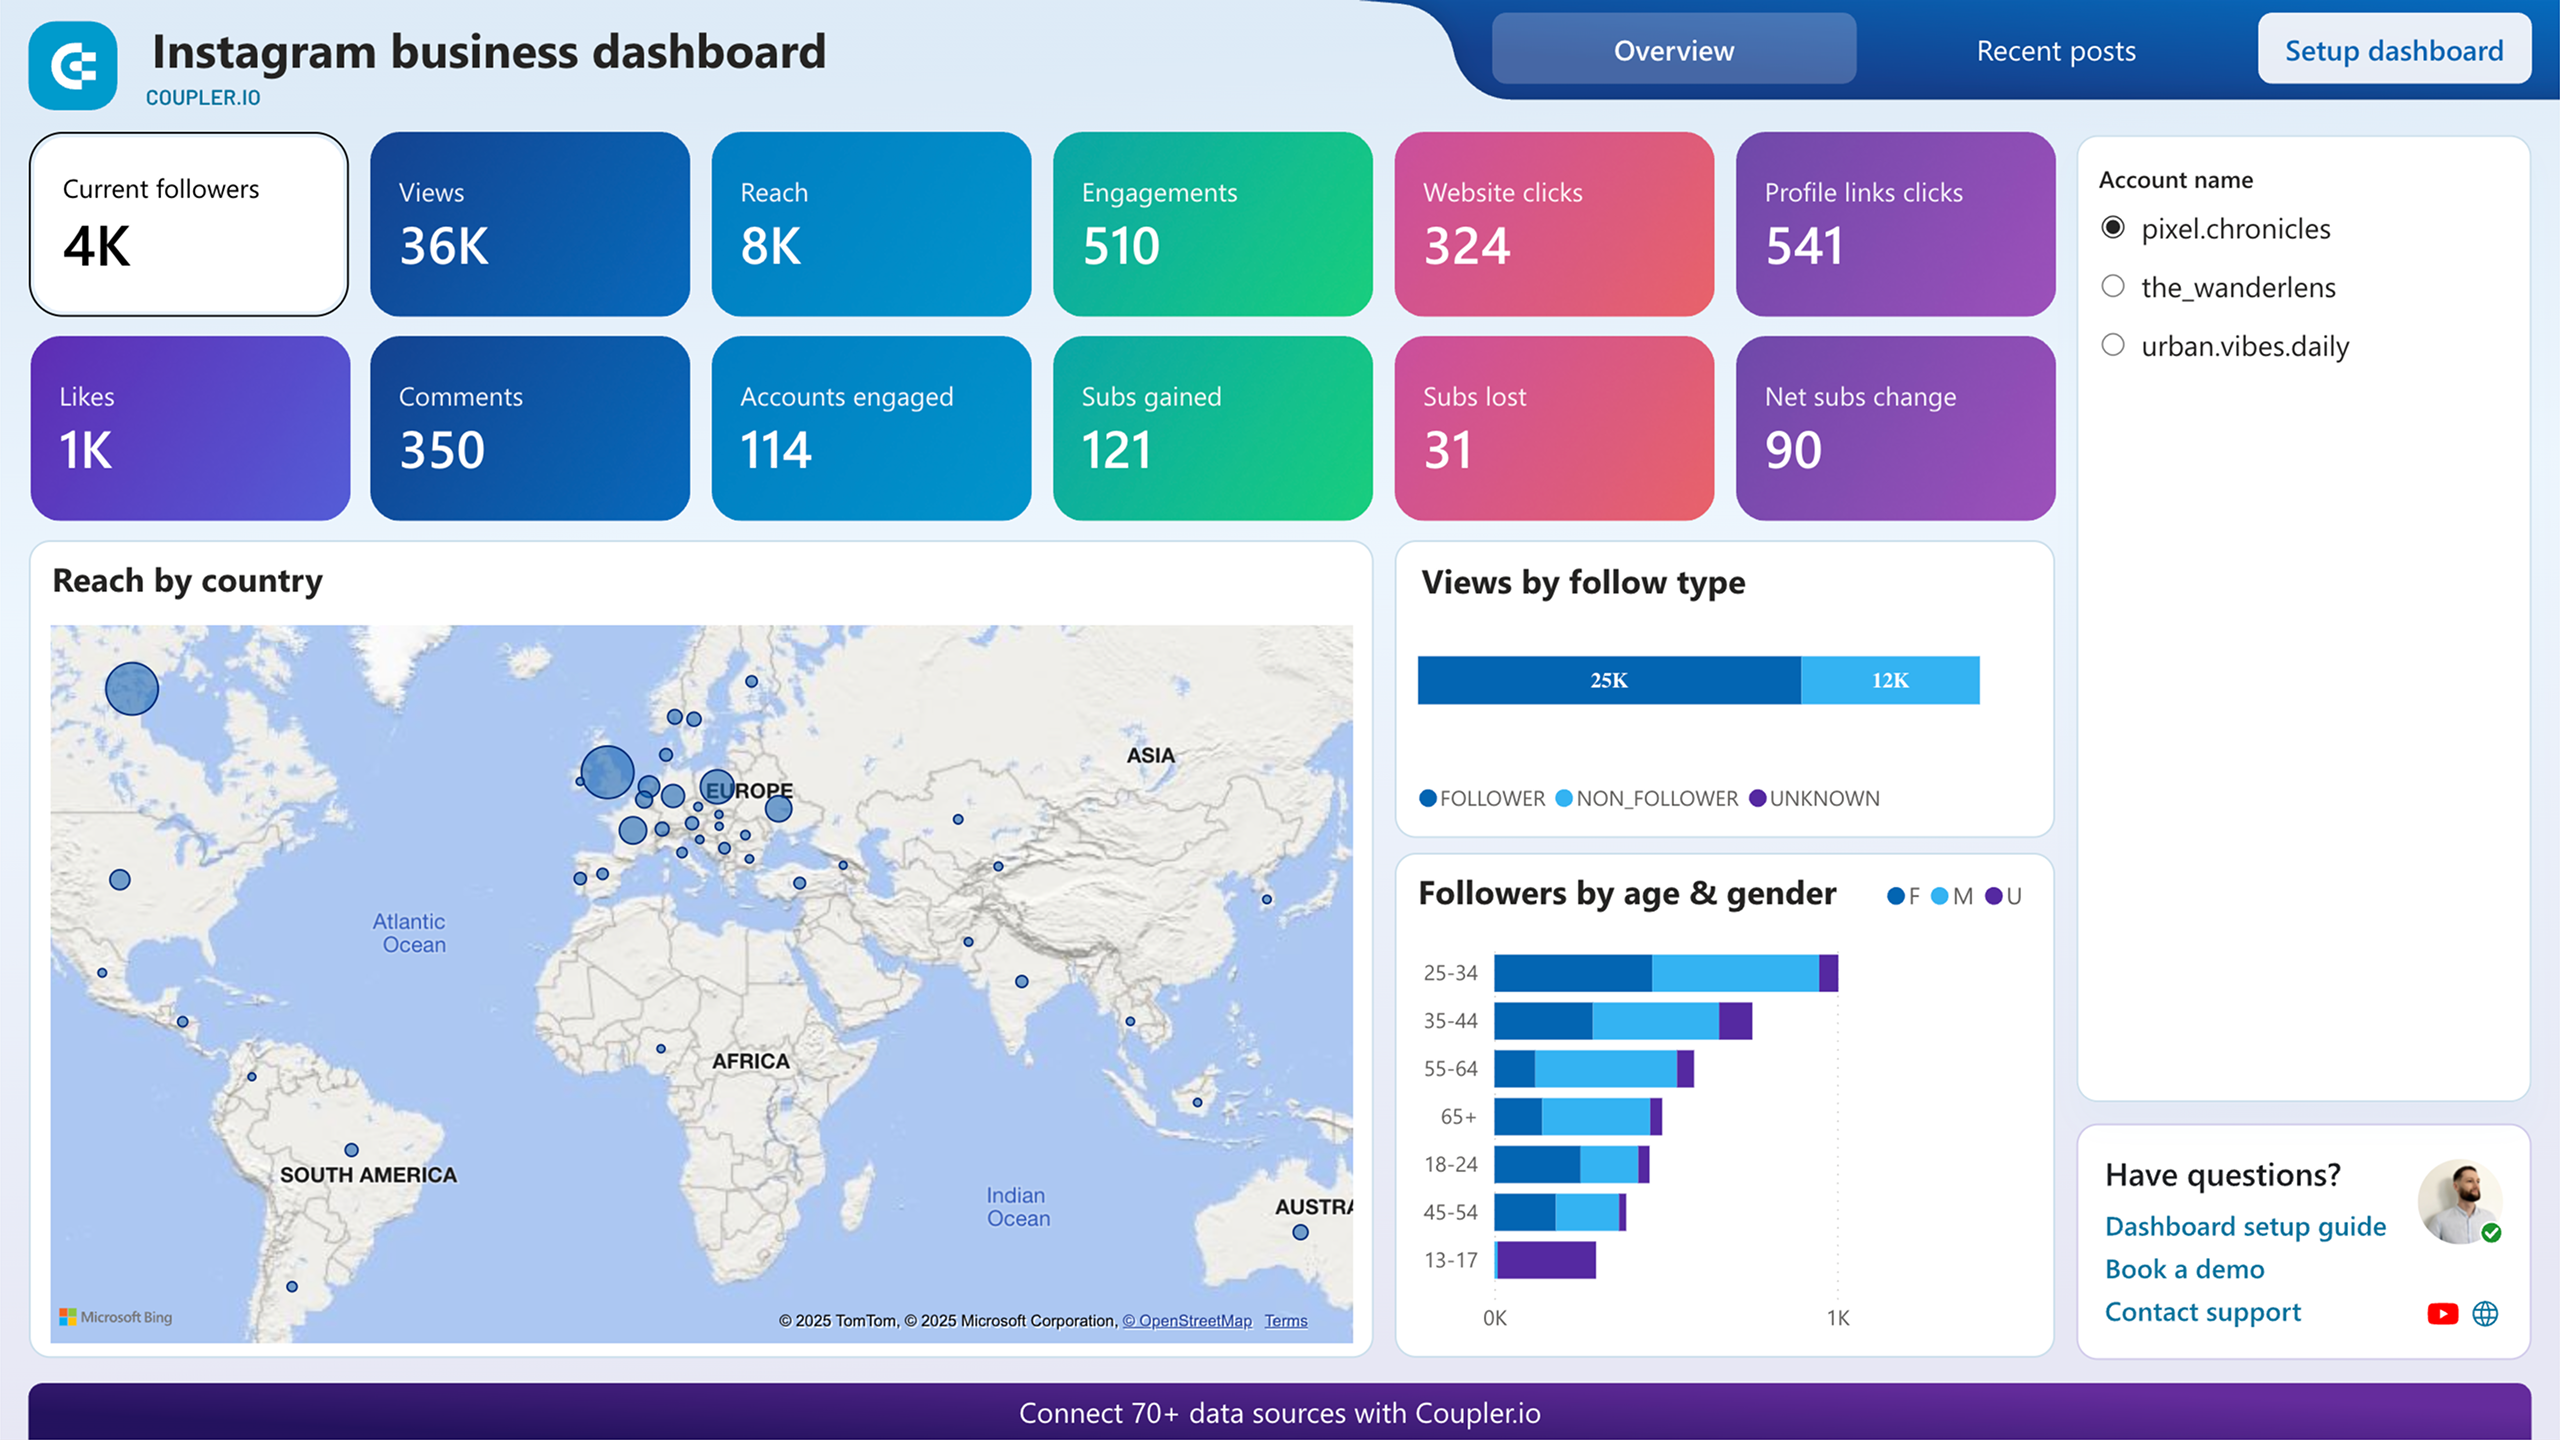
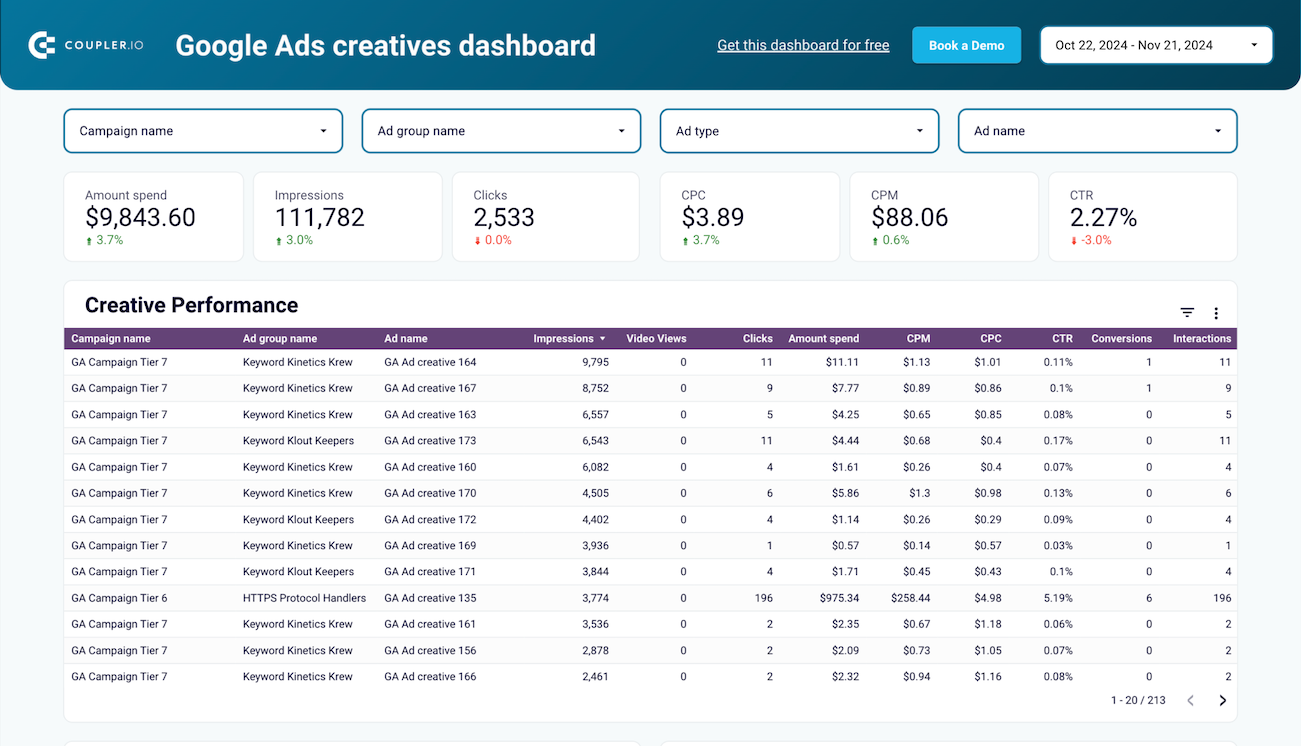
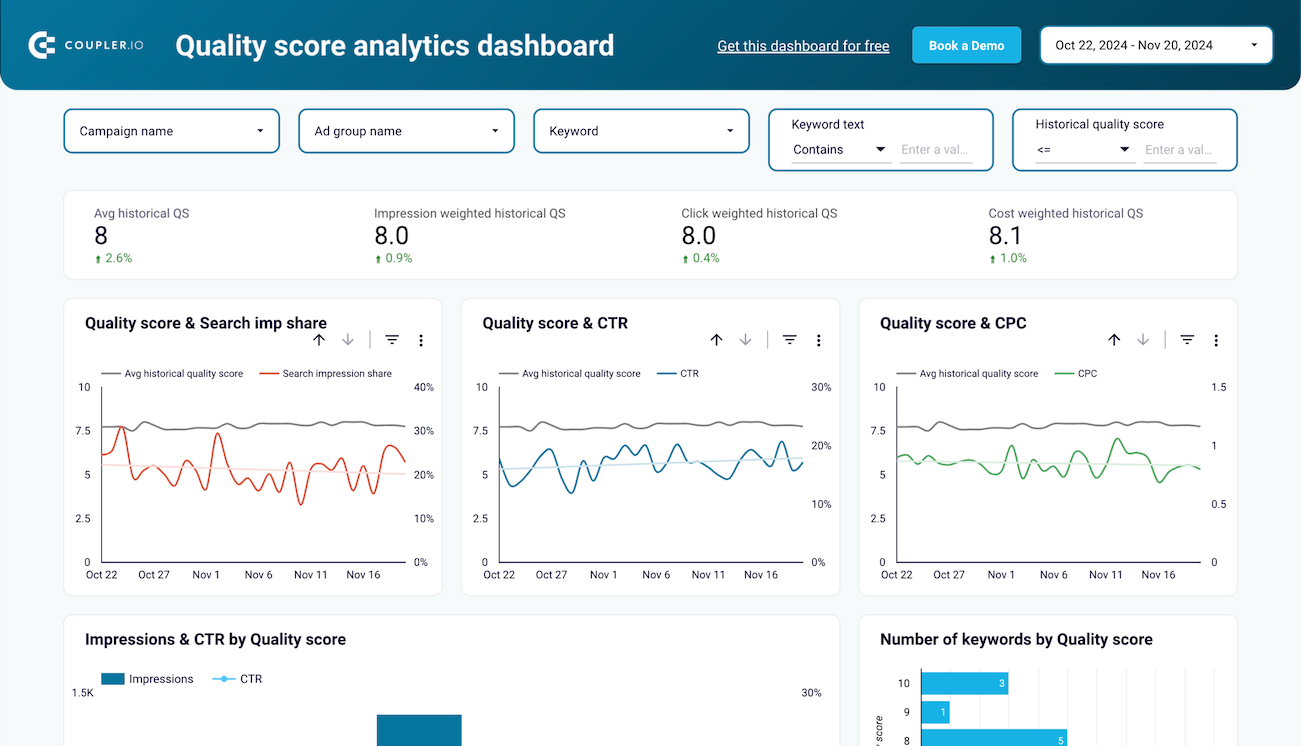
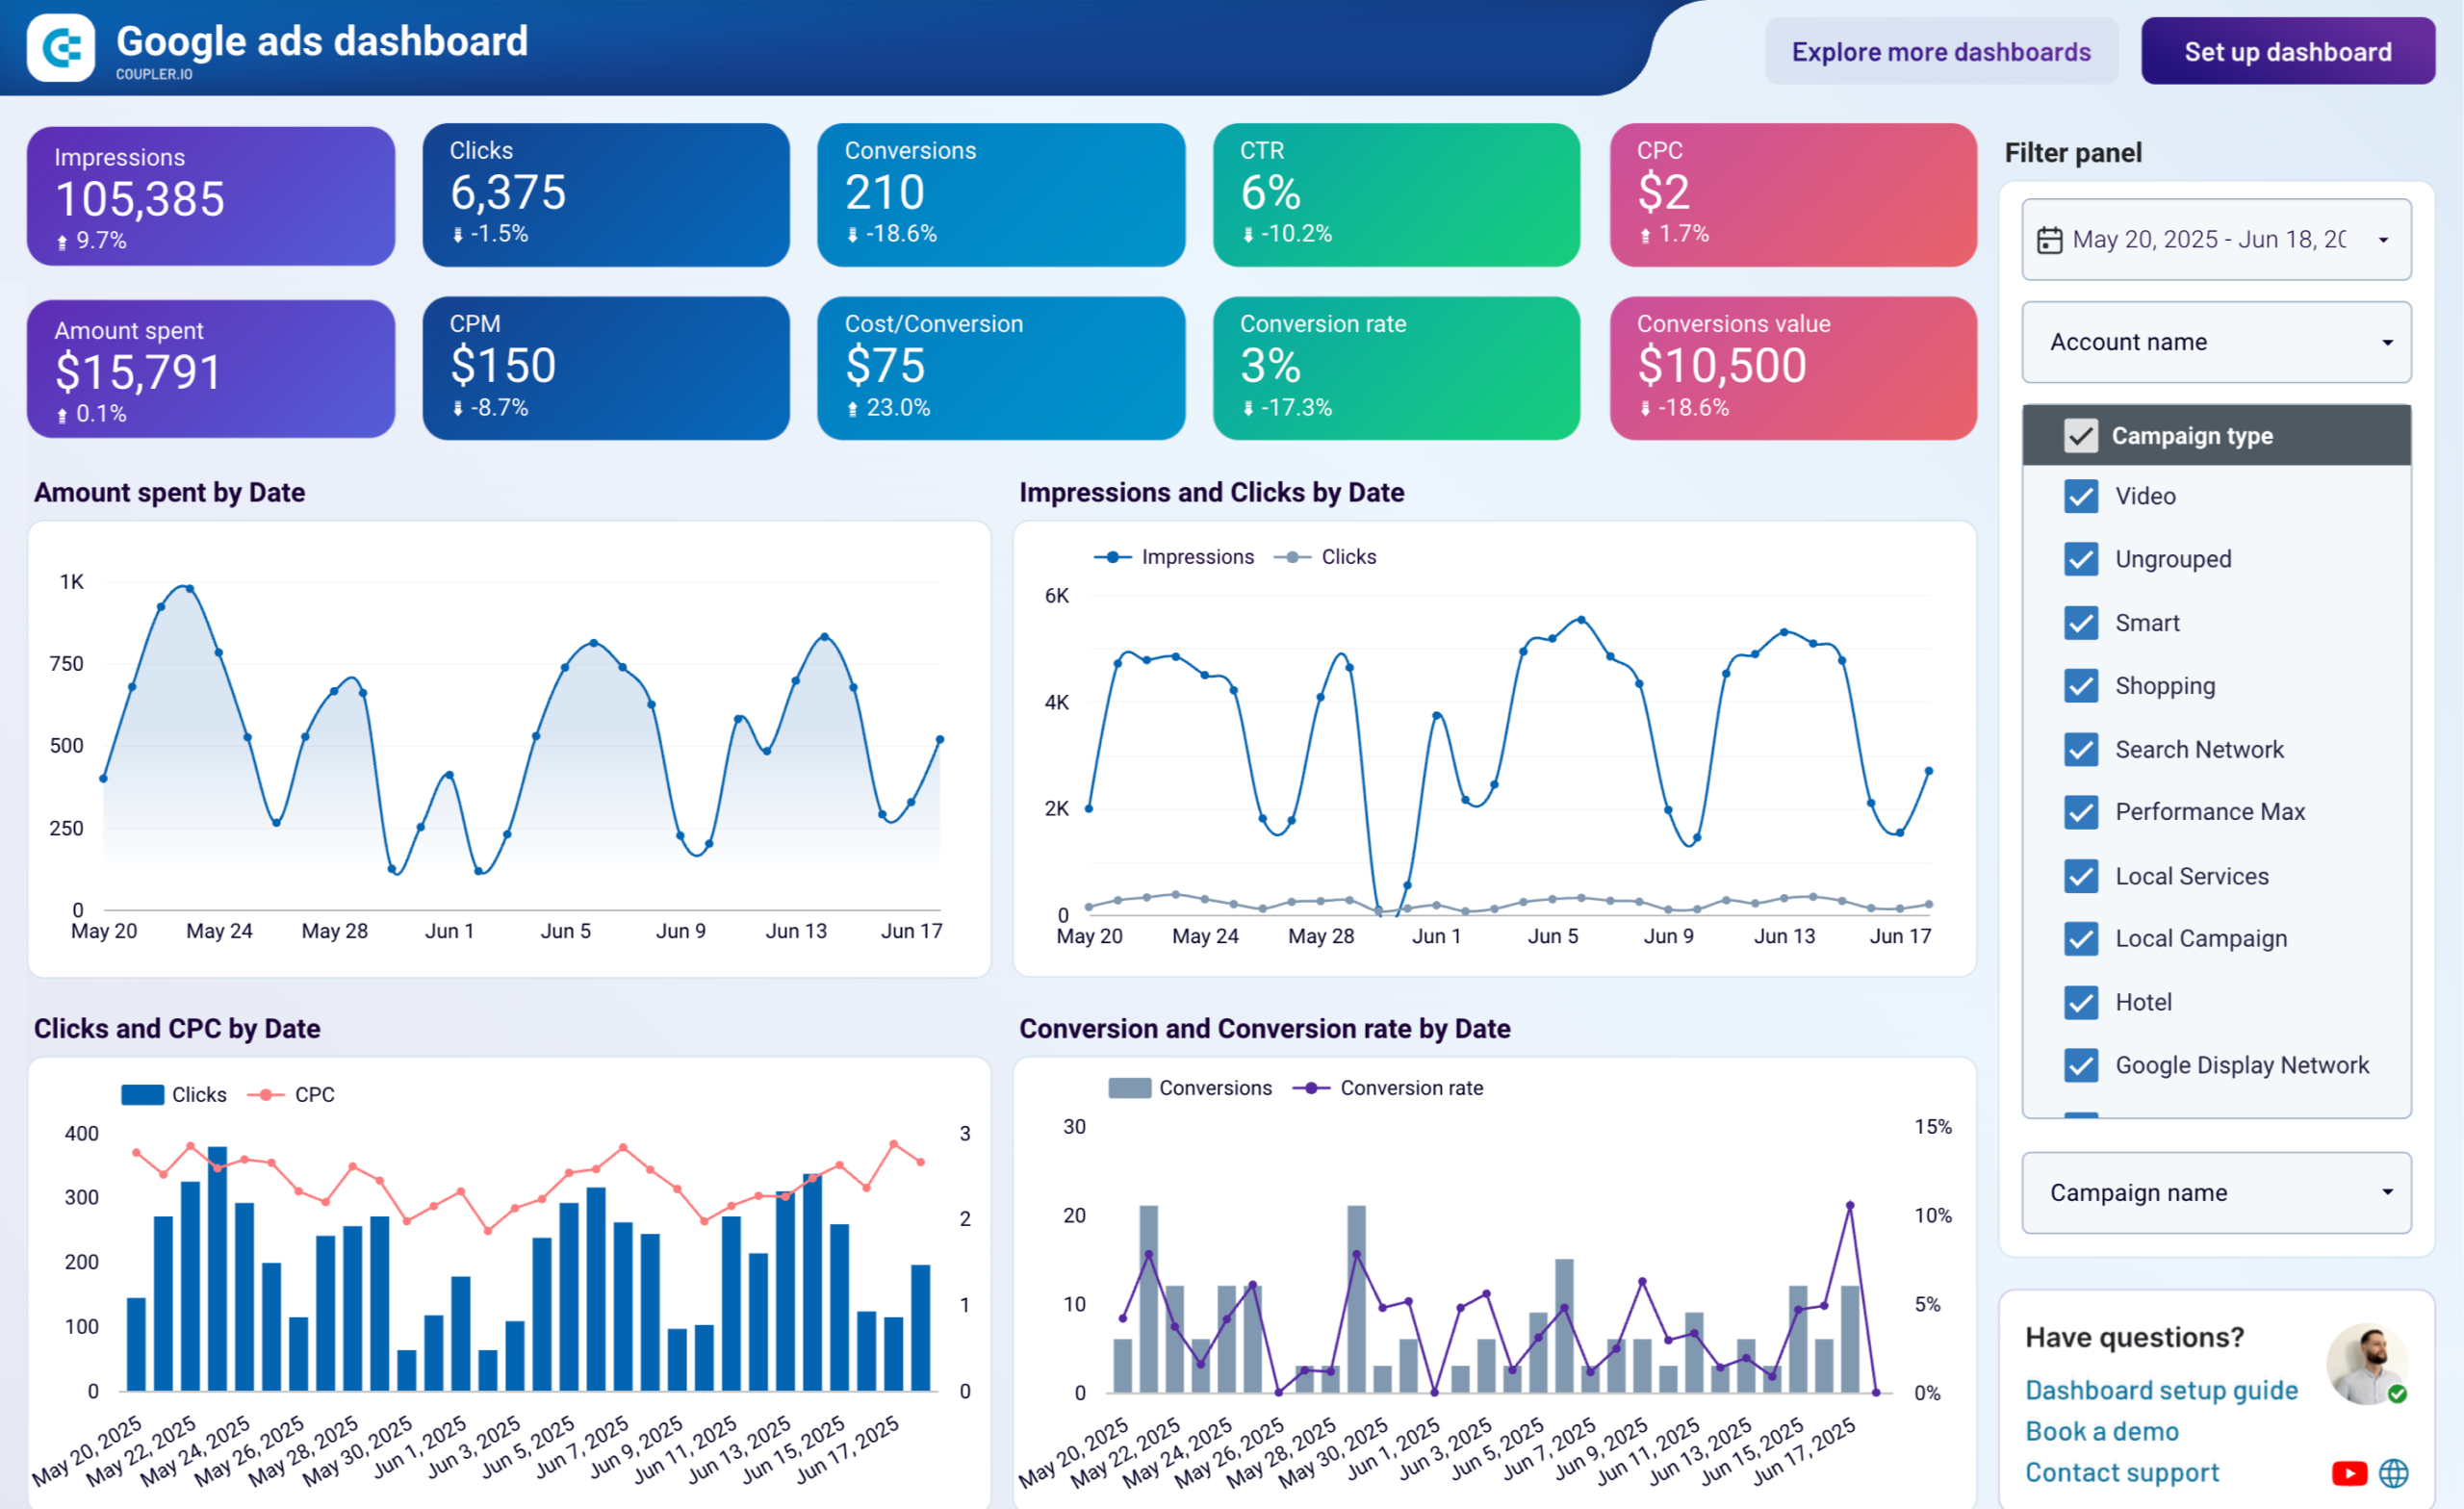
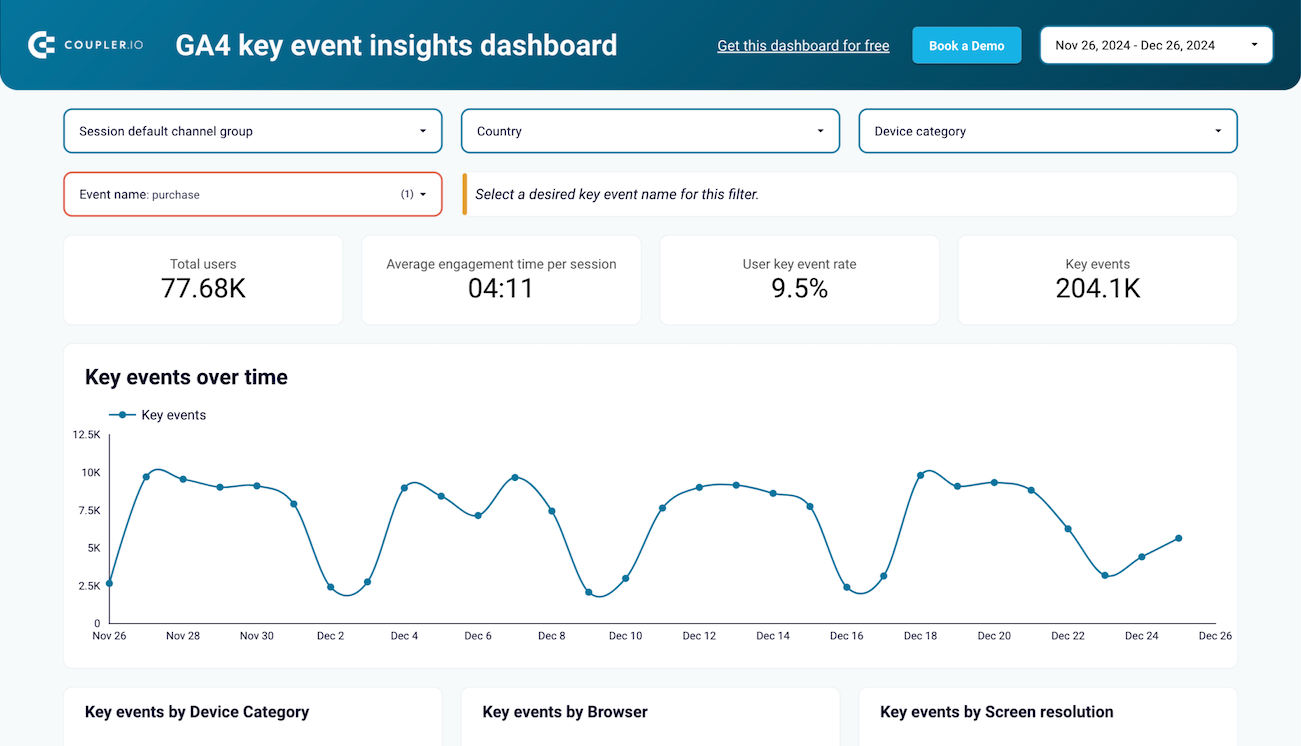
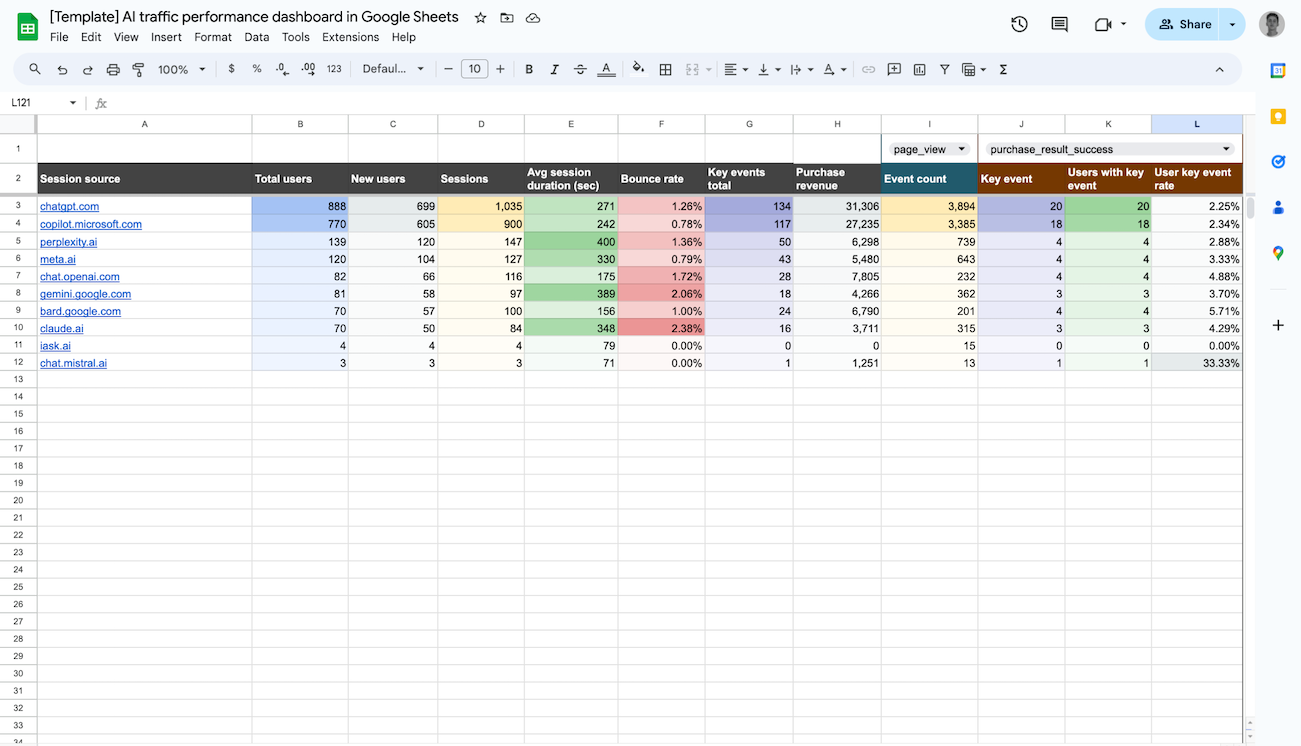
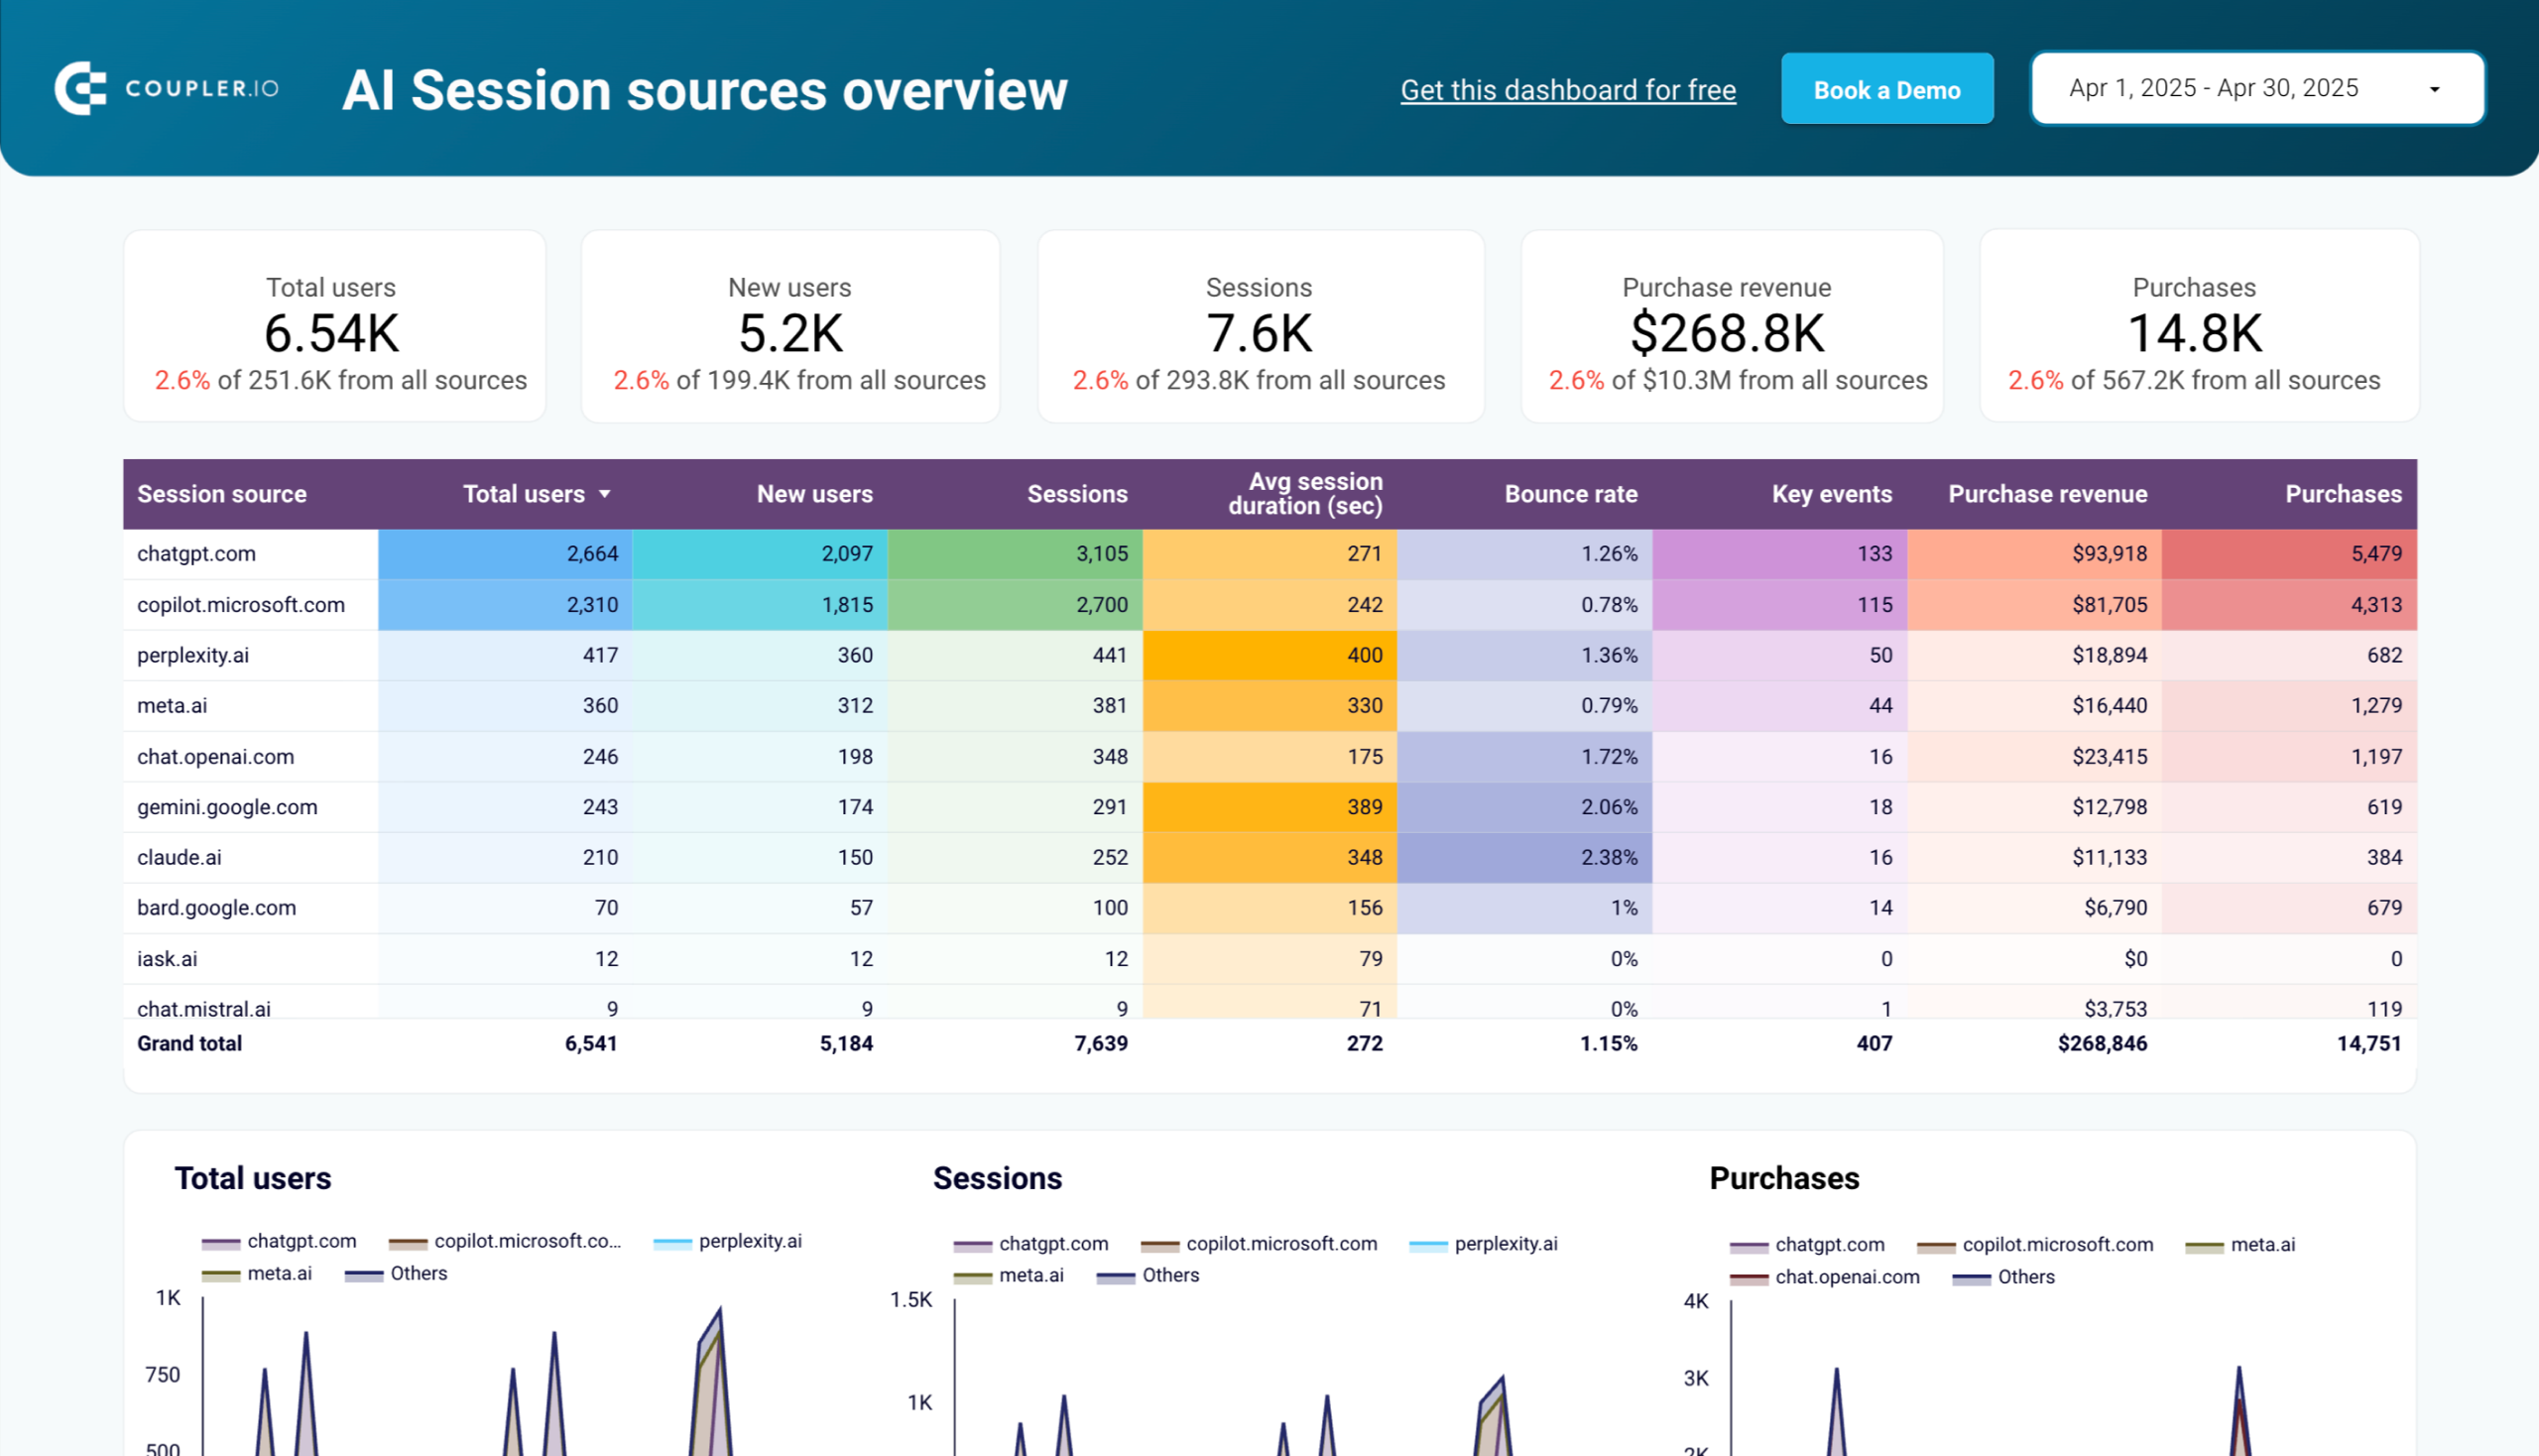
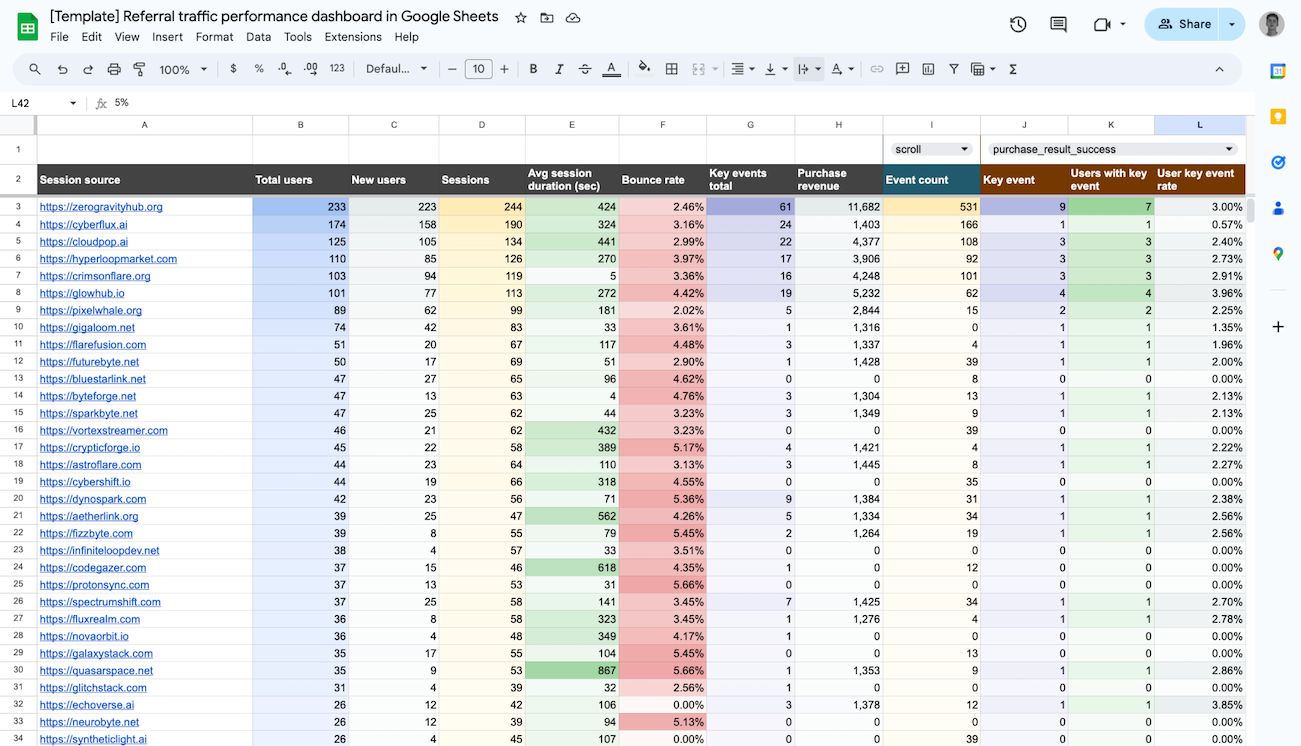
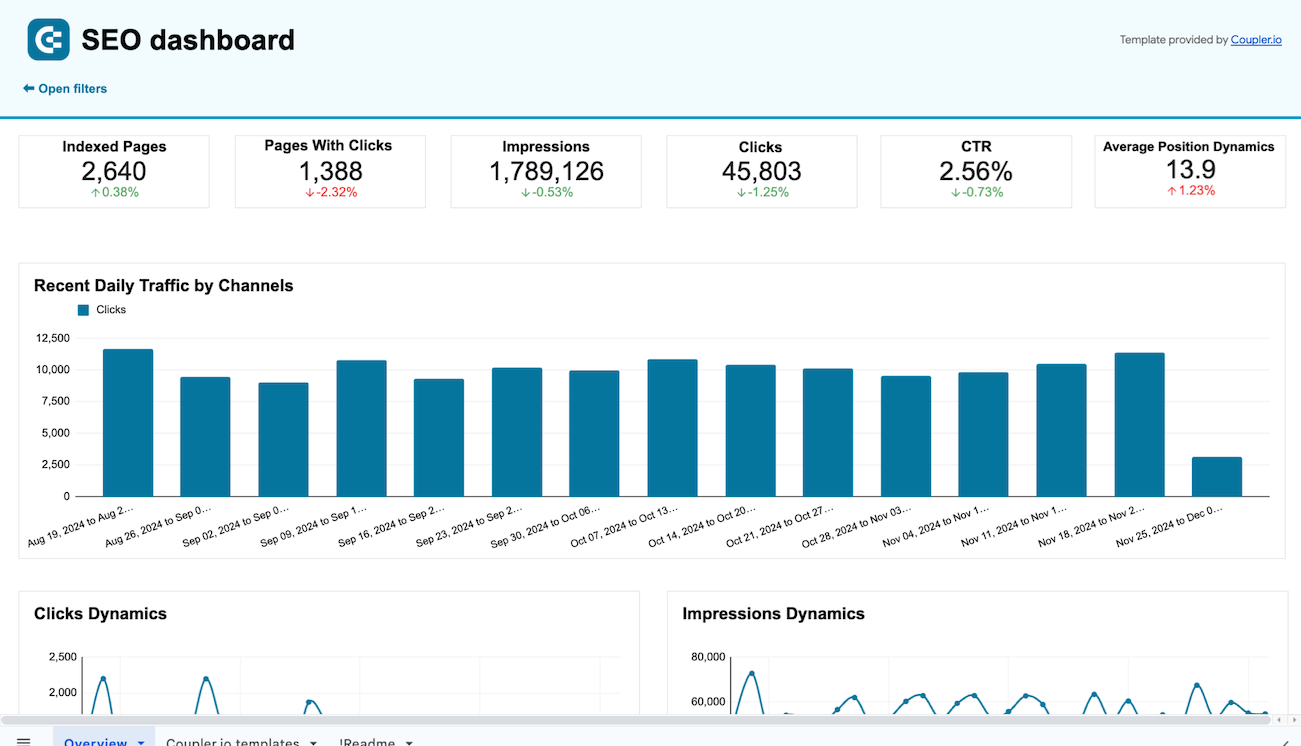
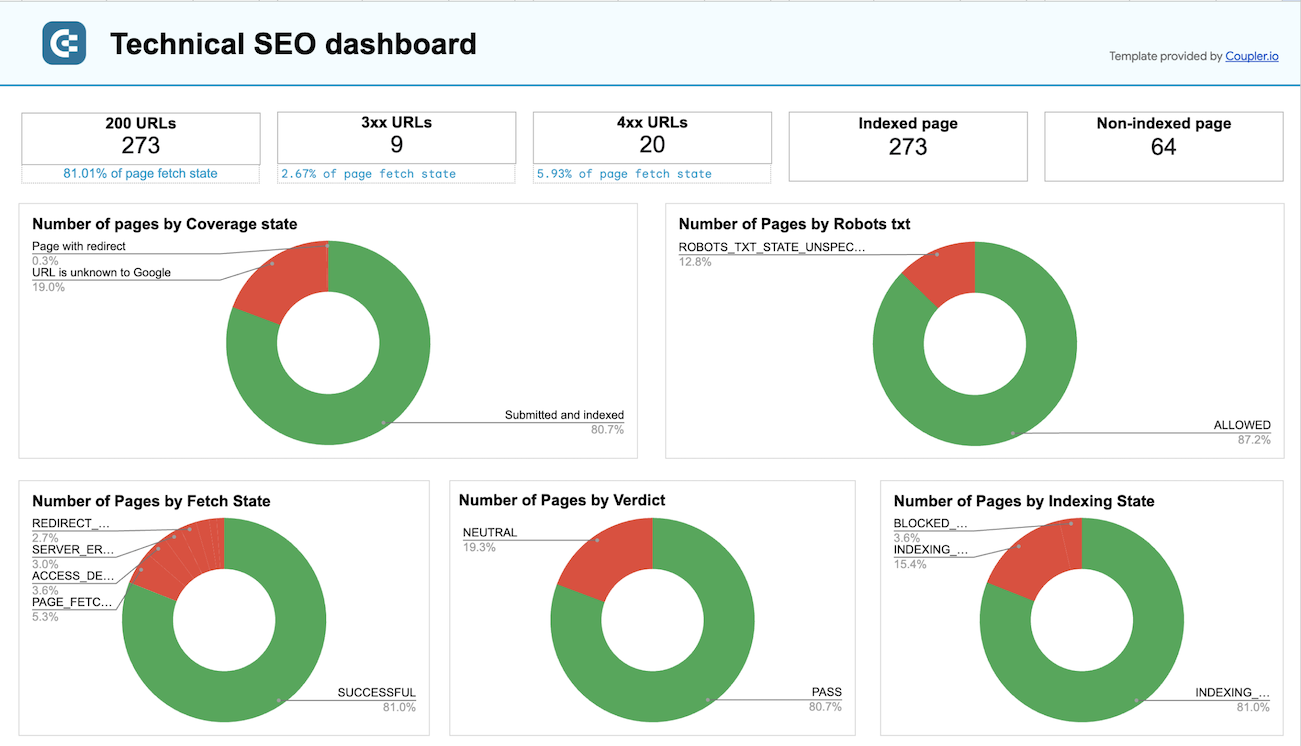
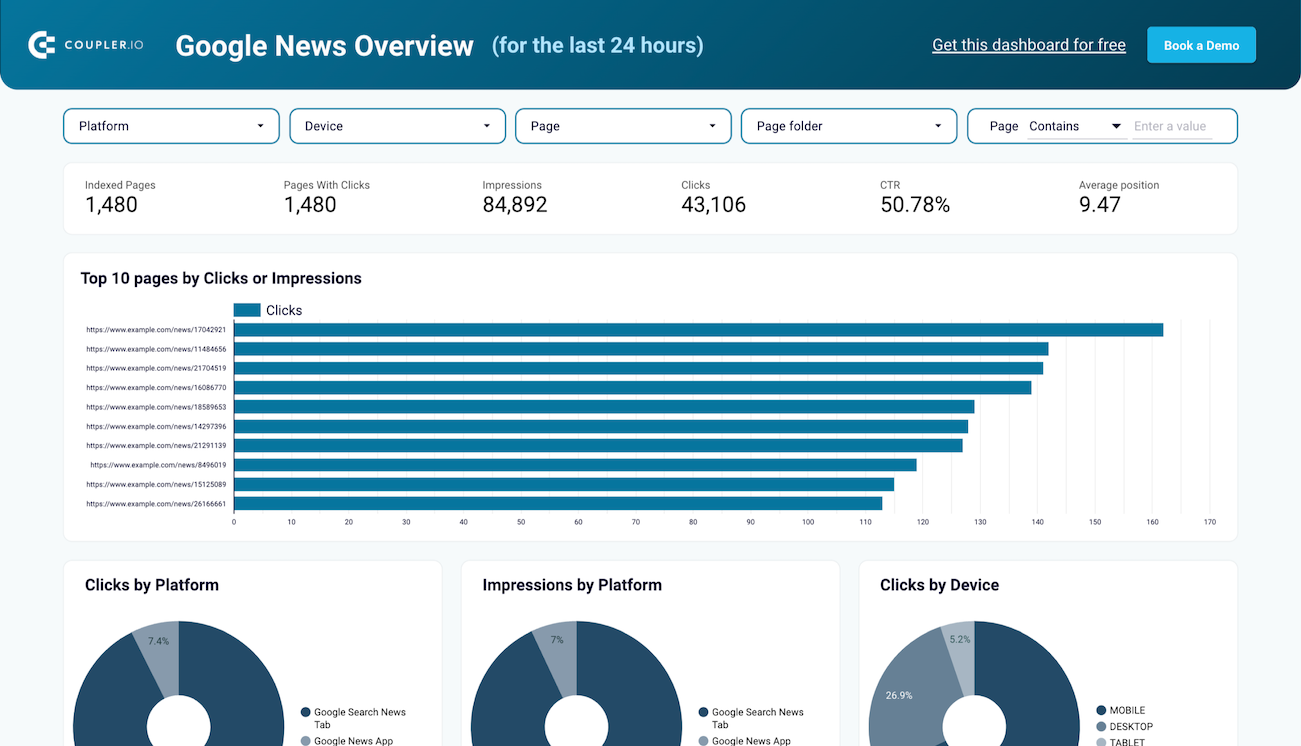
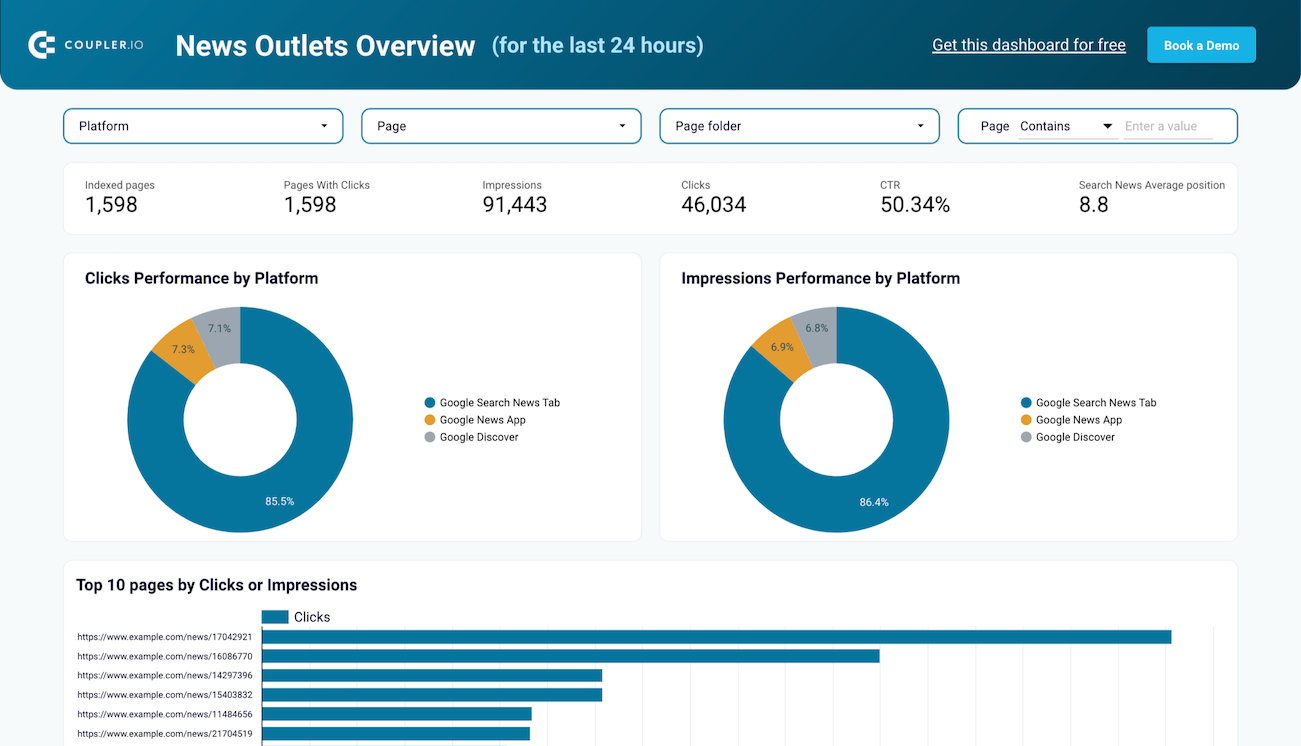
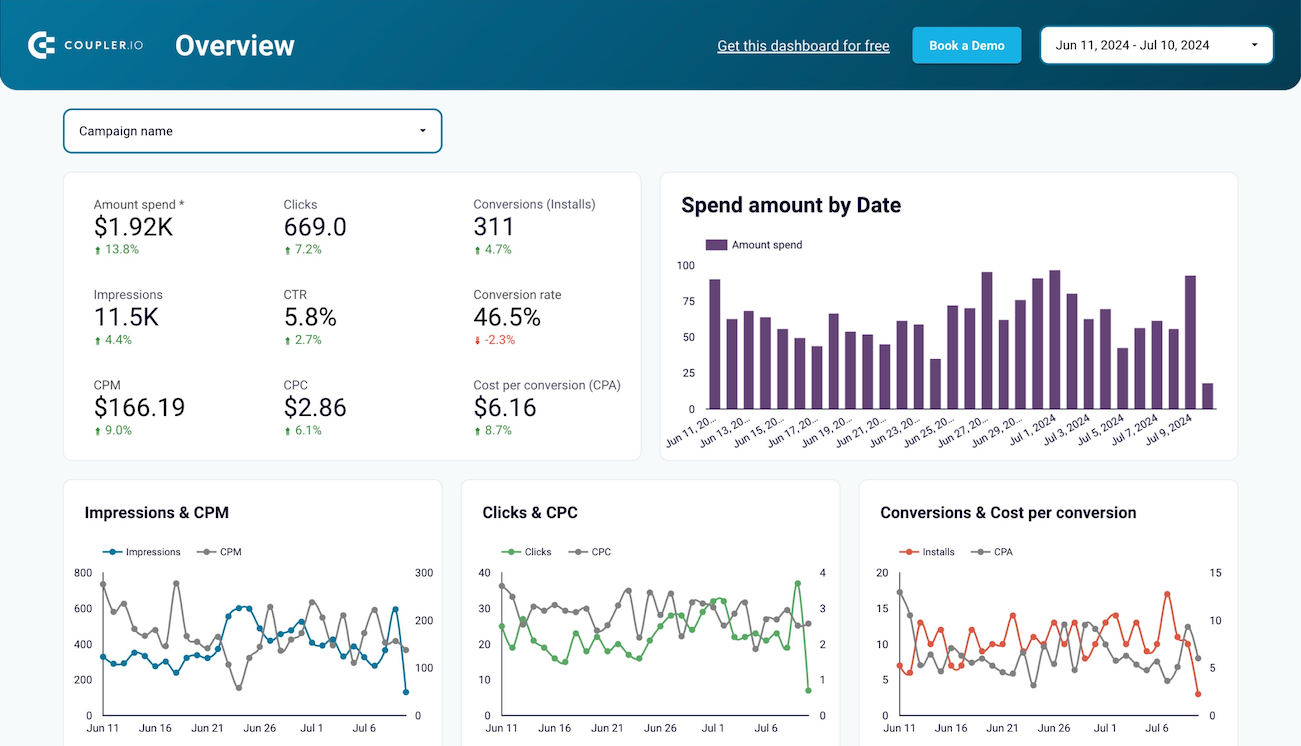
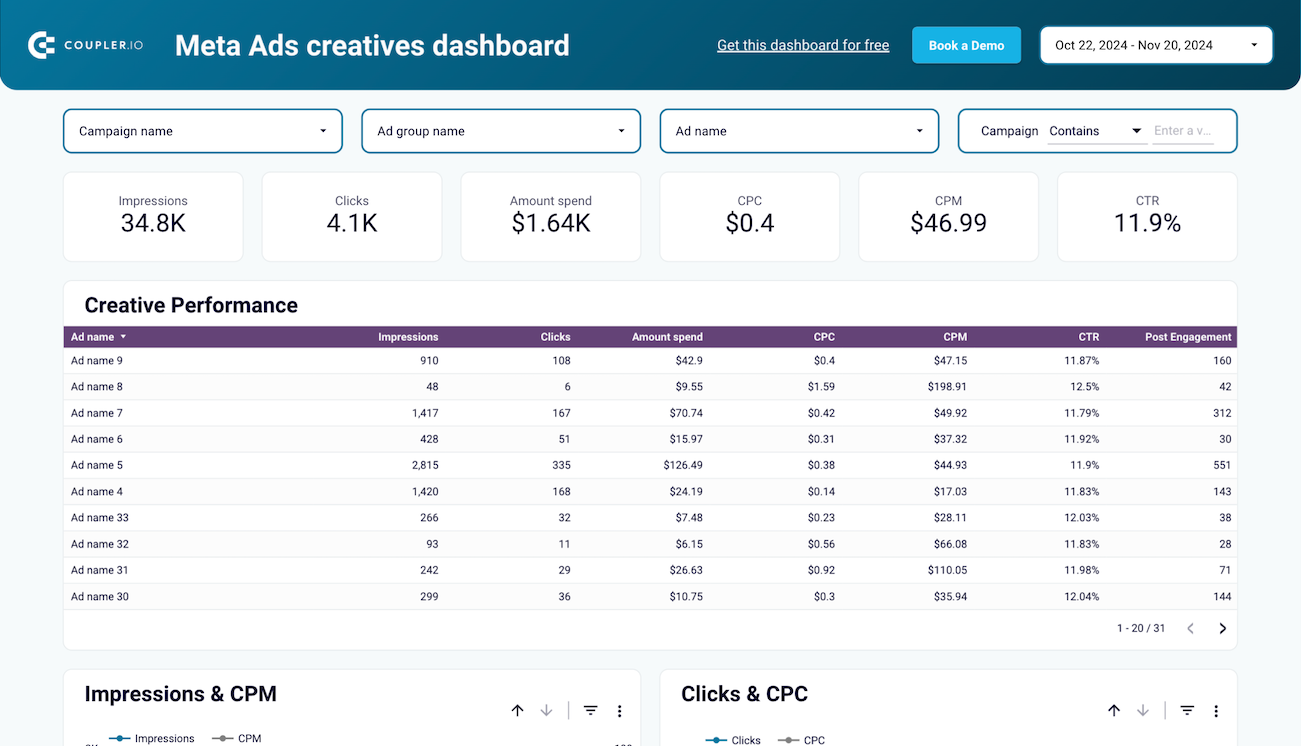
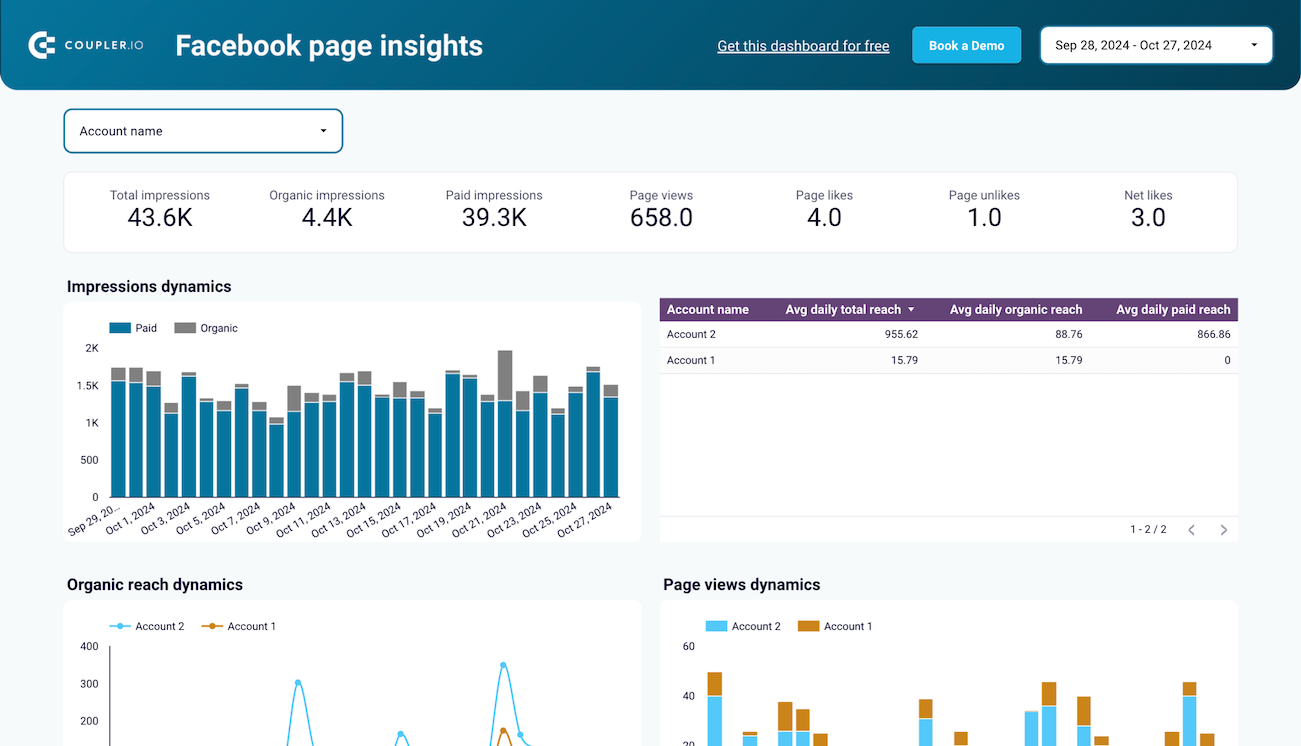
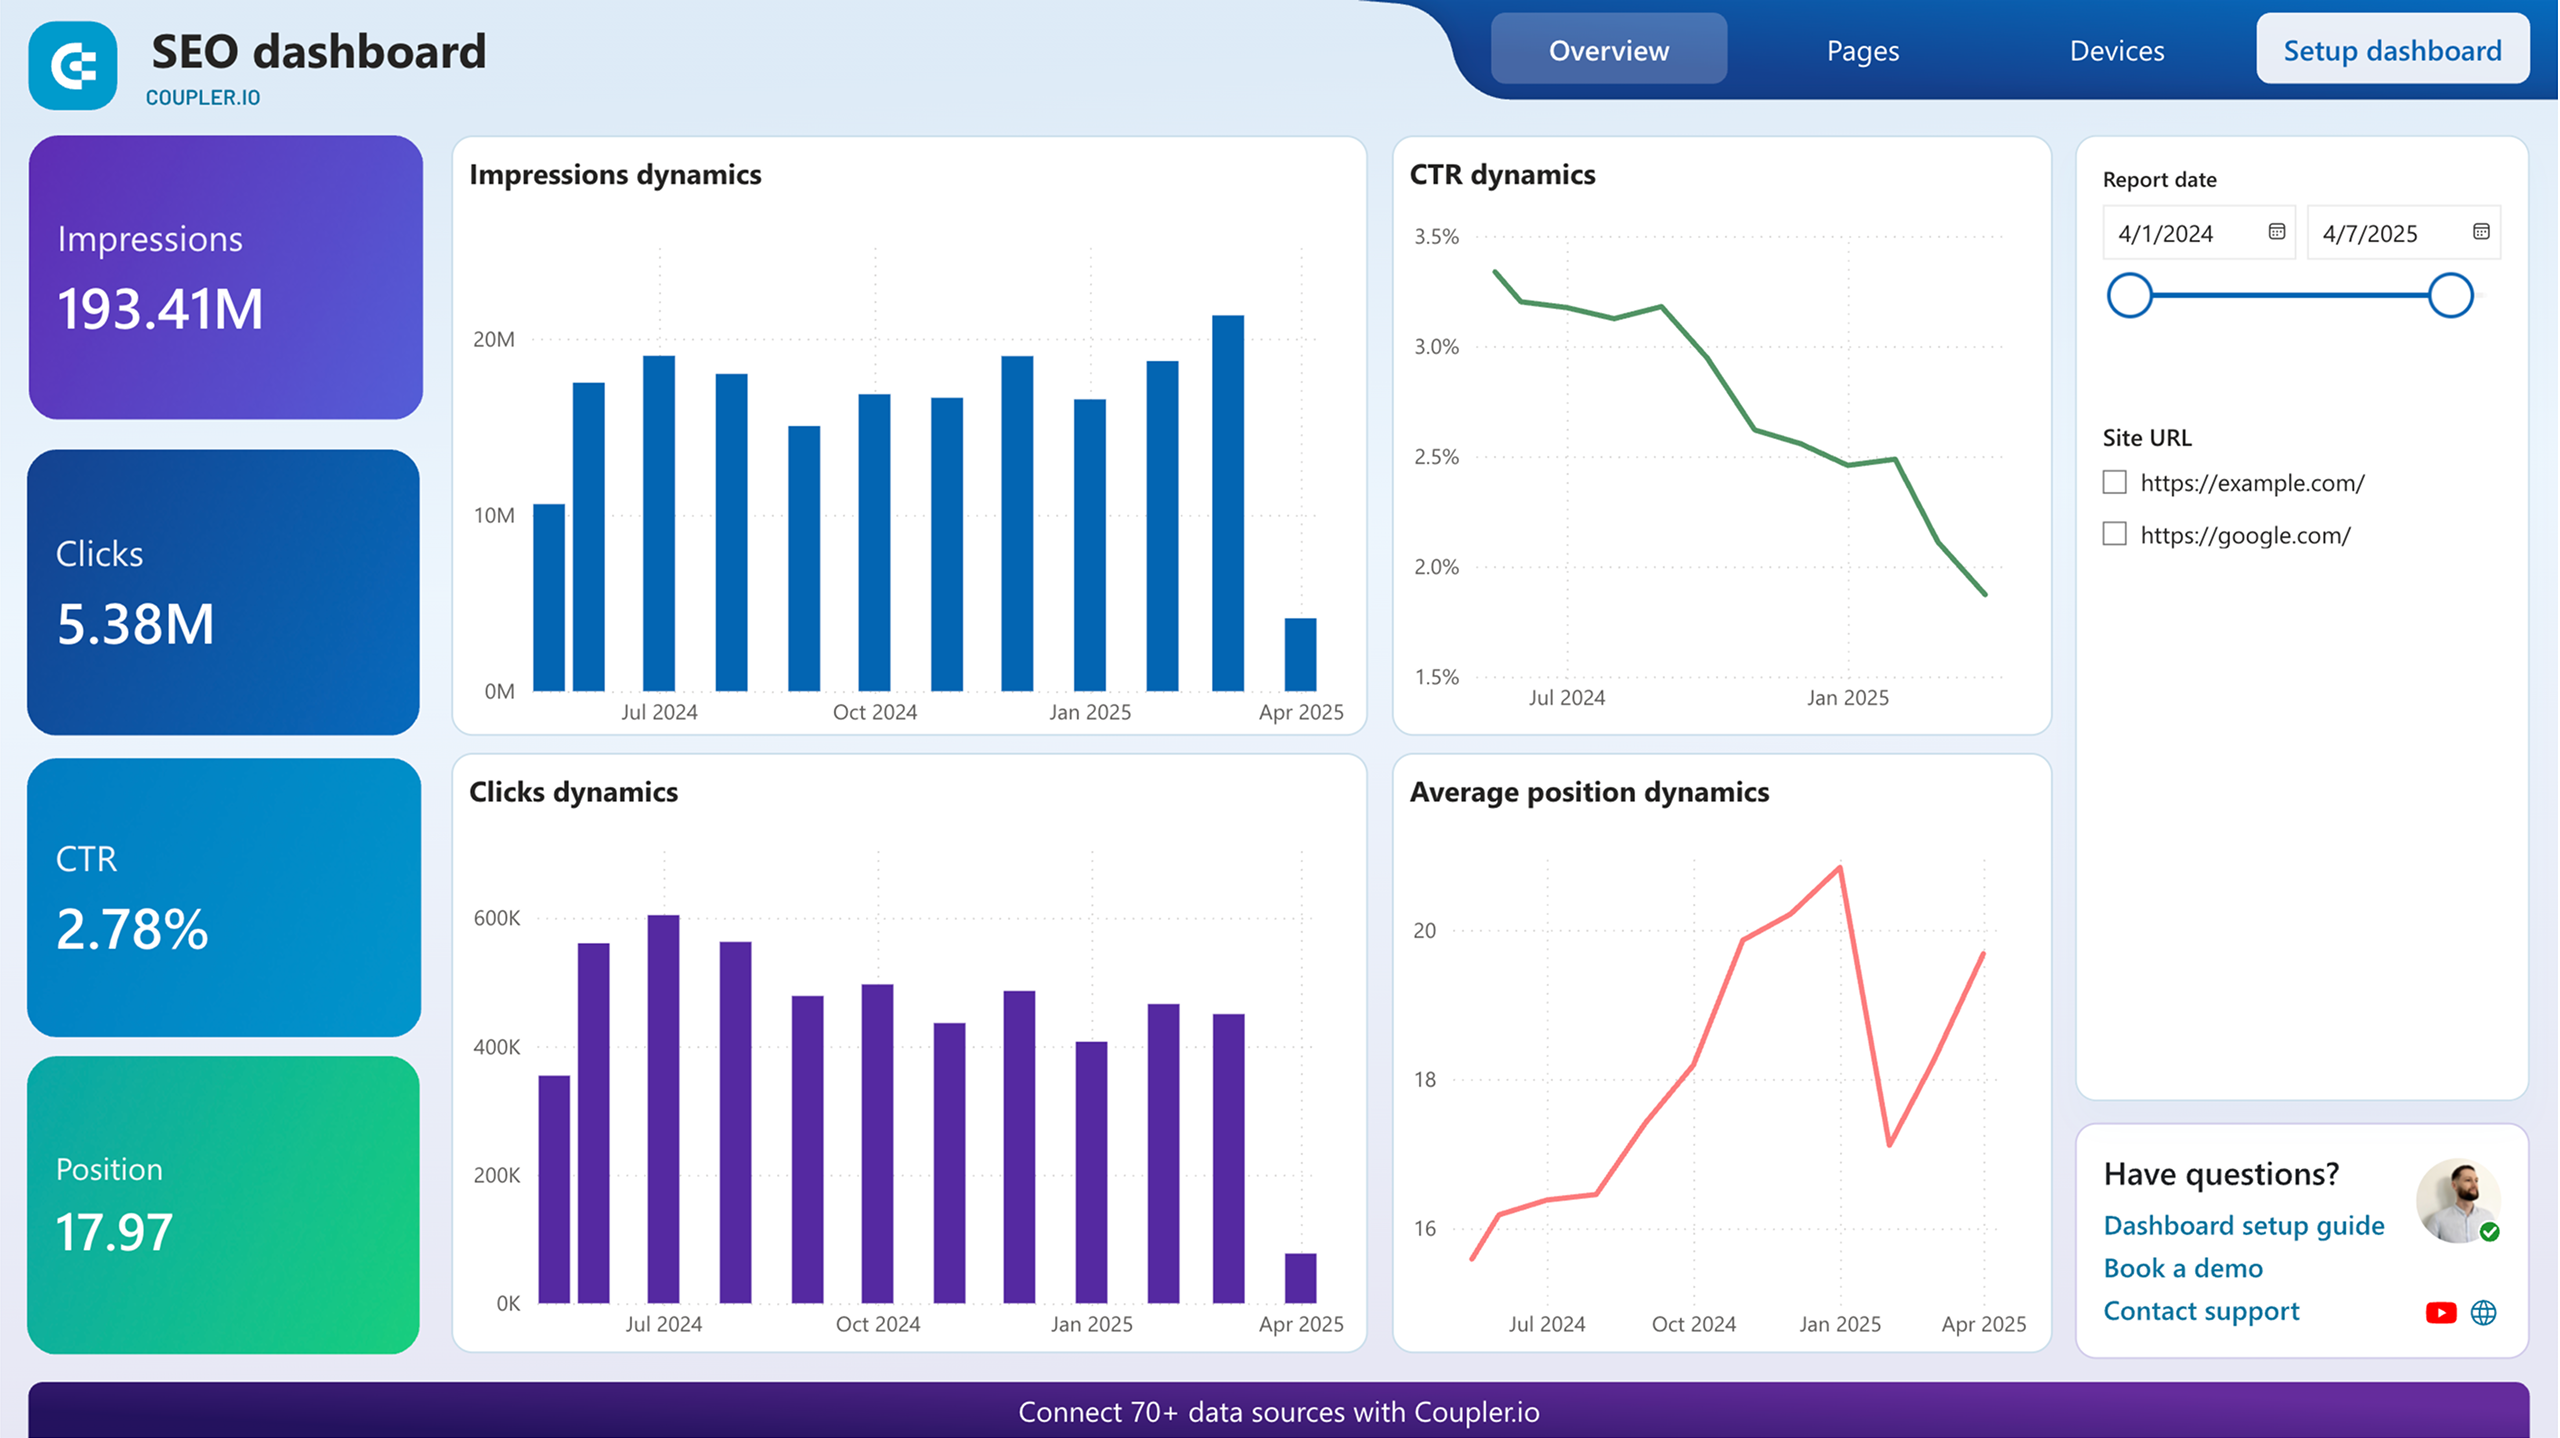
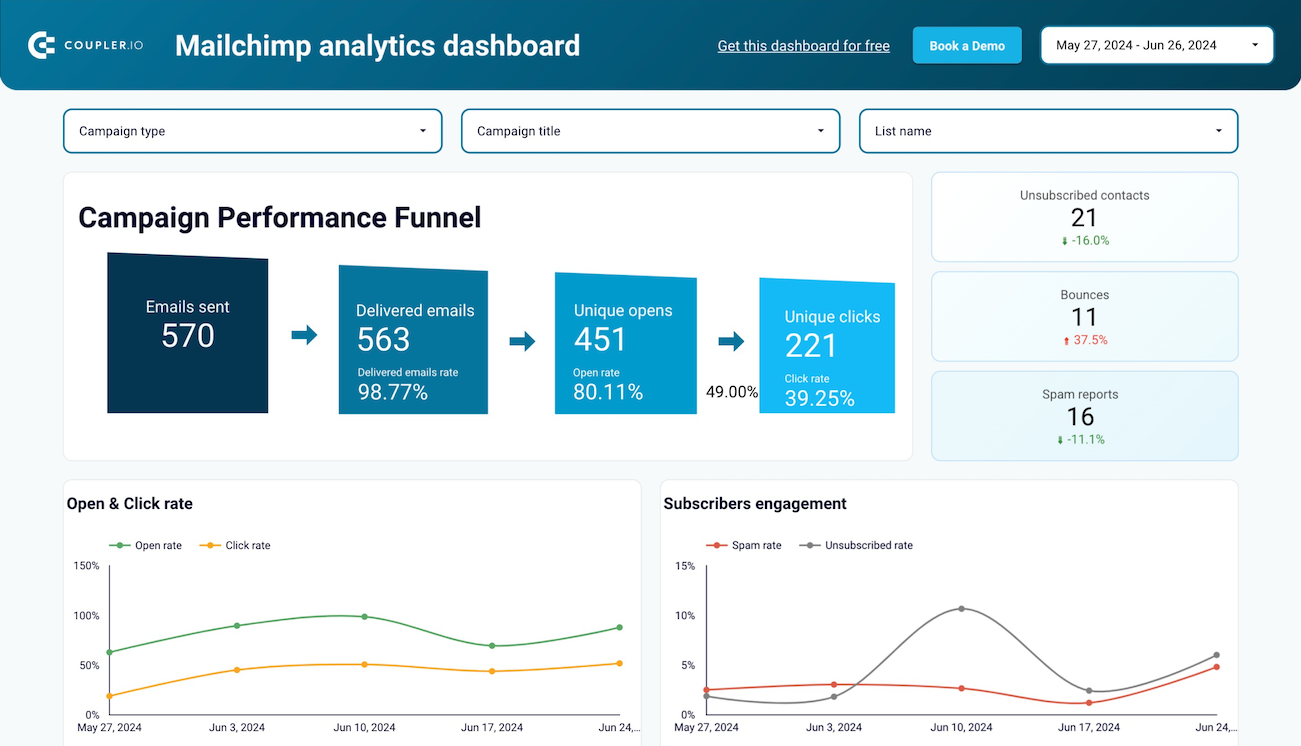
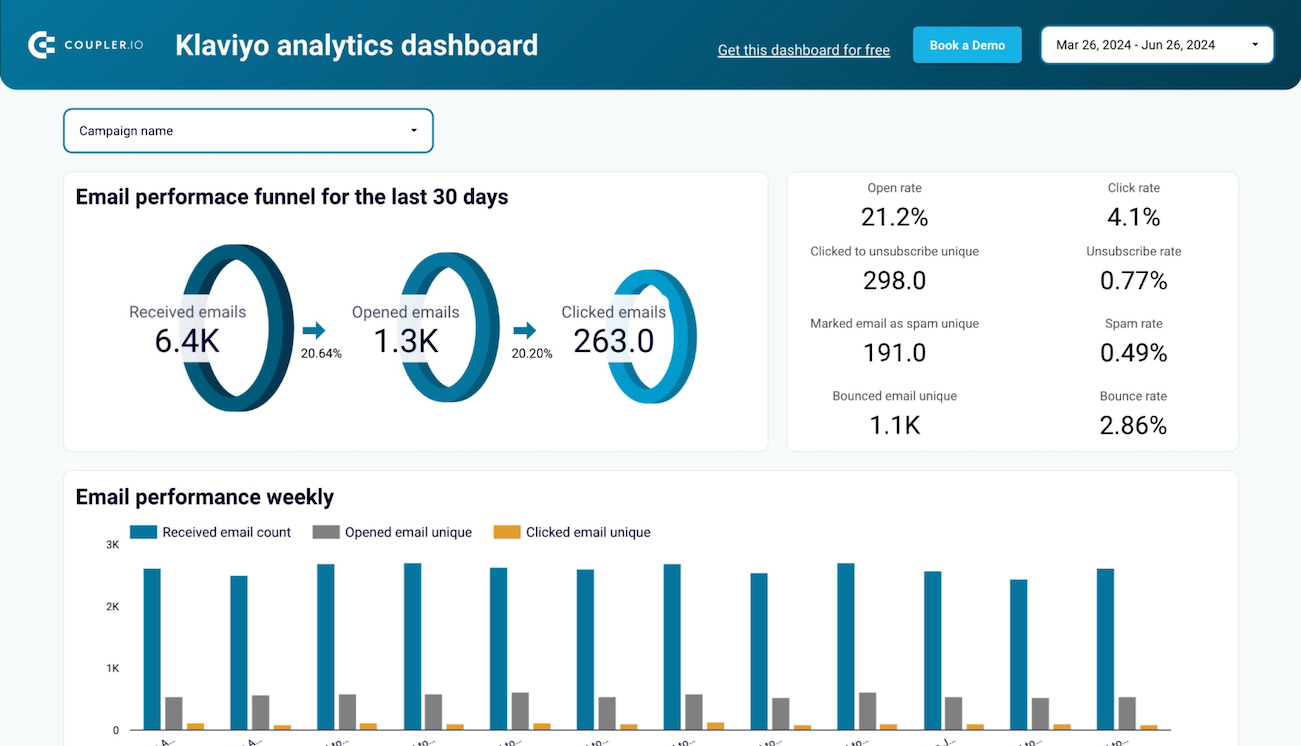
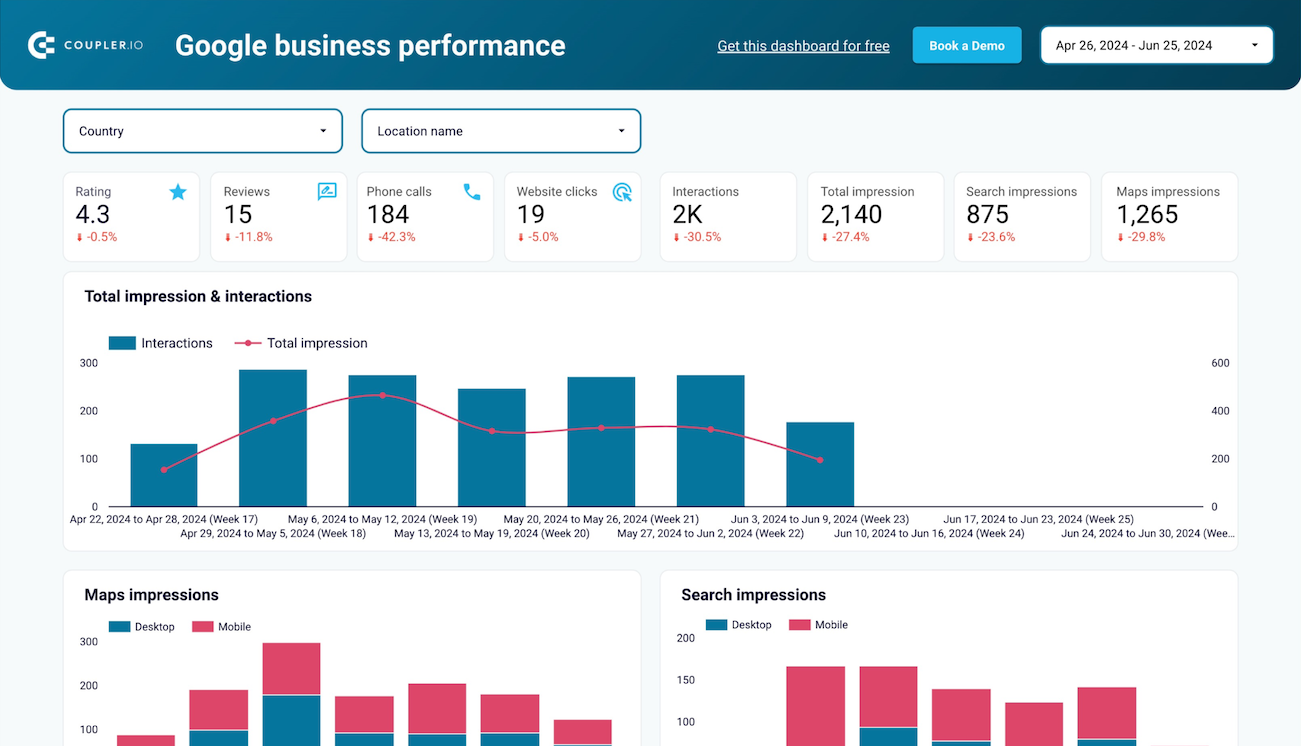
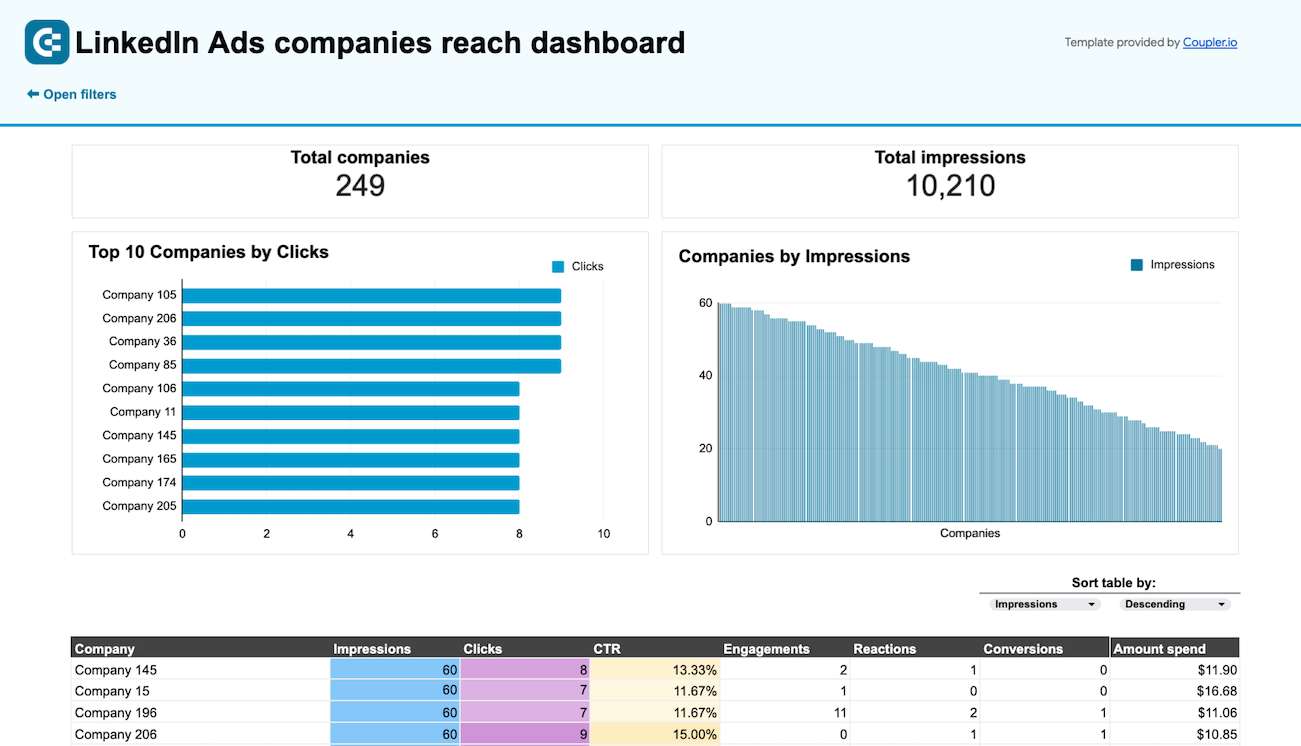
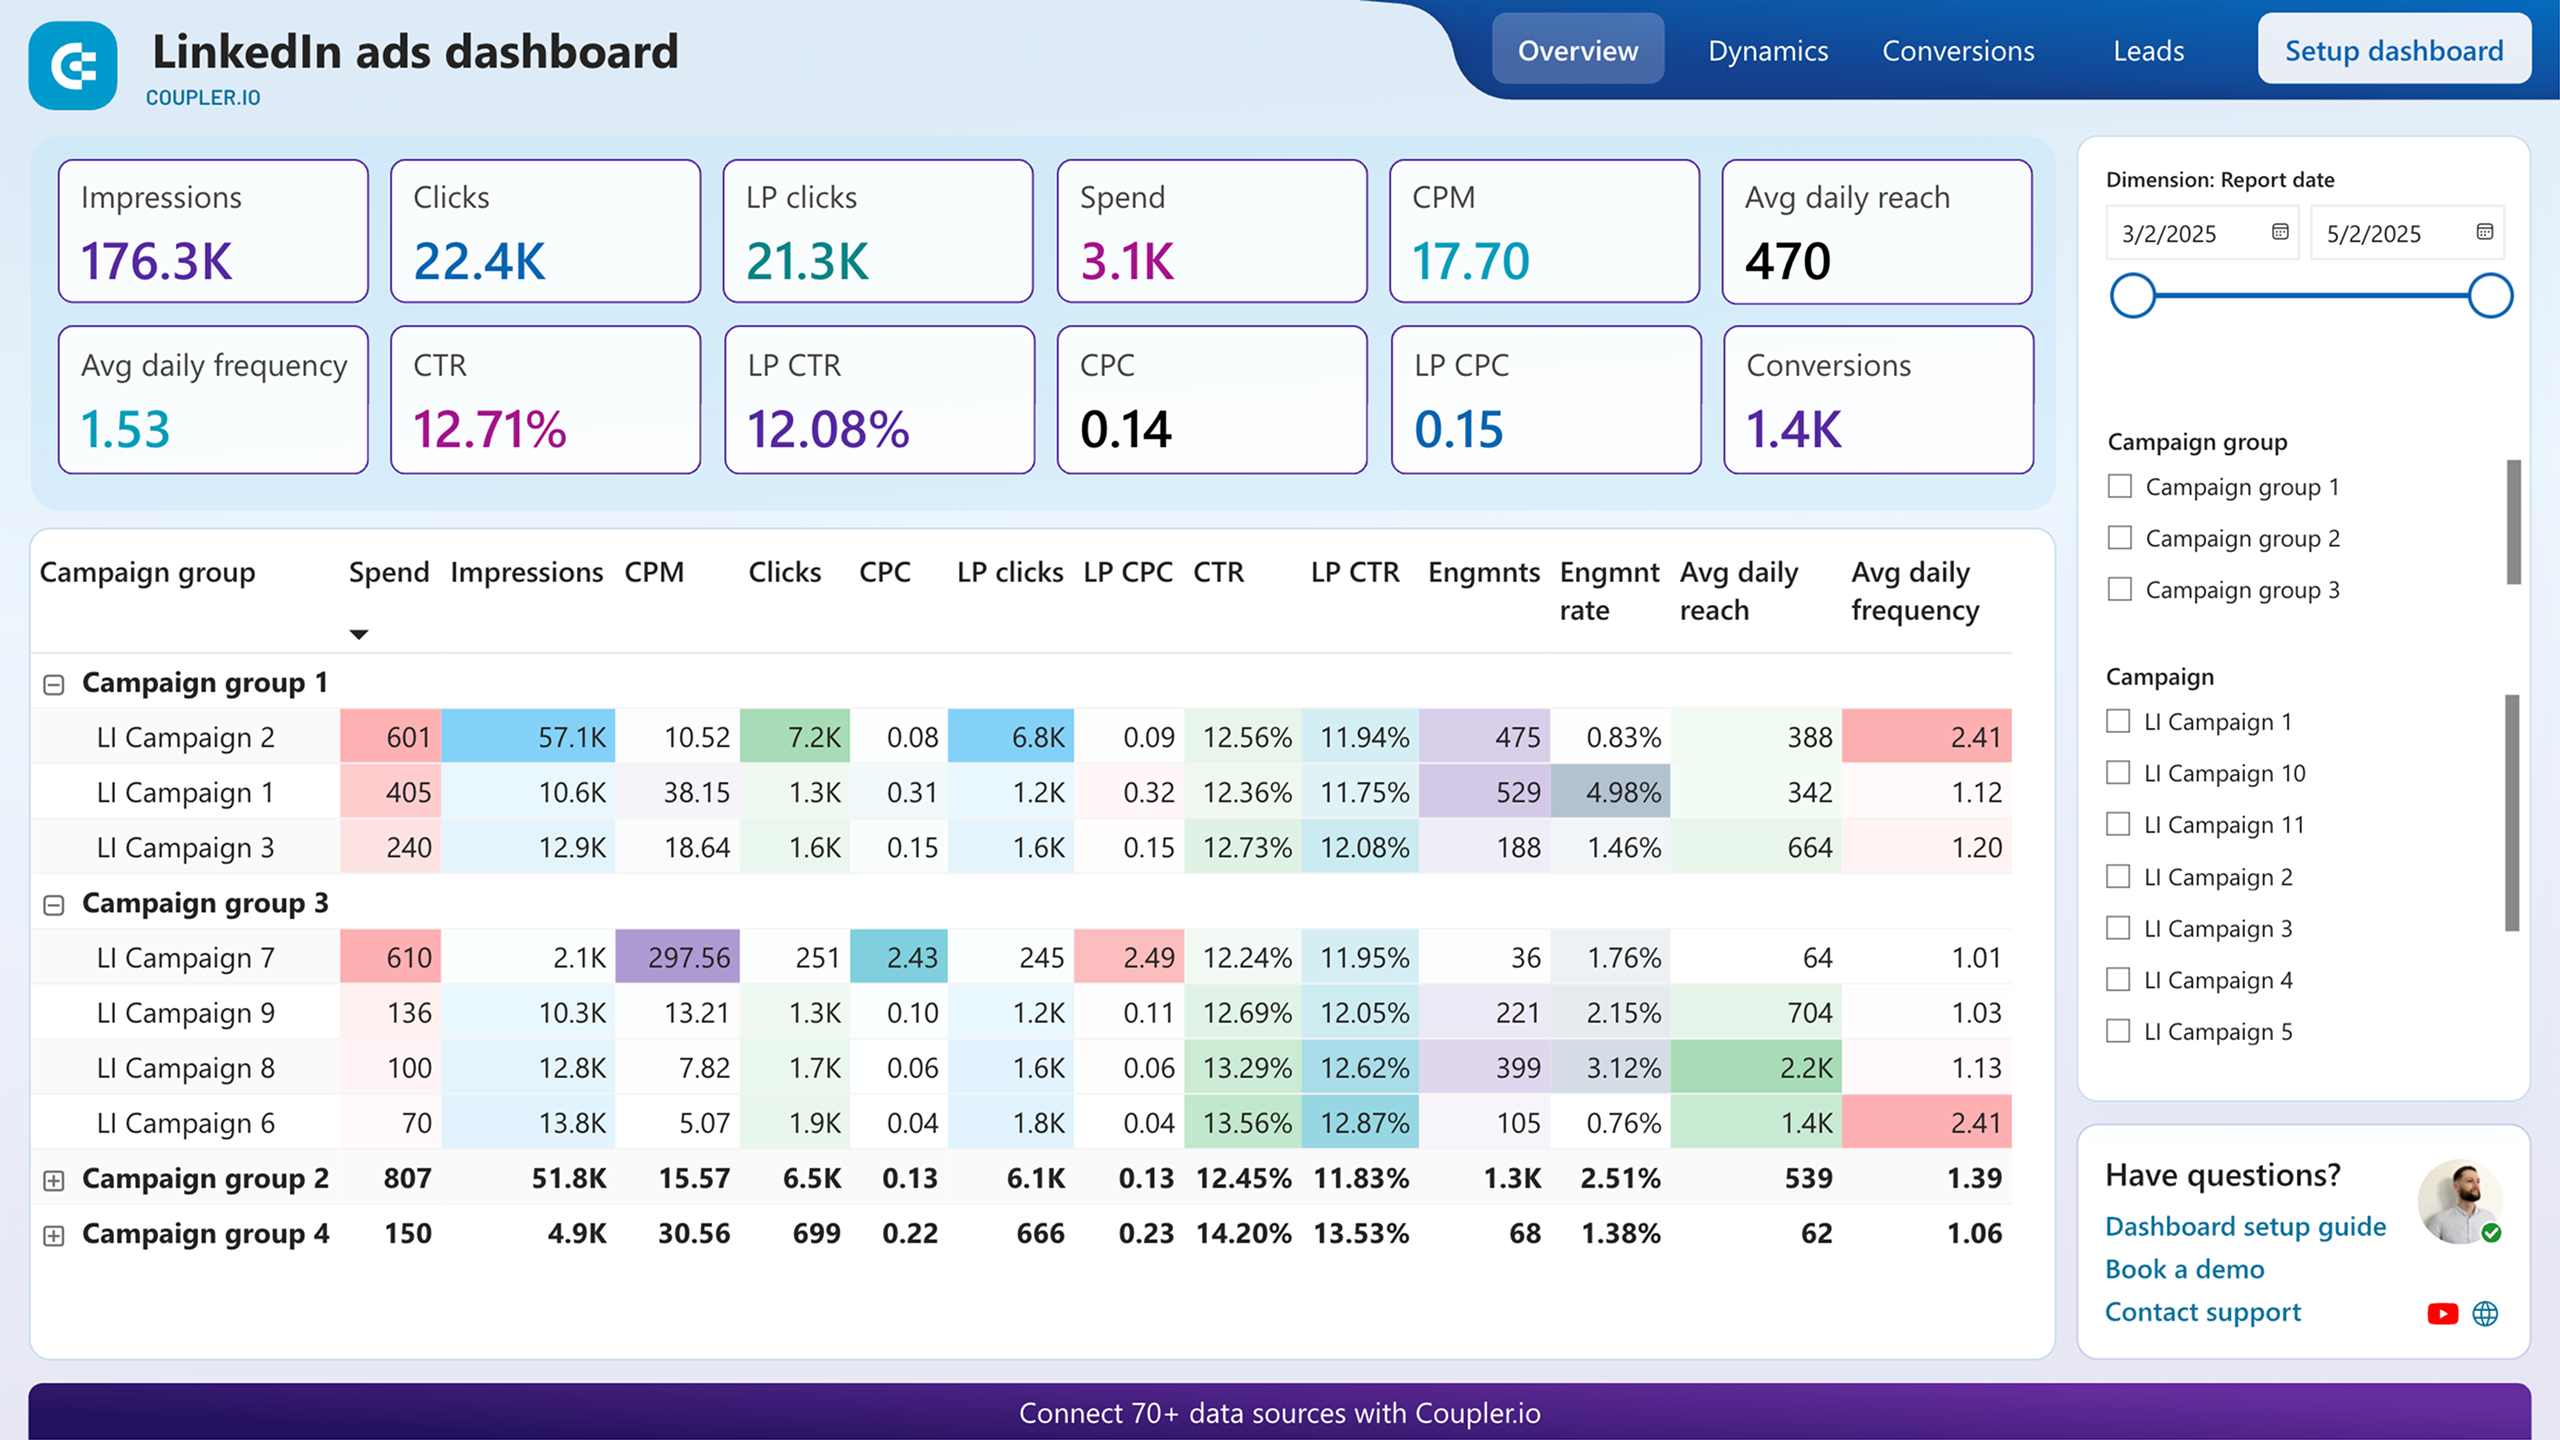
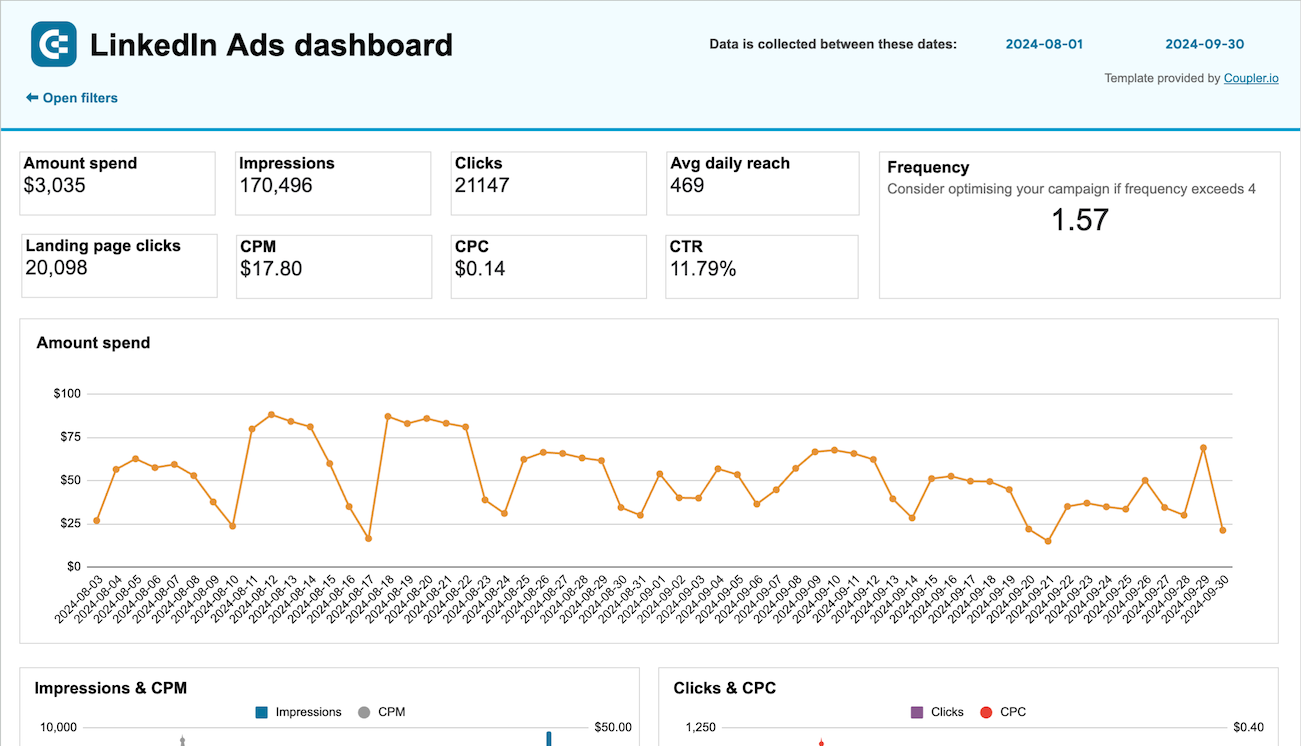
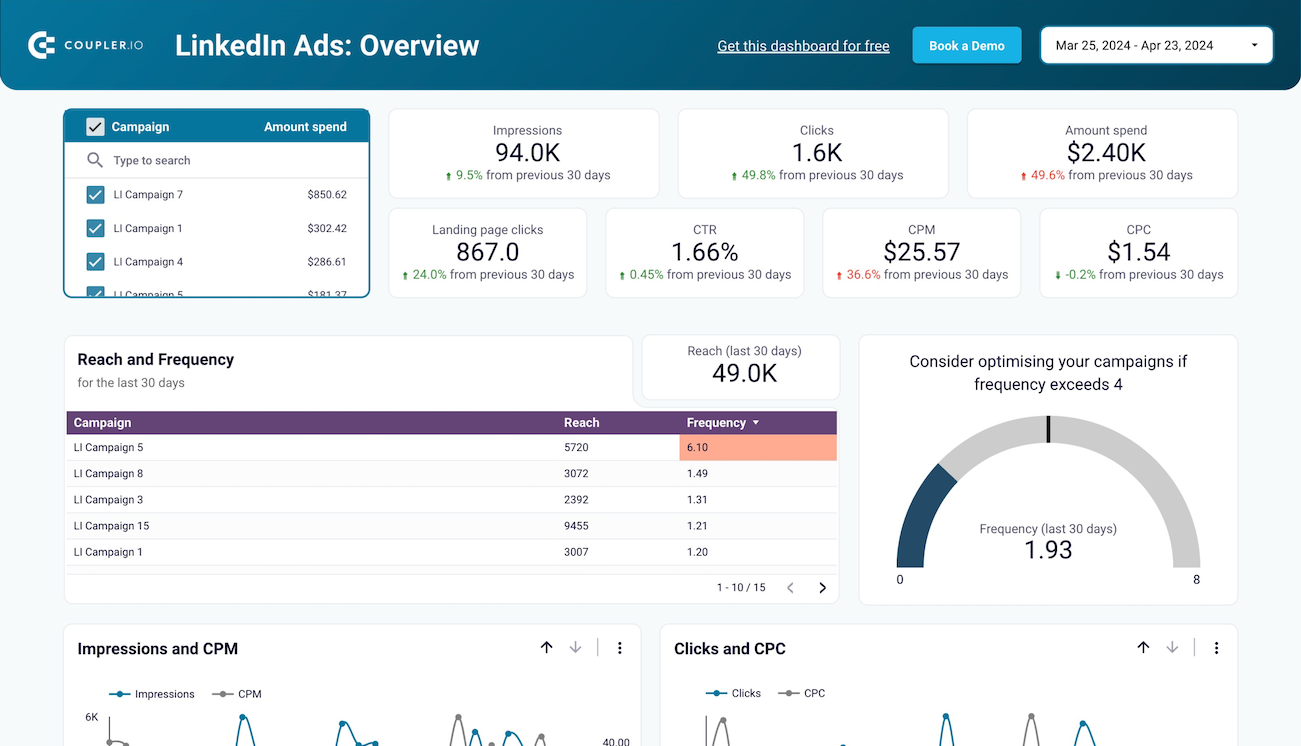
Marketing dashboards
Track the performance of your marketing efforts, including SEO, paid advertising, email campaigns, and more. Connect your data to the chosen dashboard and derive insights from Google Analytics, Google Ads, Facebook Ads, Google Search Console, YouTube, Mailchimp, Klaviyo and other sources. Our marketing dashboard examples allow you to monitor conversions, assess ROI, track ad performance, and make data-driven decisions effortlessly.
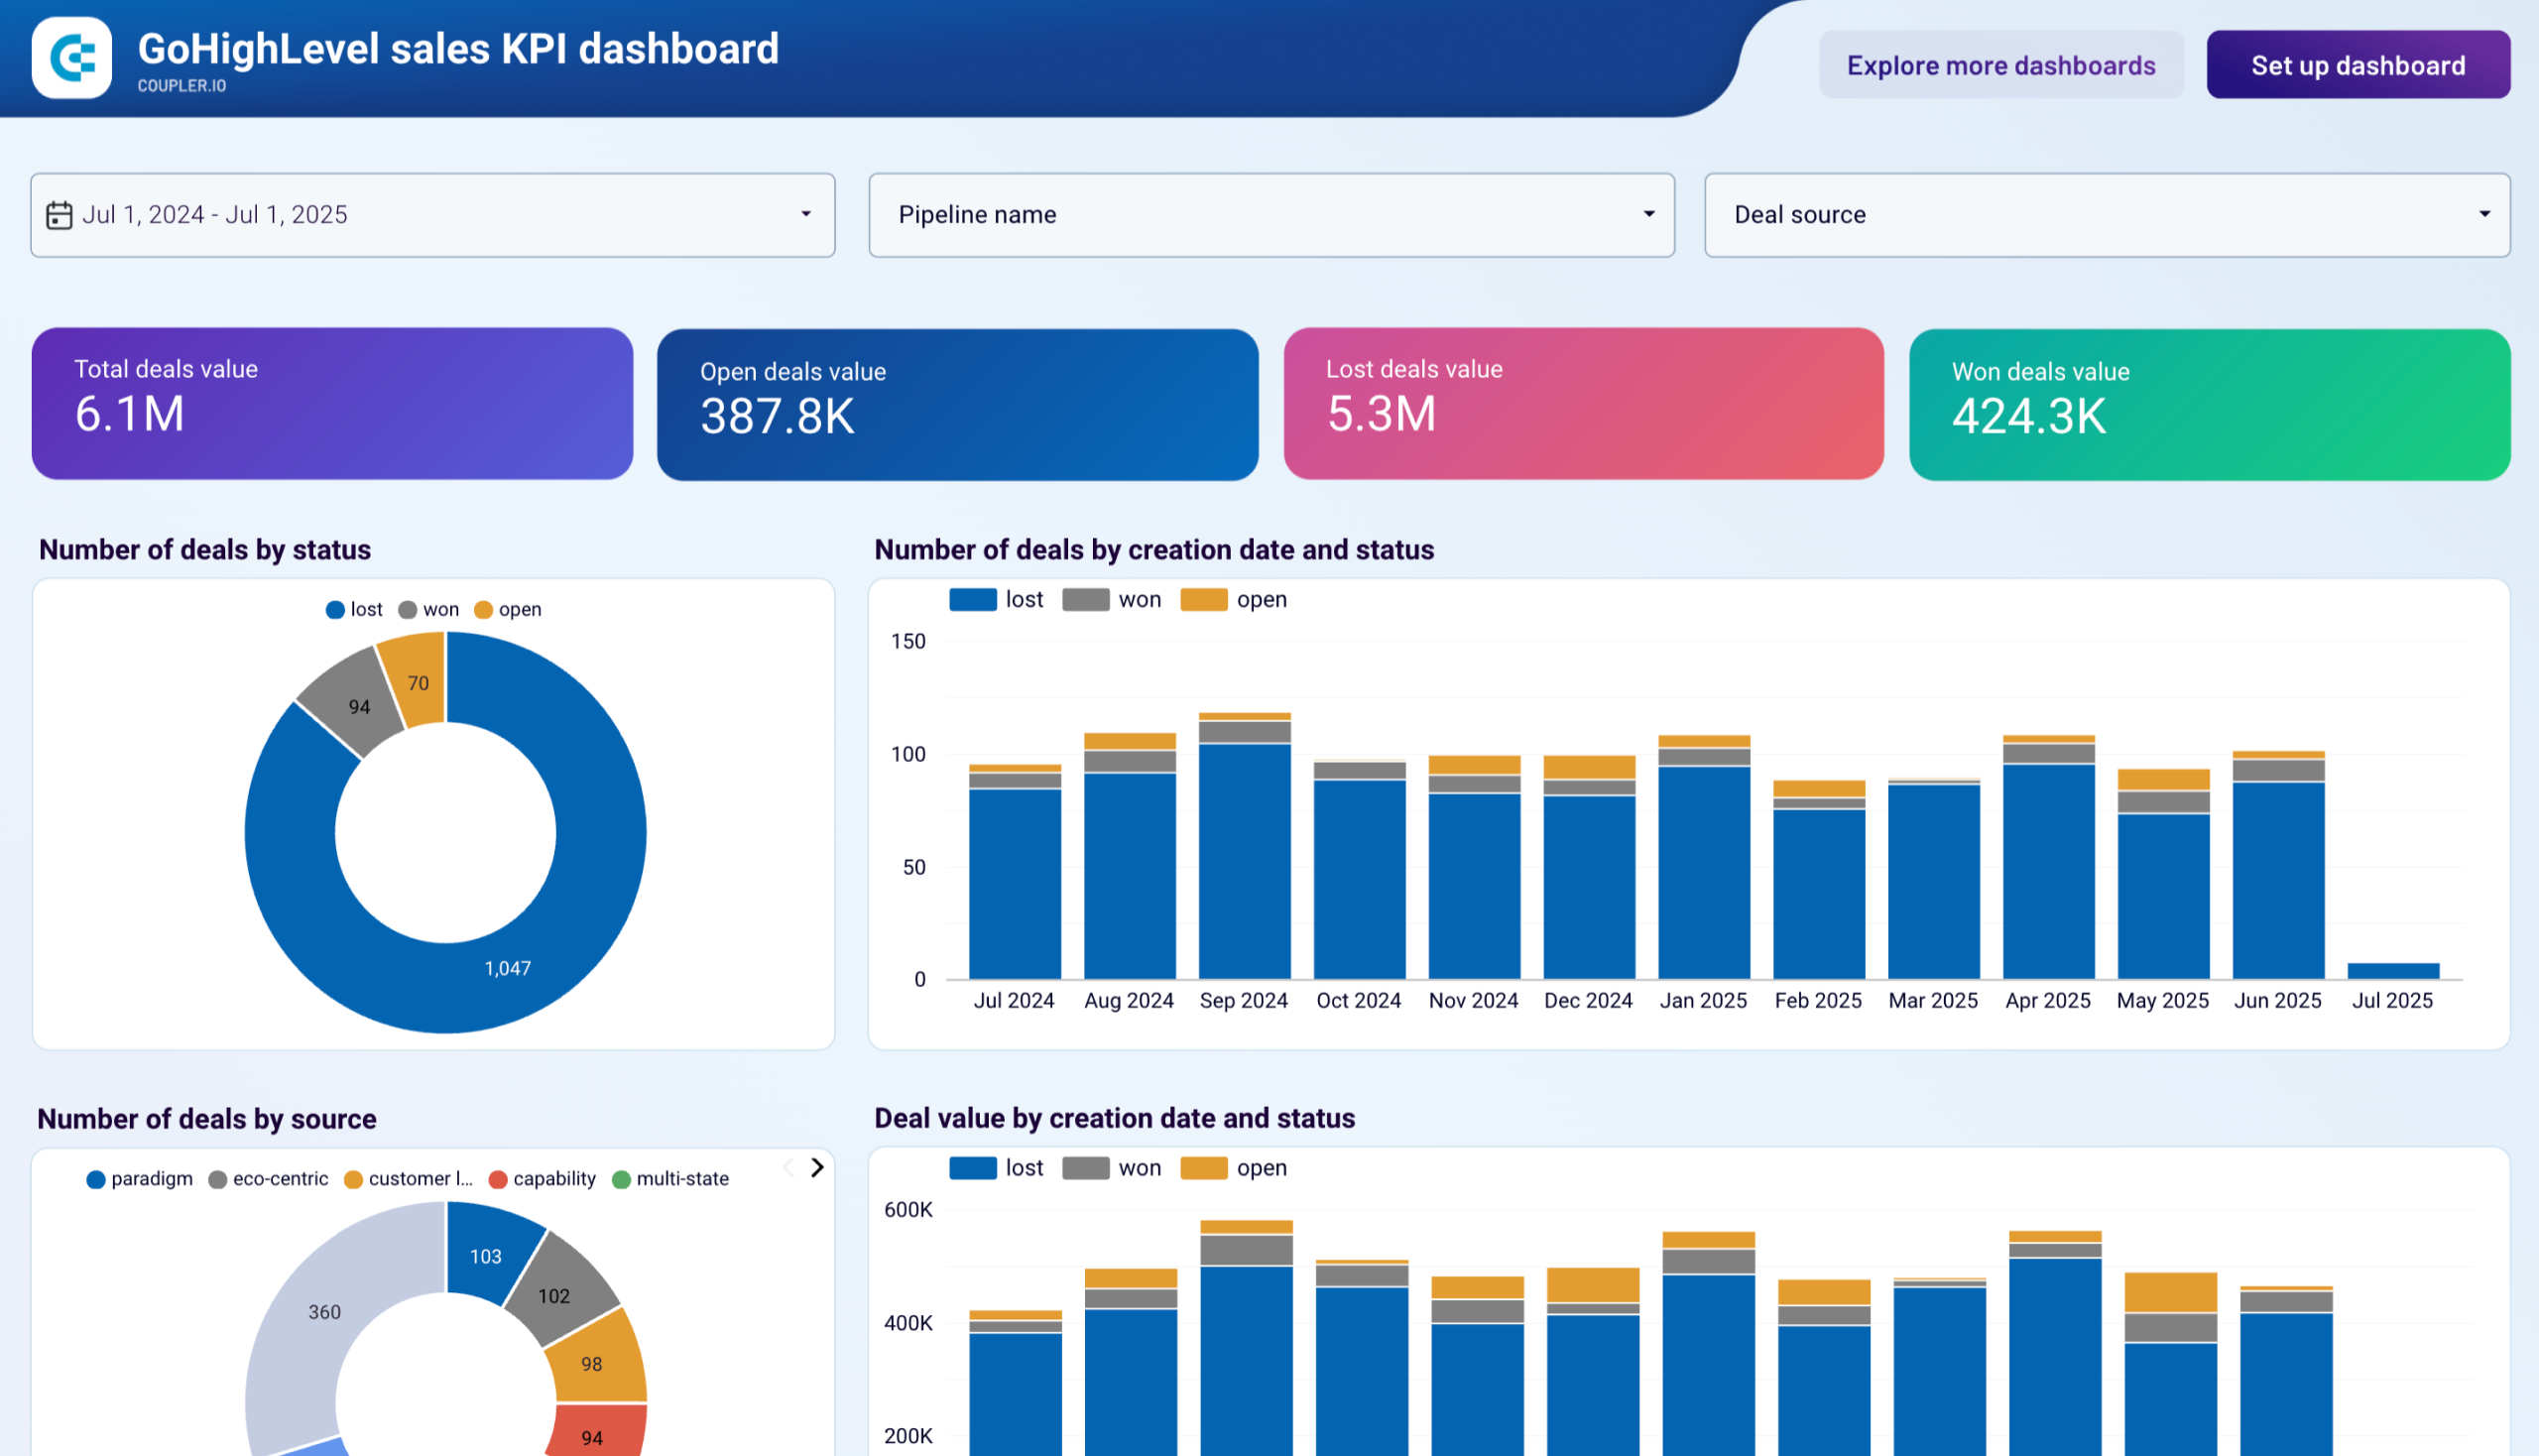
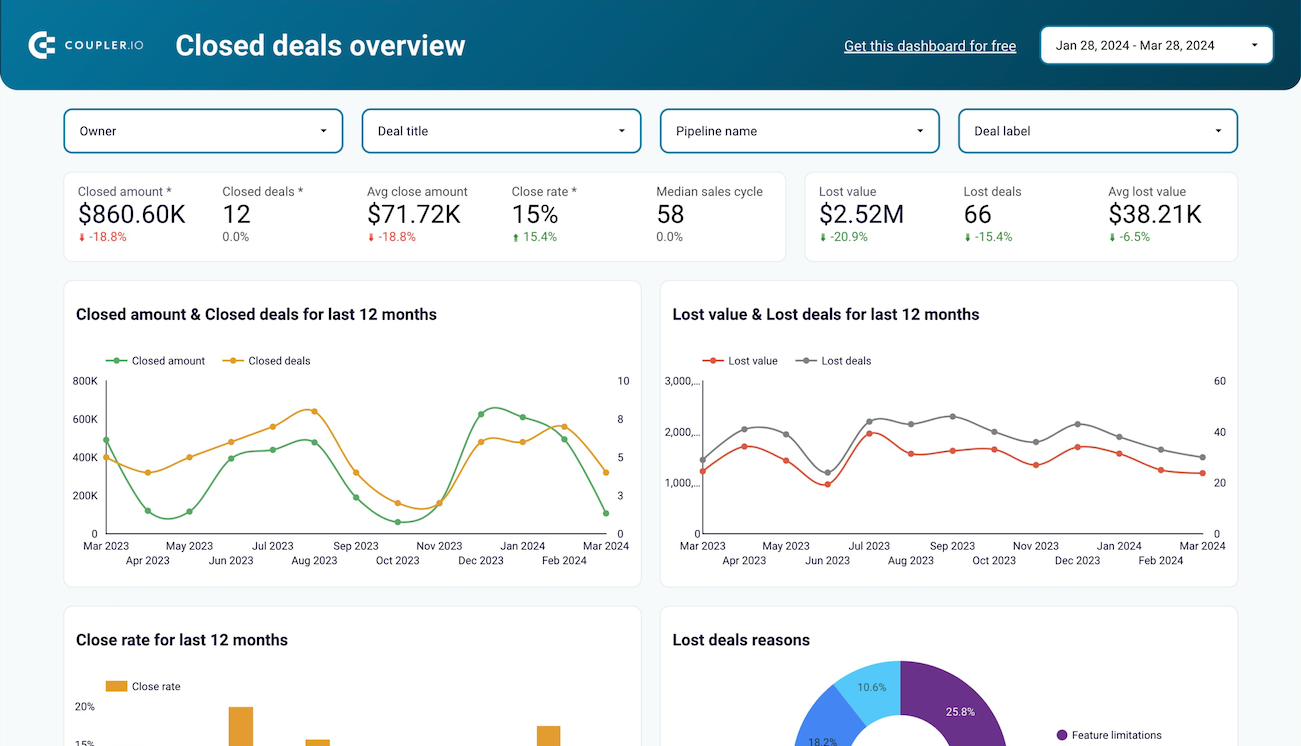
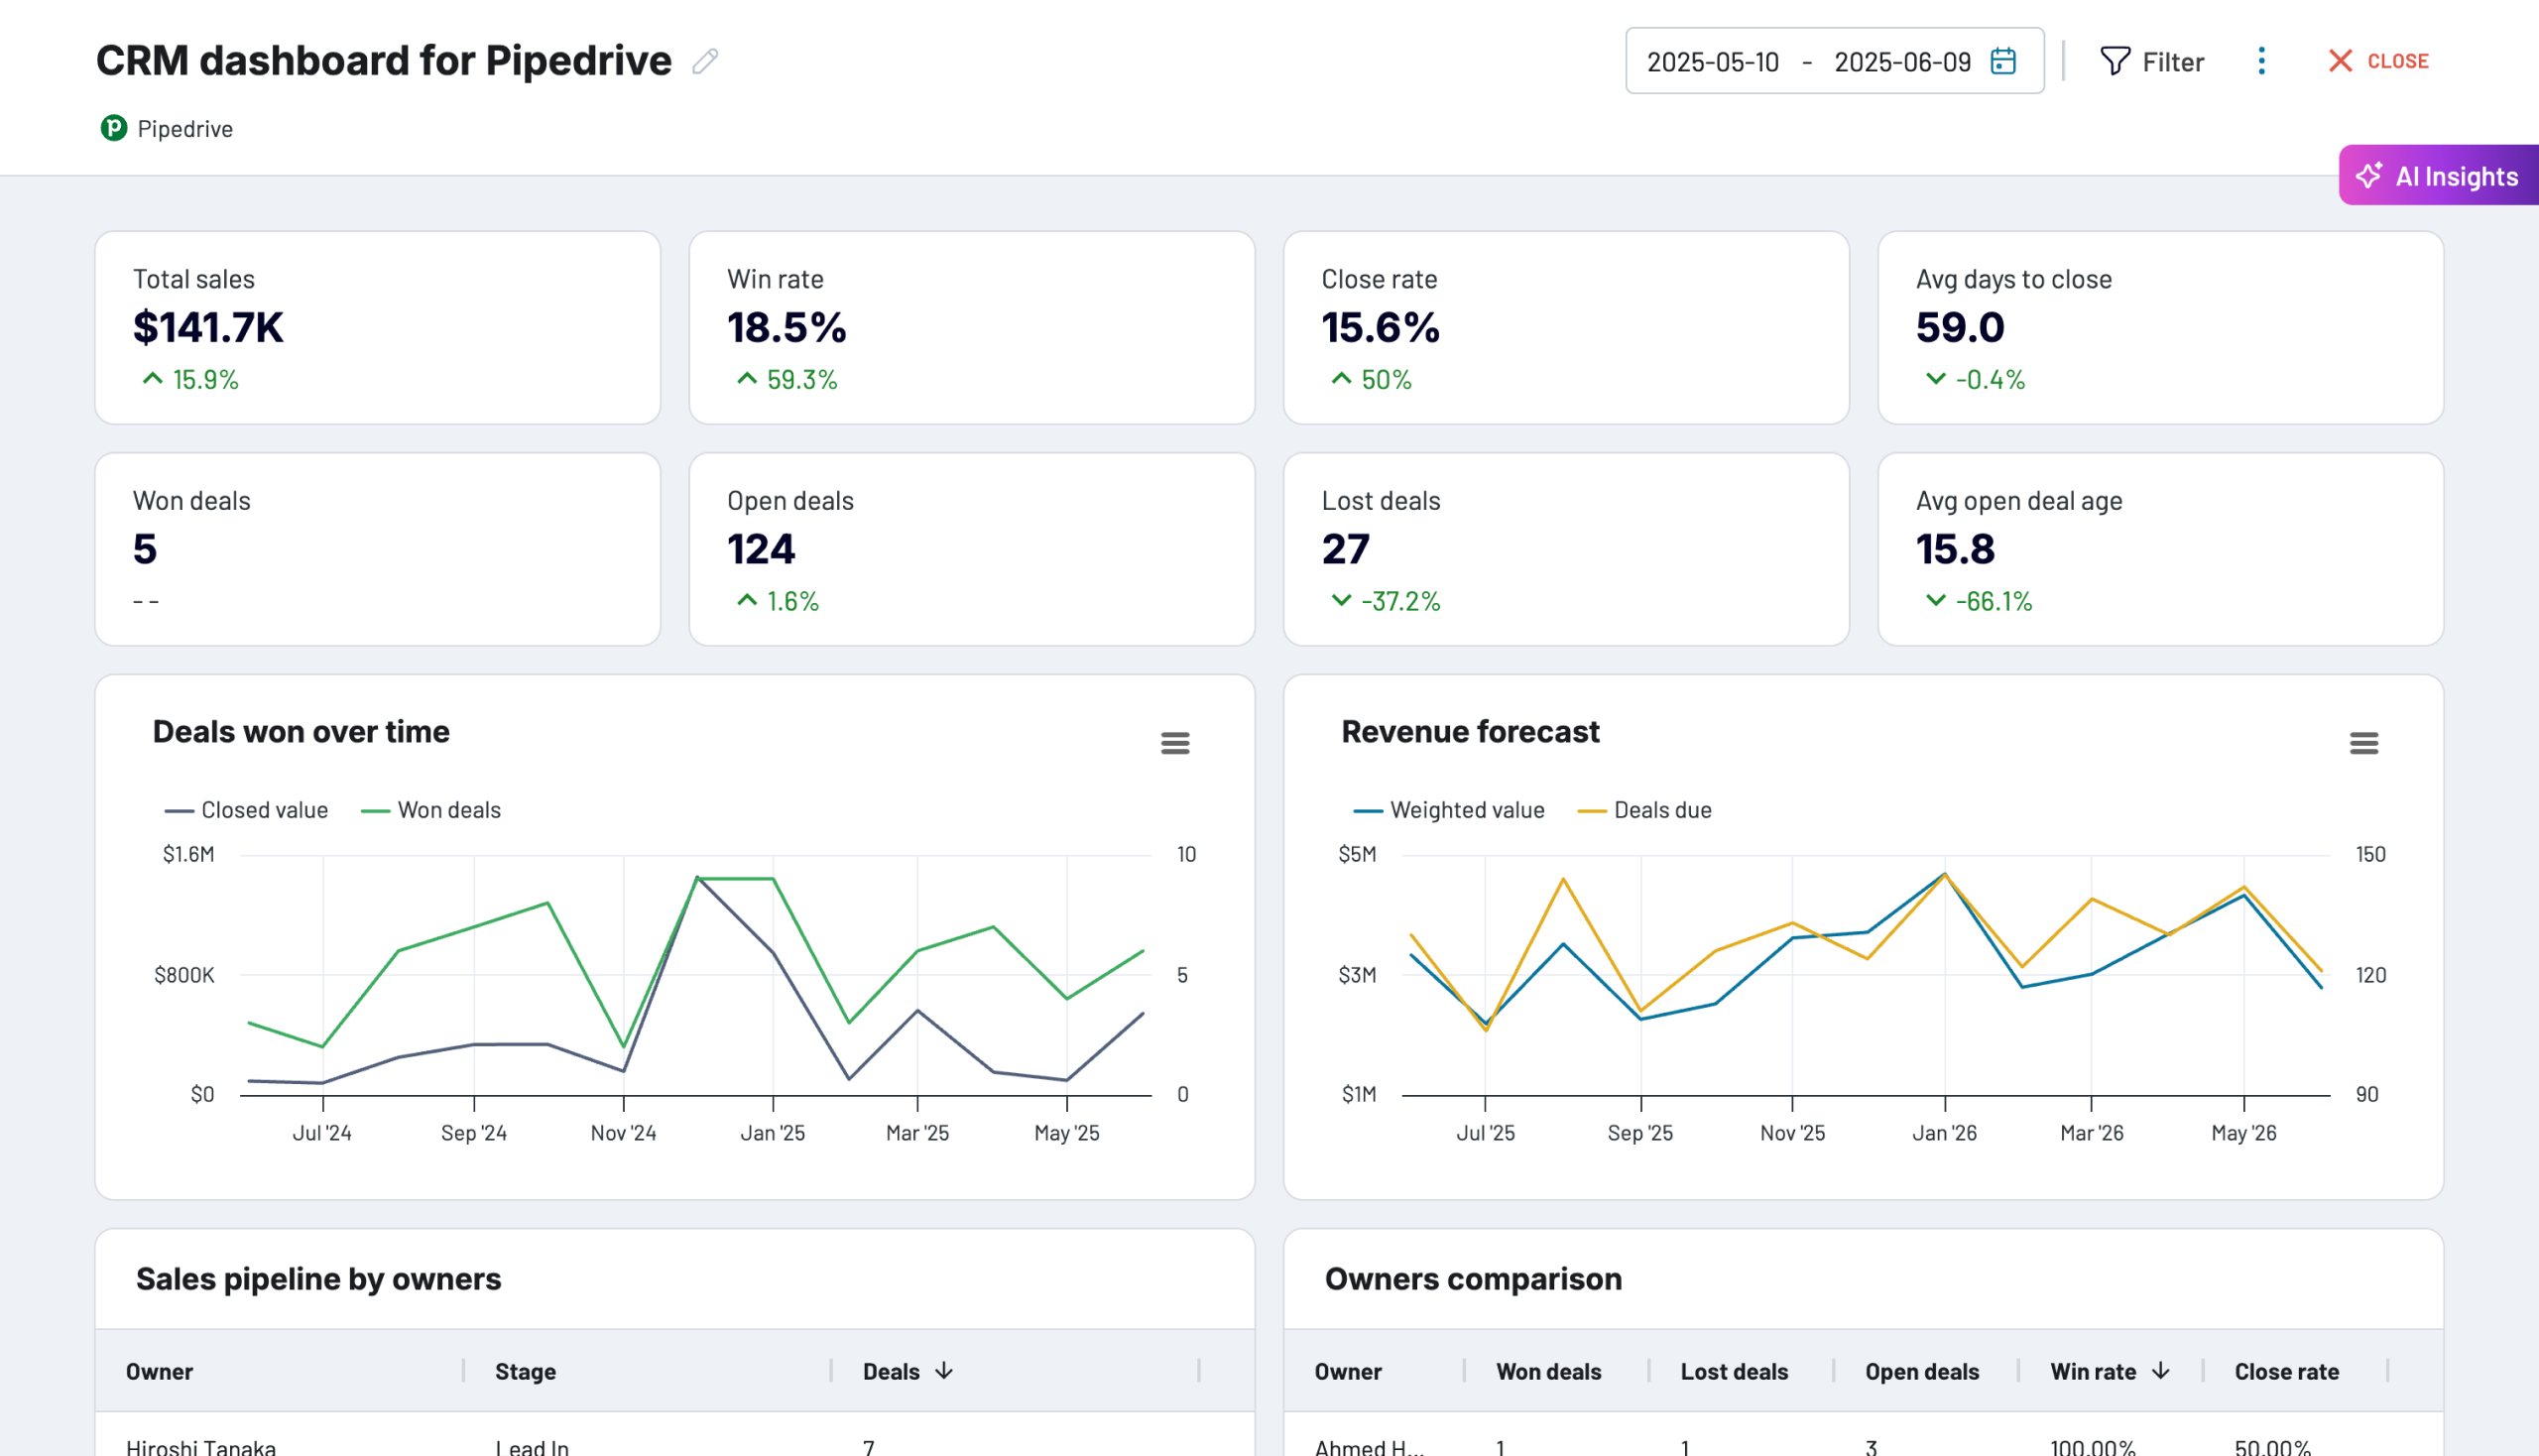
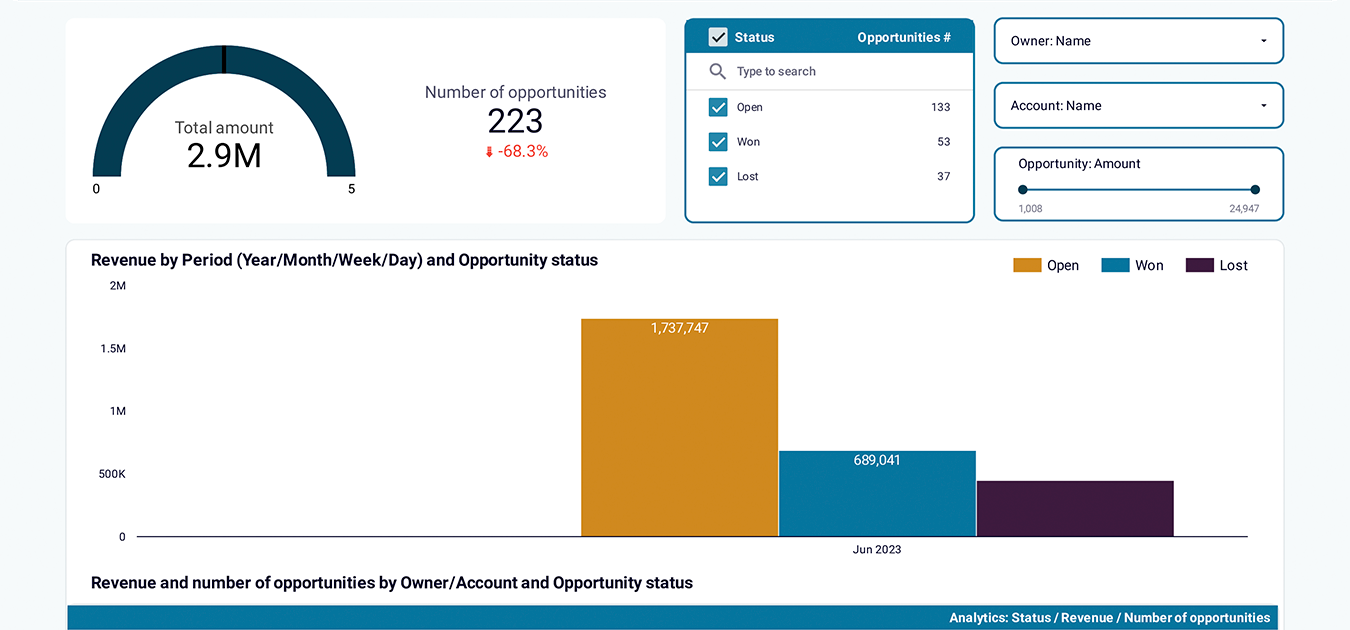
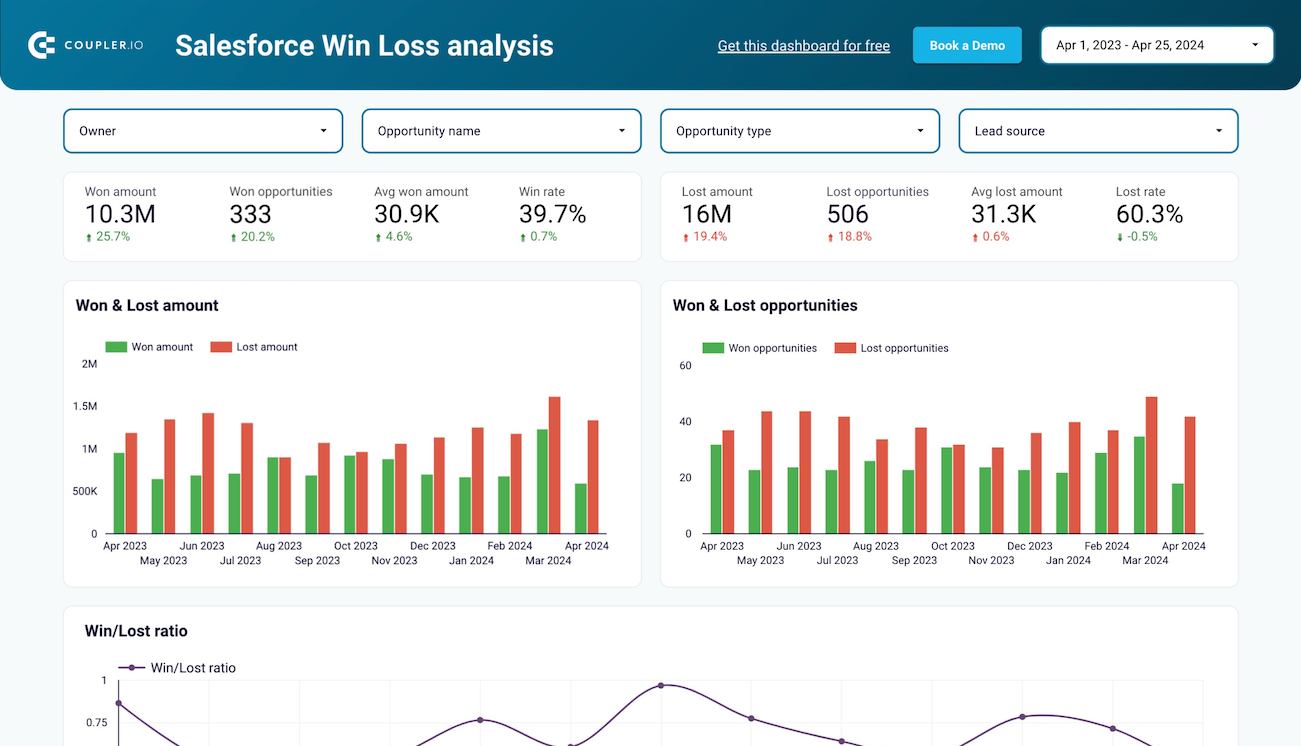
Sales dashboards
Keep a close eye on your sales performance and targets with CRM and sales dashboard templates. They integrate data from platforms like Salesforce, HubSpot CRM, Pipedrive, and others to analyze revenue, sales funnels, and team productivity. With our sales dashboard examples, you can uncover bottlenecks in your sales pipeline, identify opportunities for growth, and manage your investments efficiently.
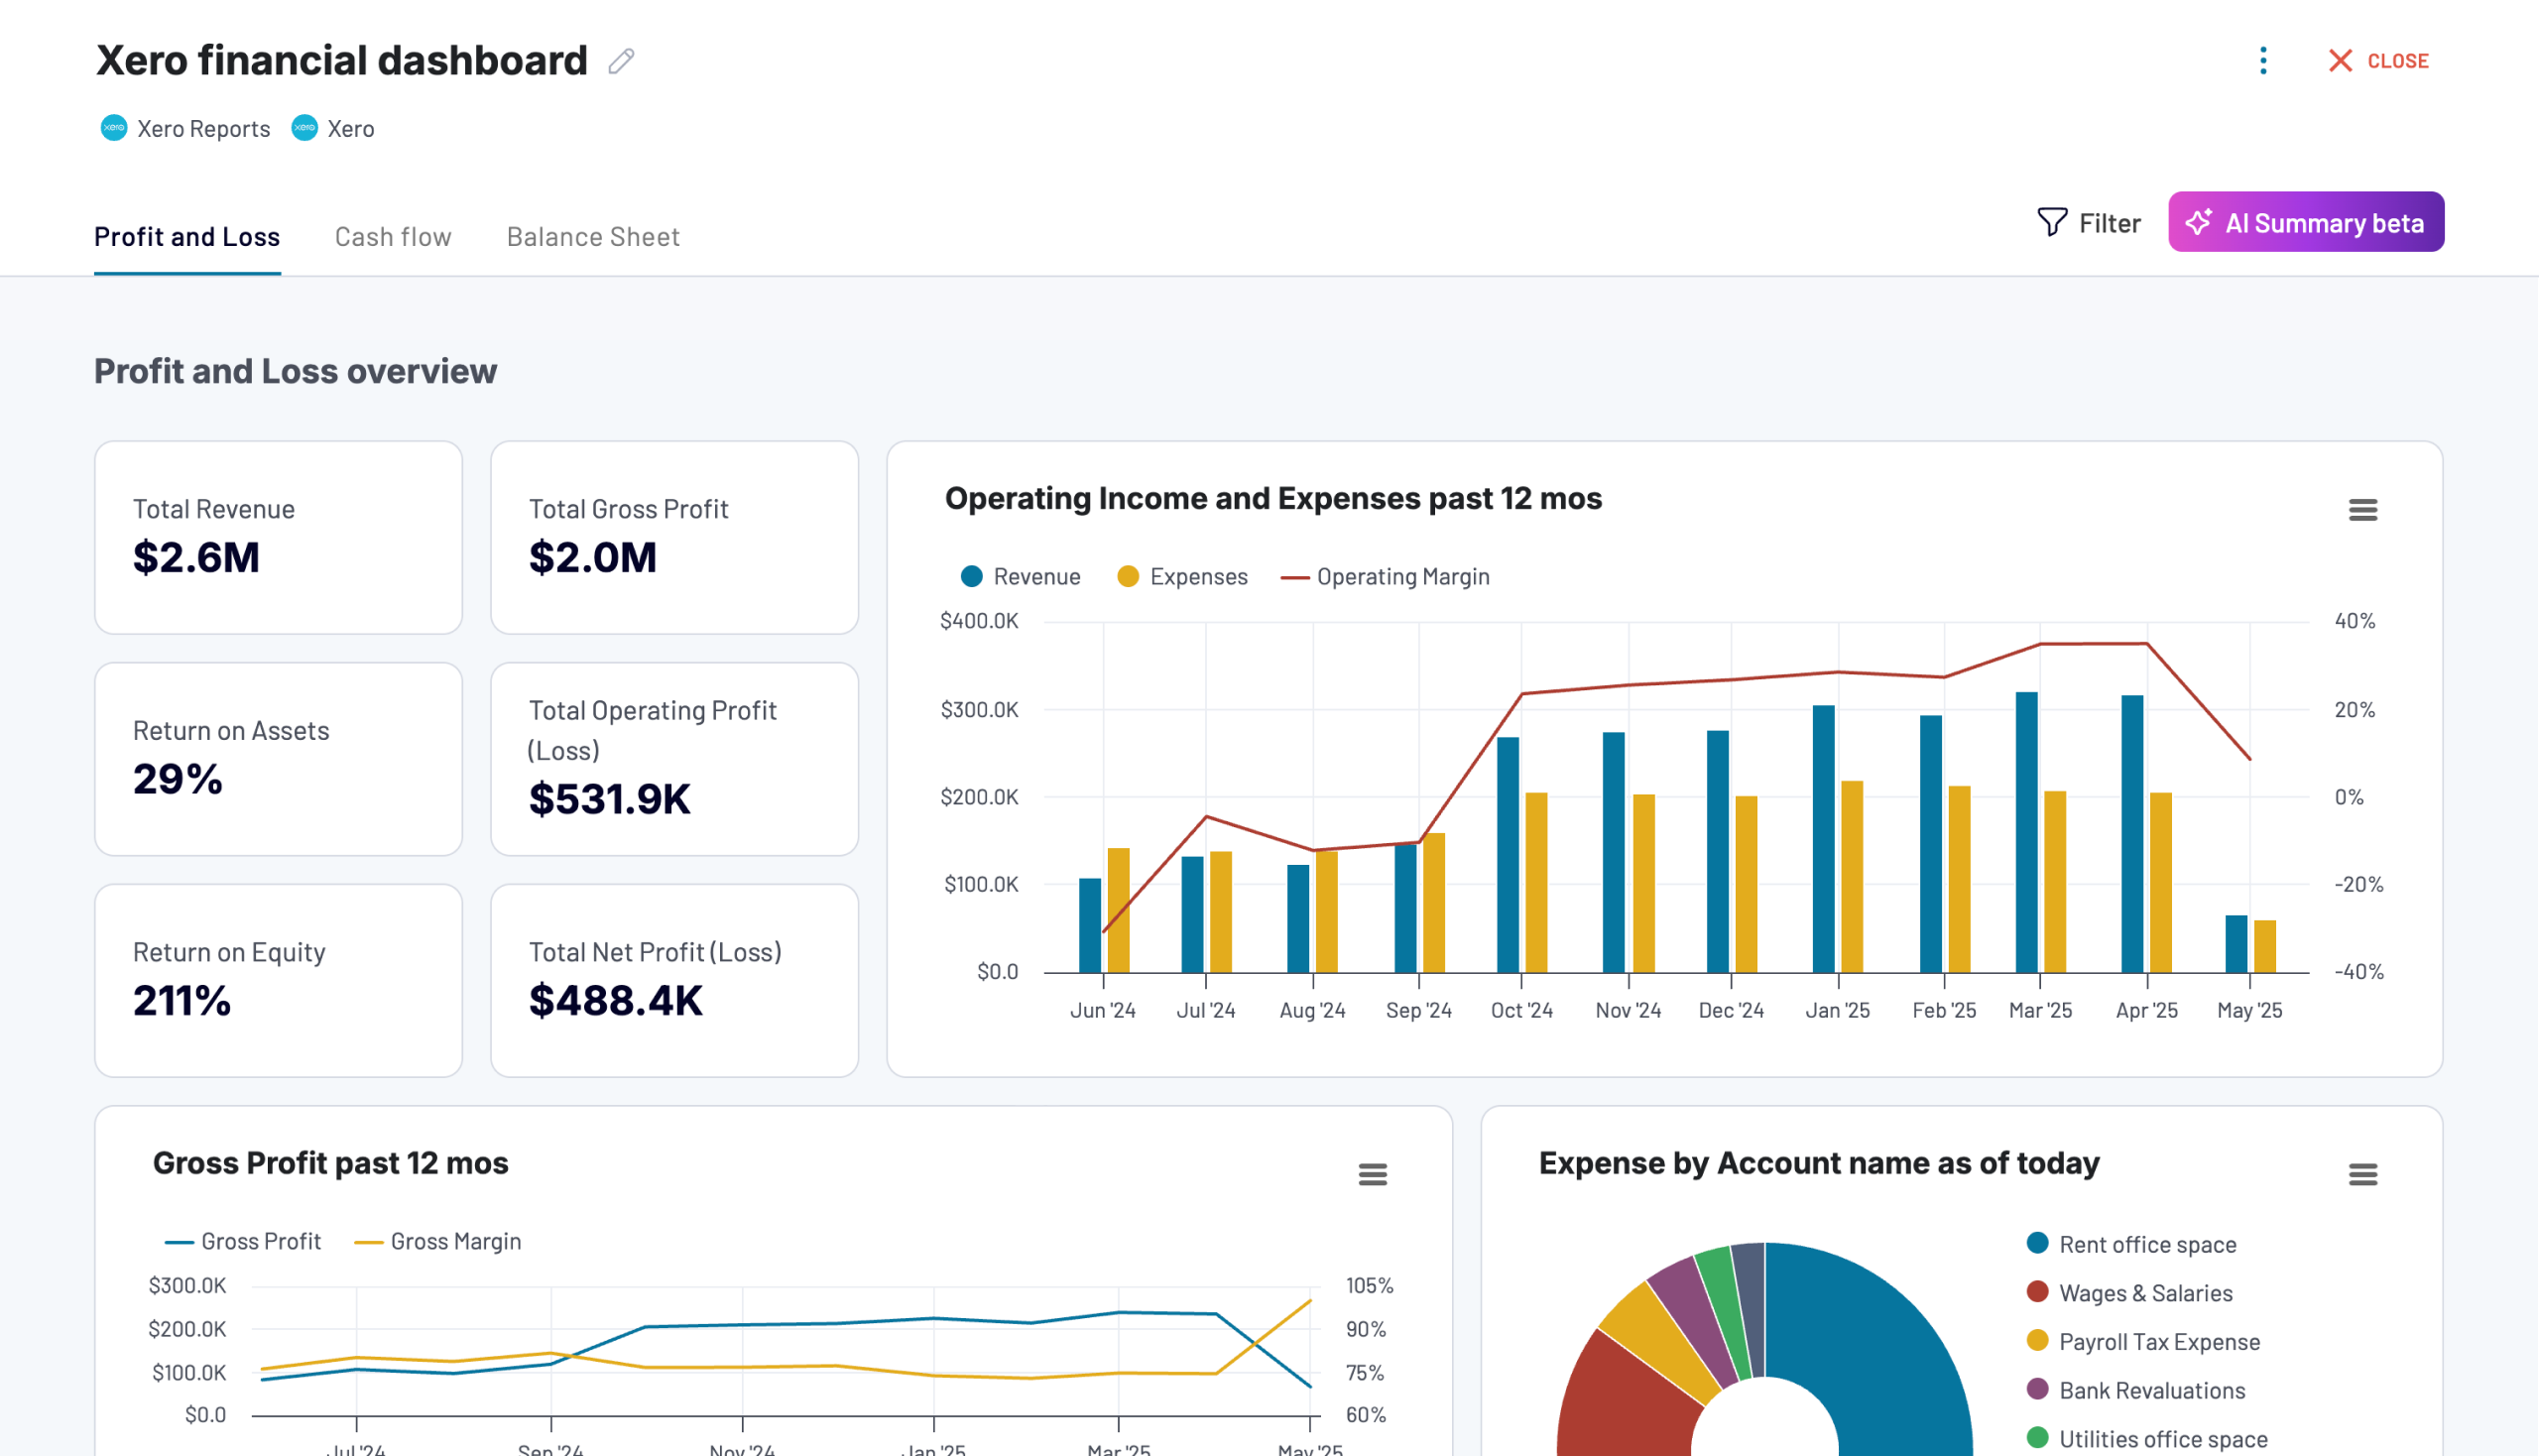
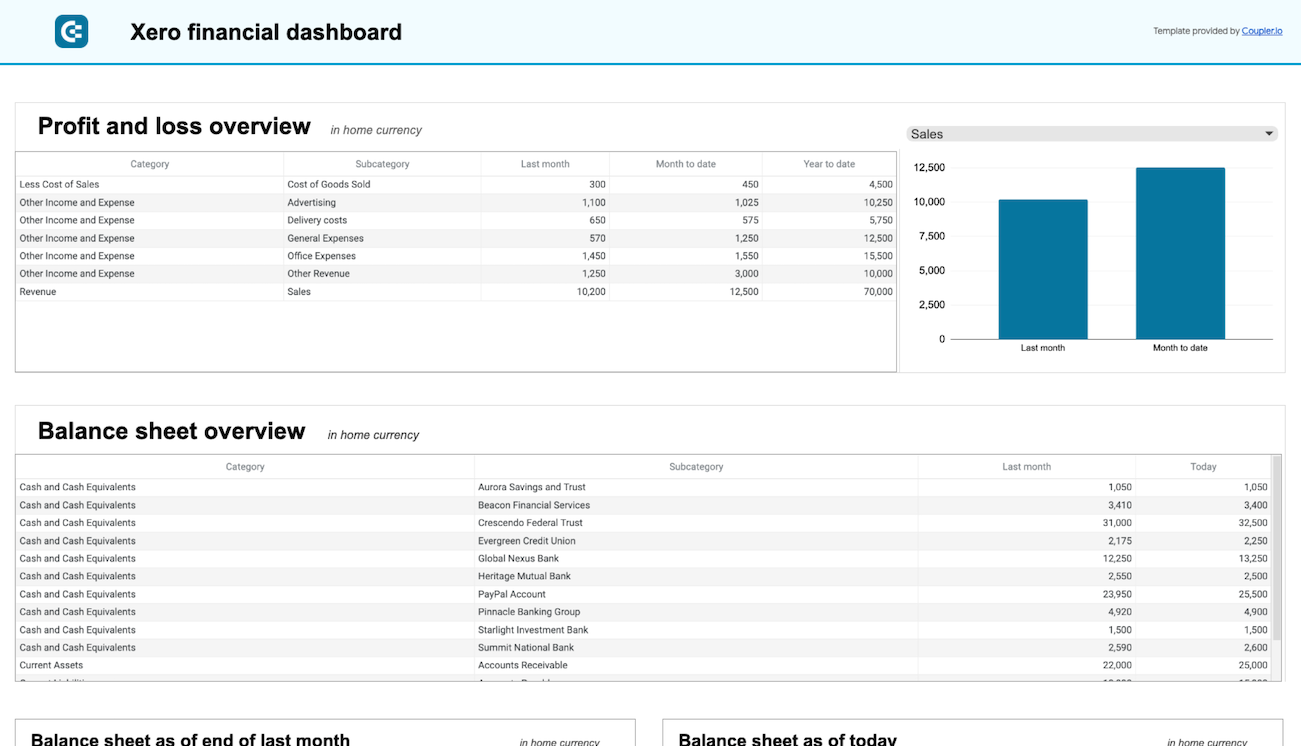
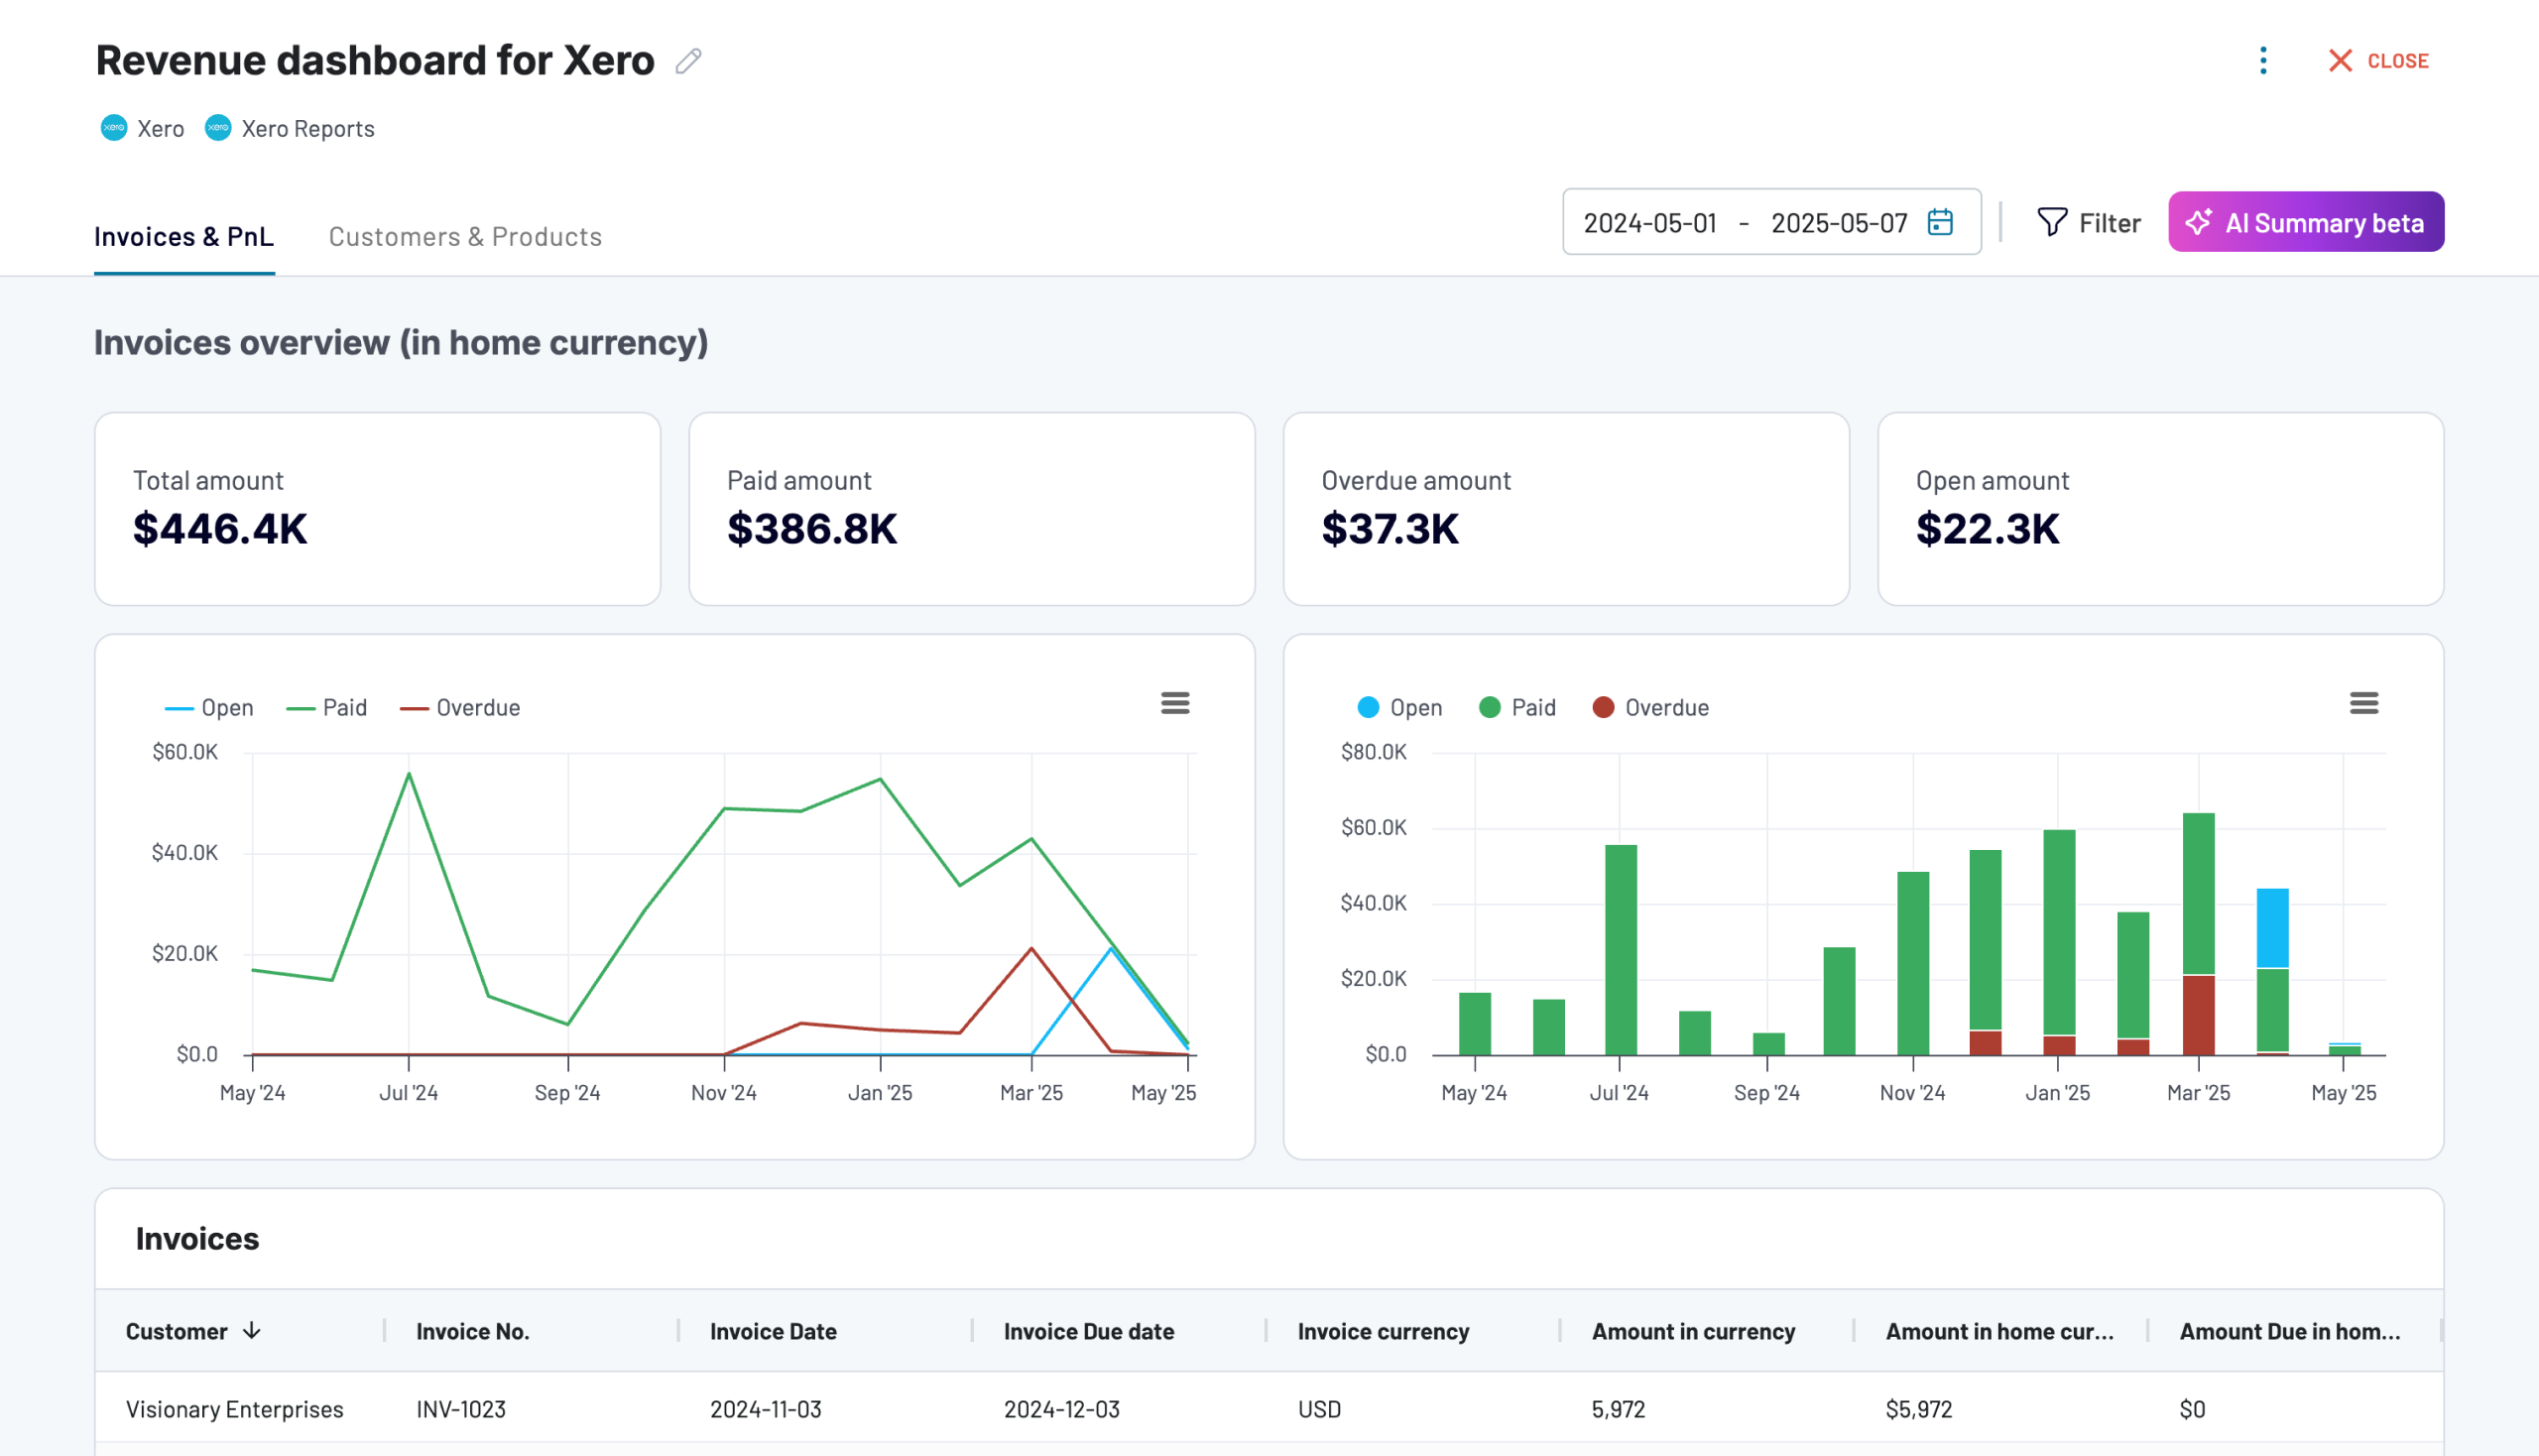
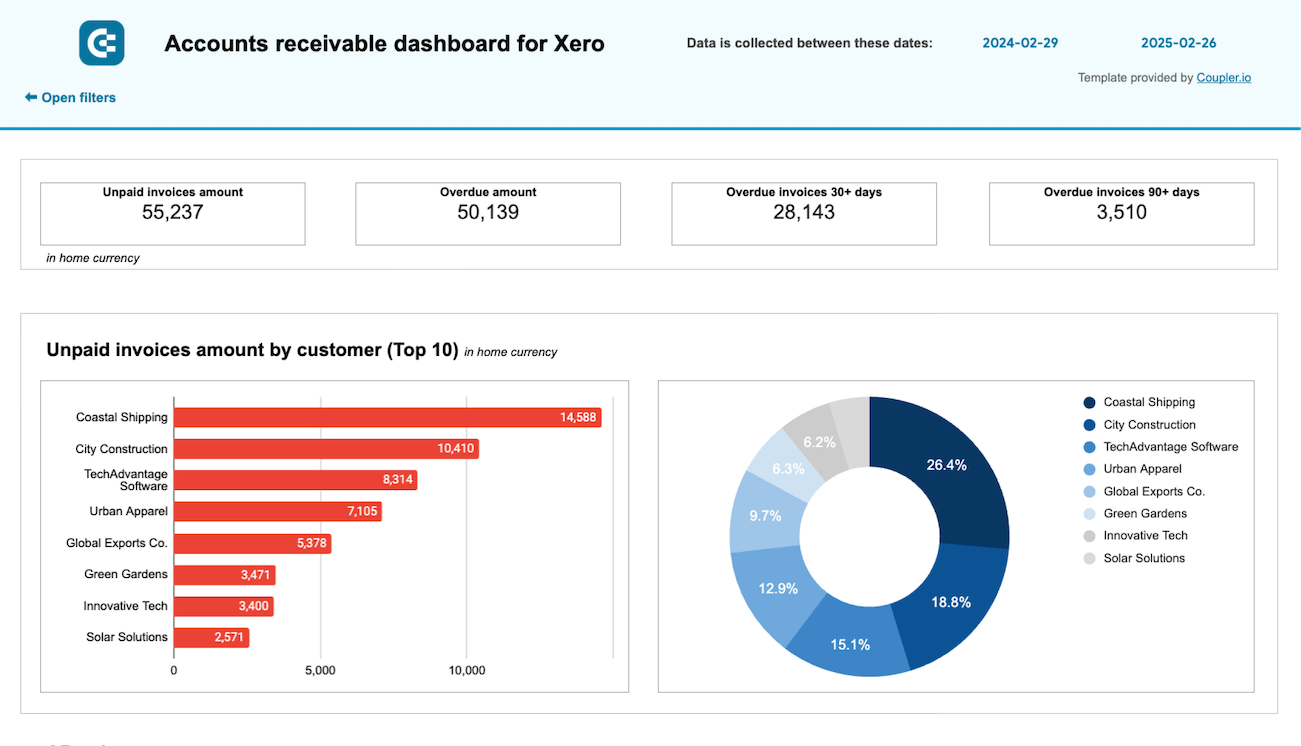
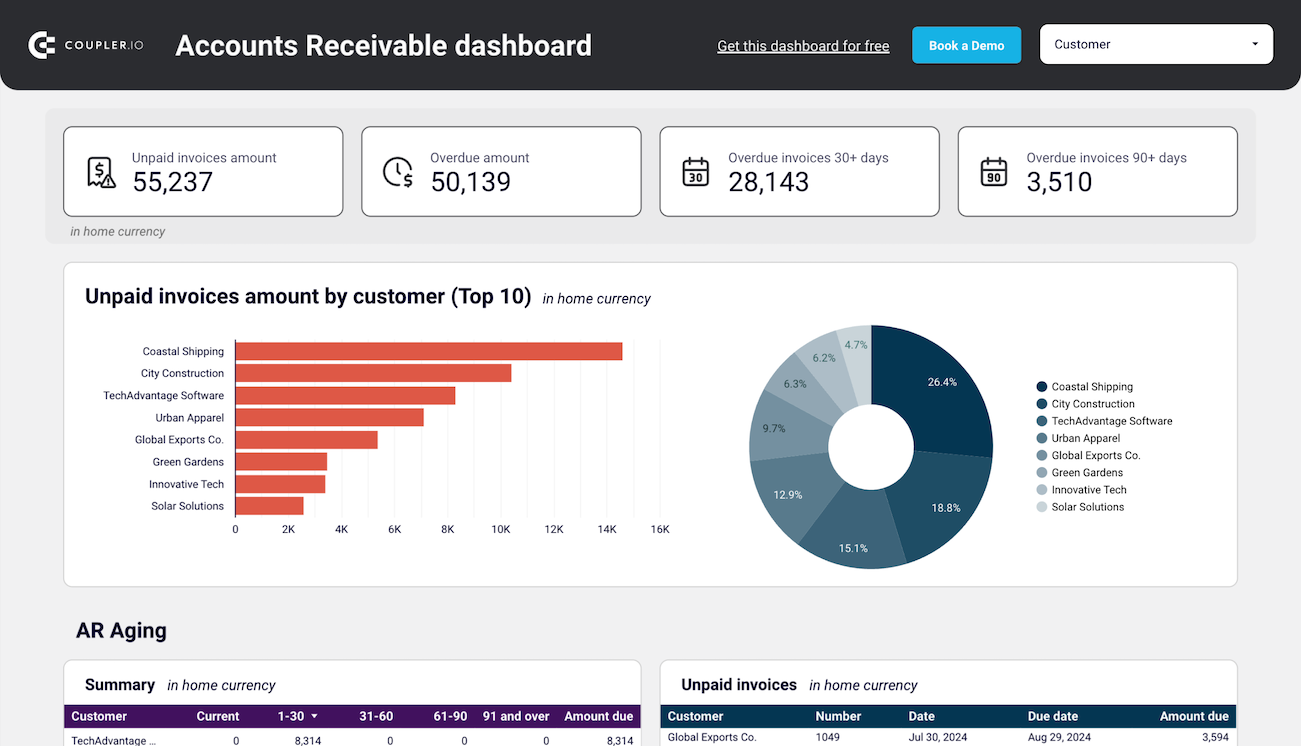
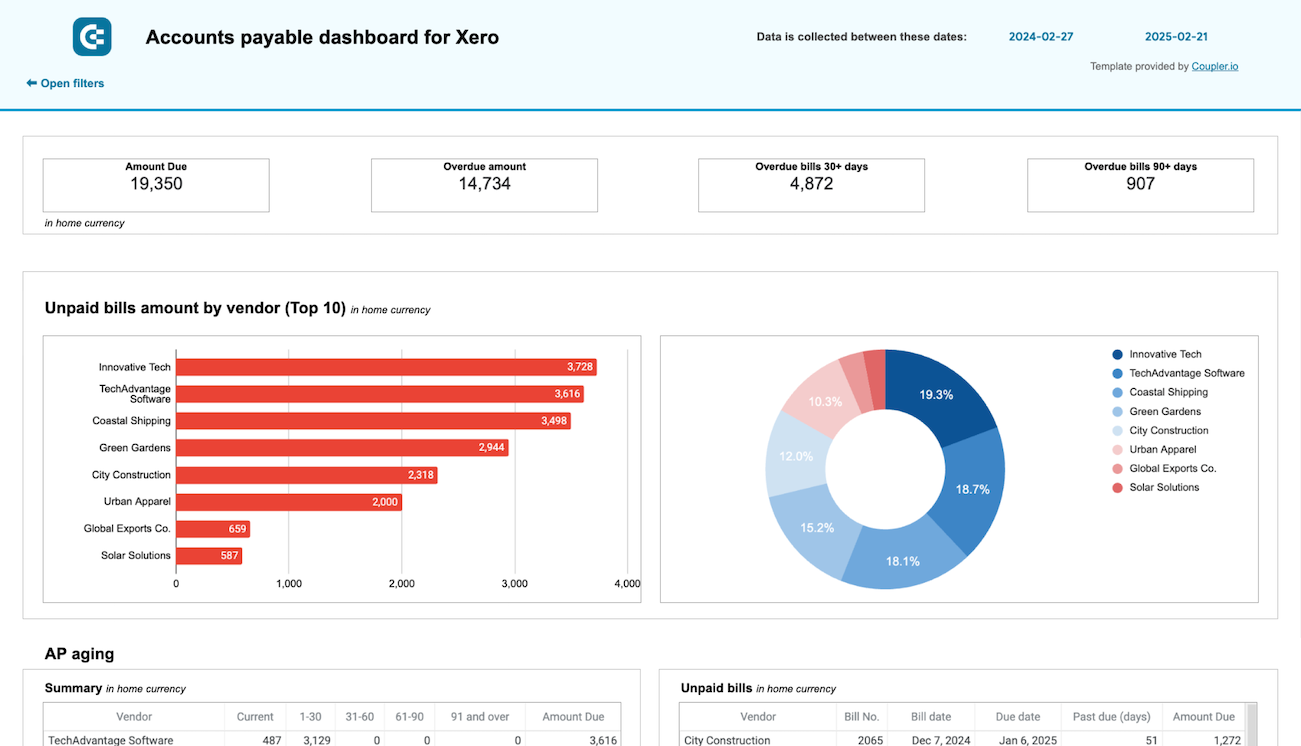
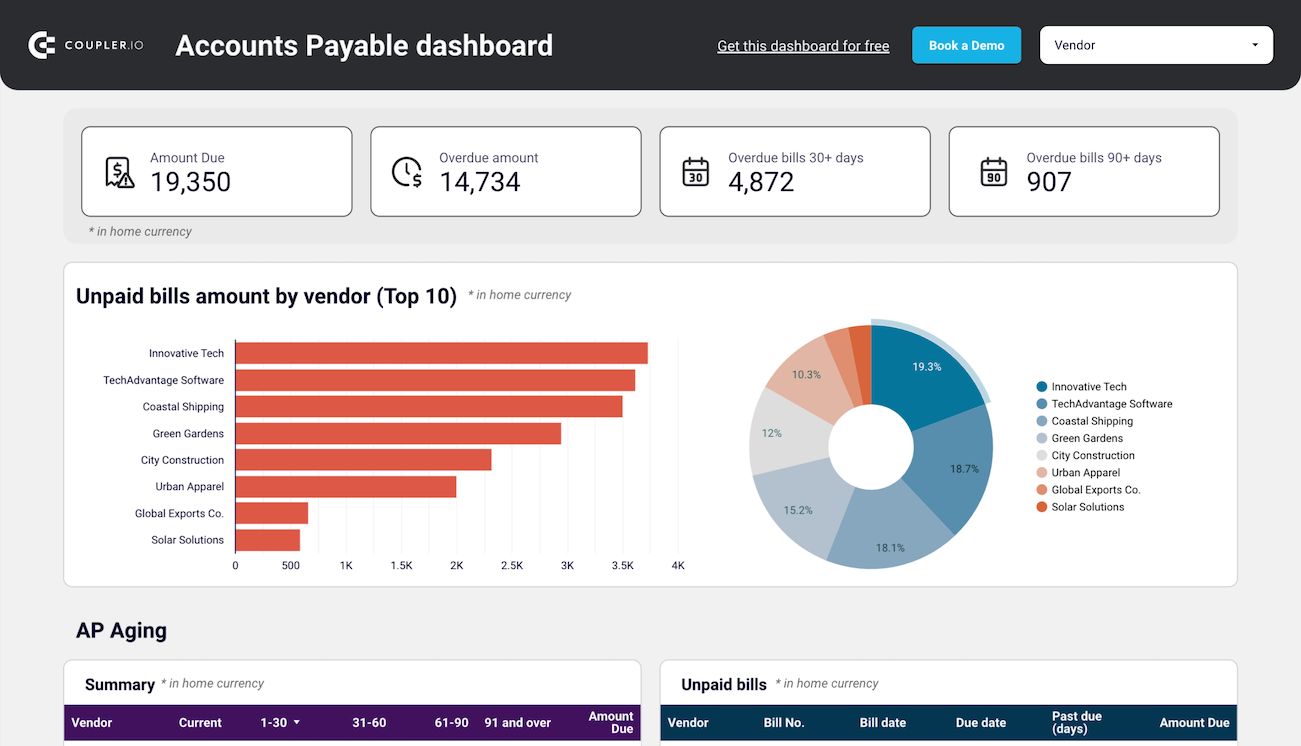
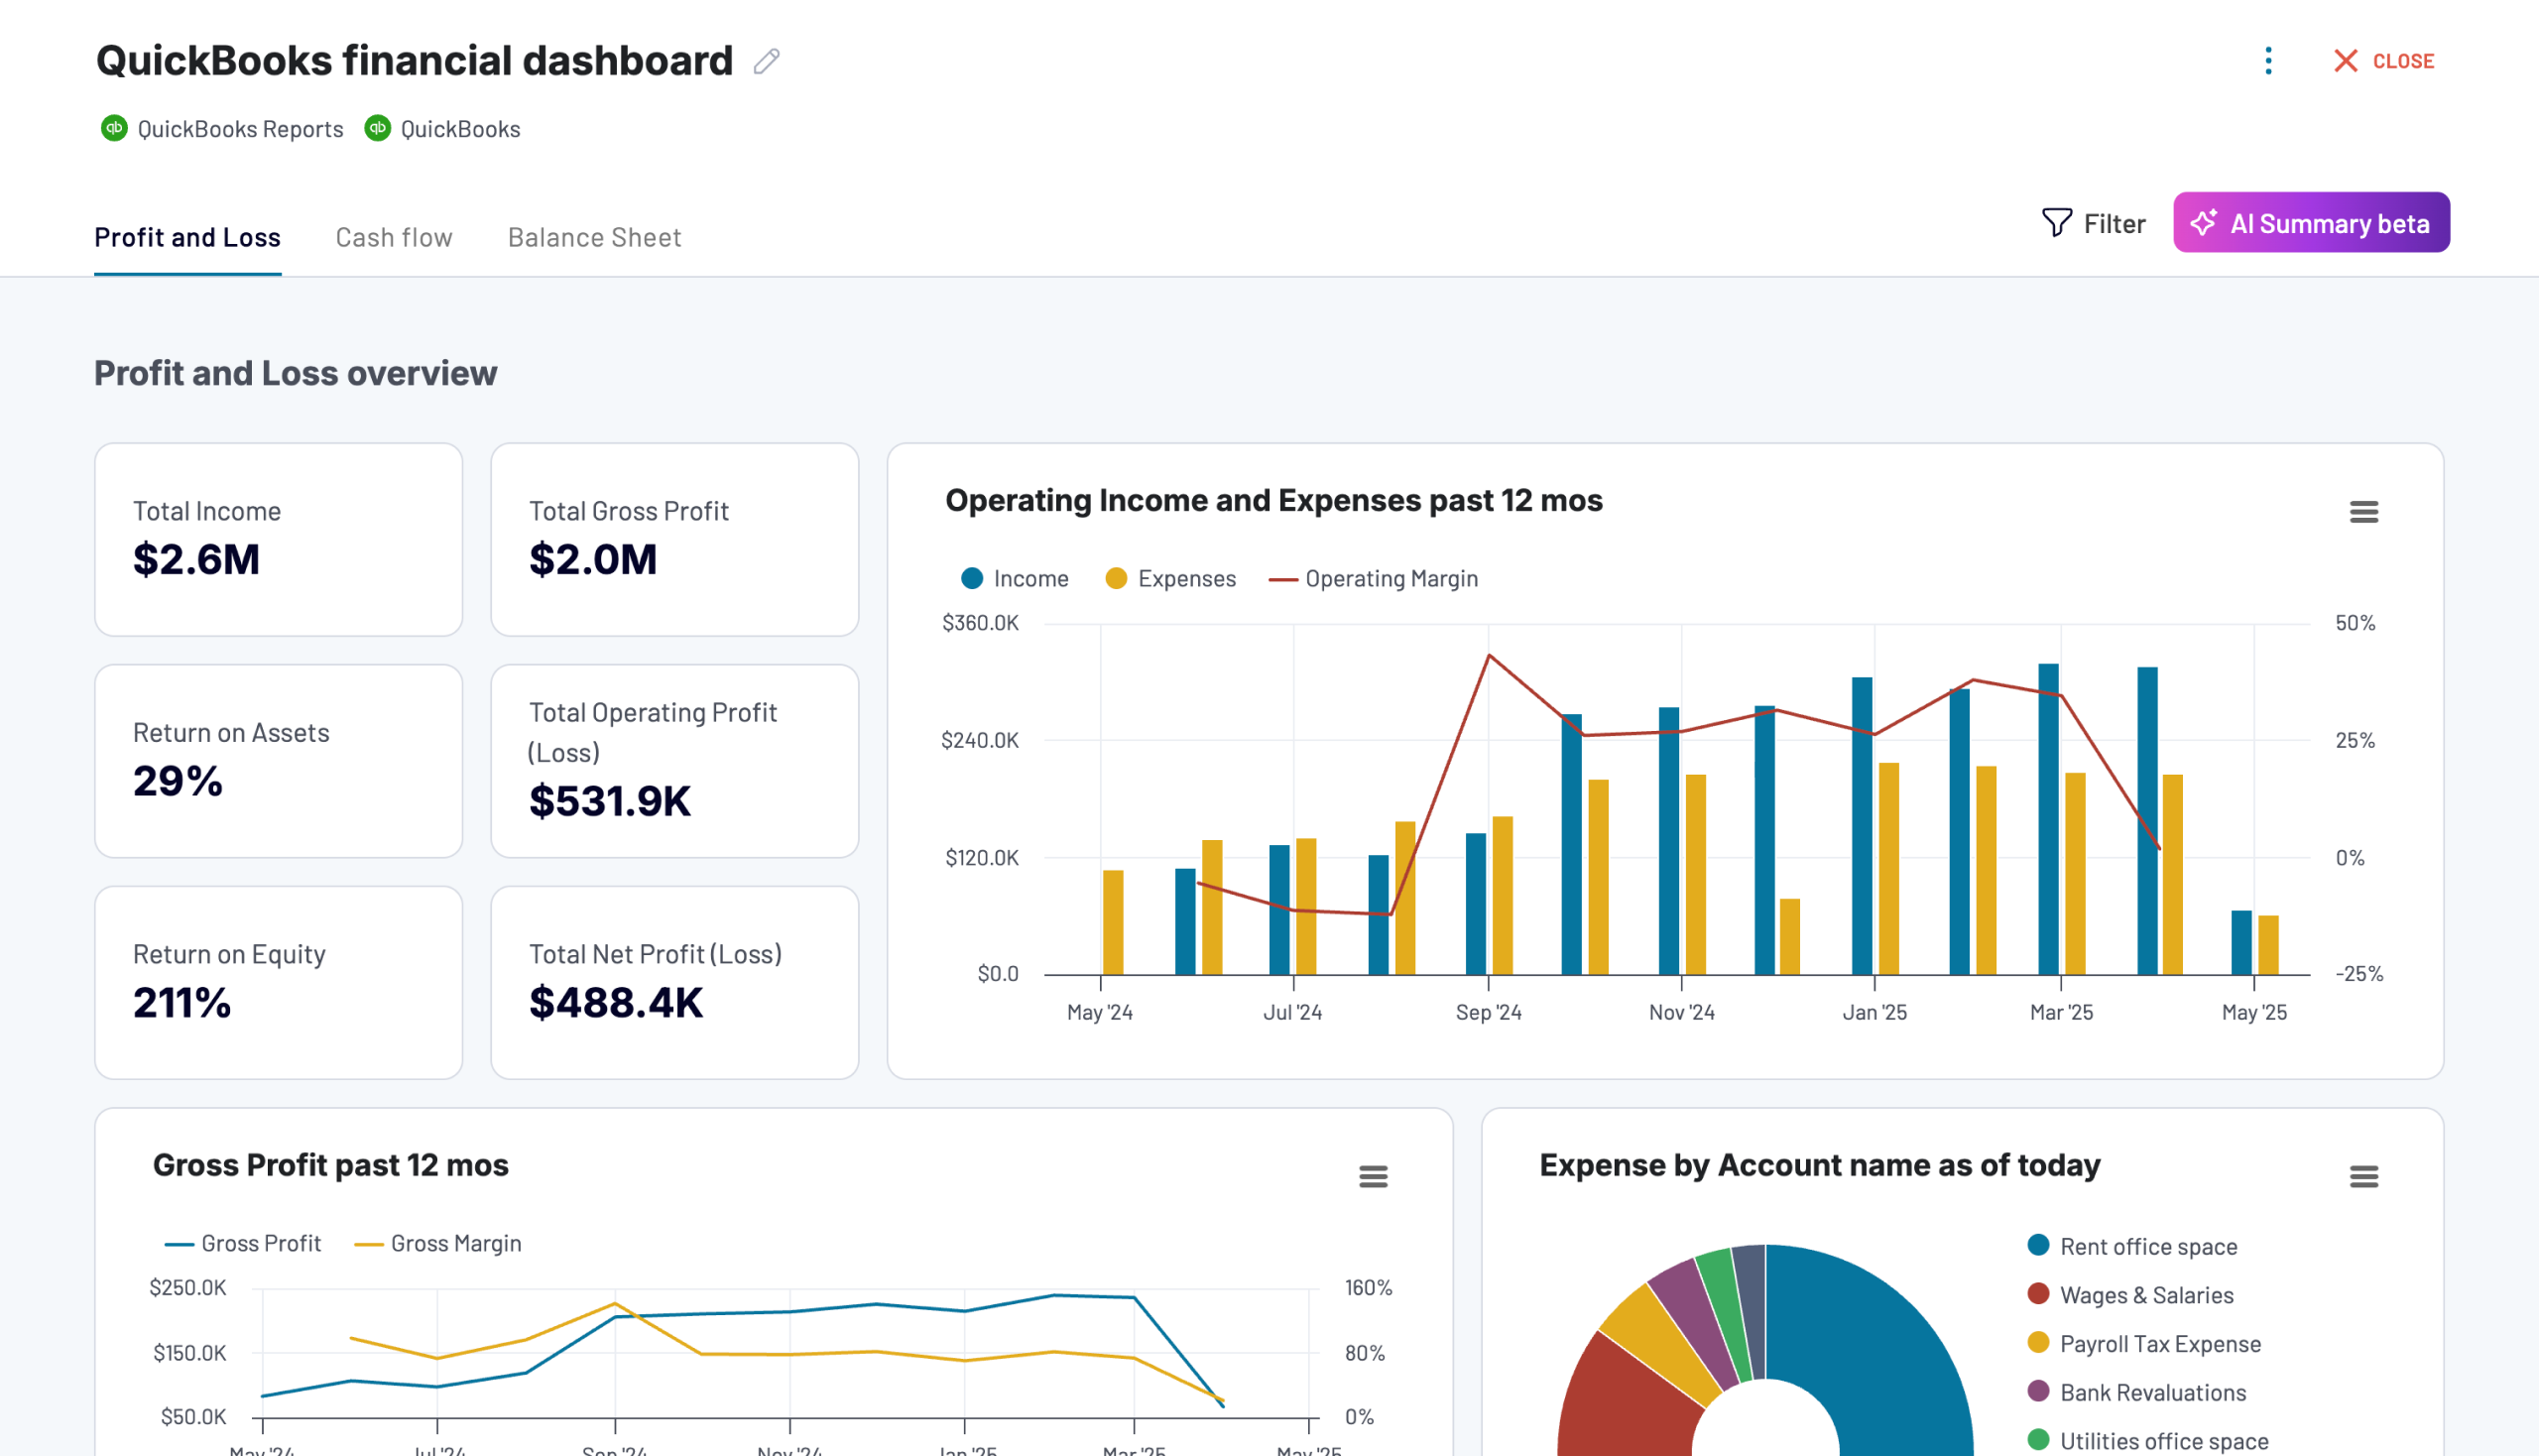
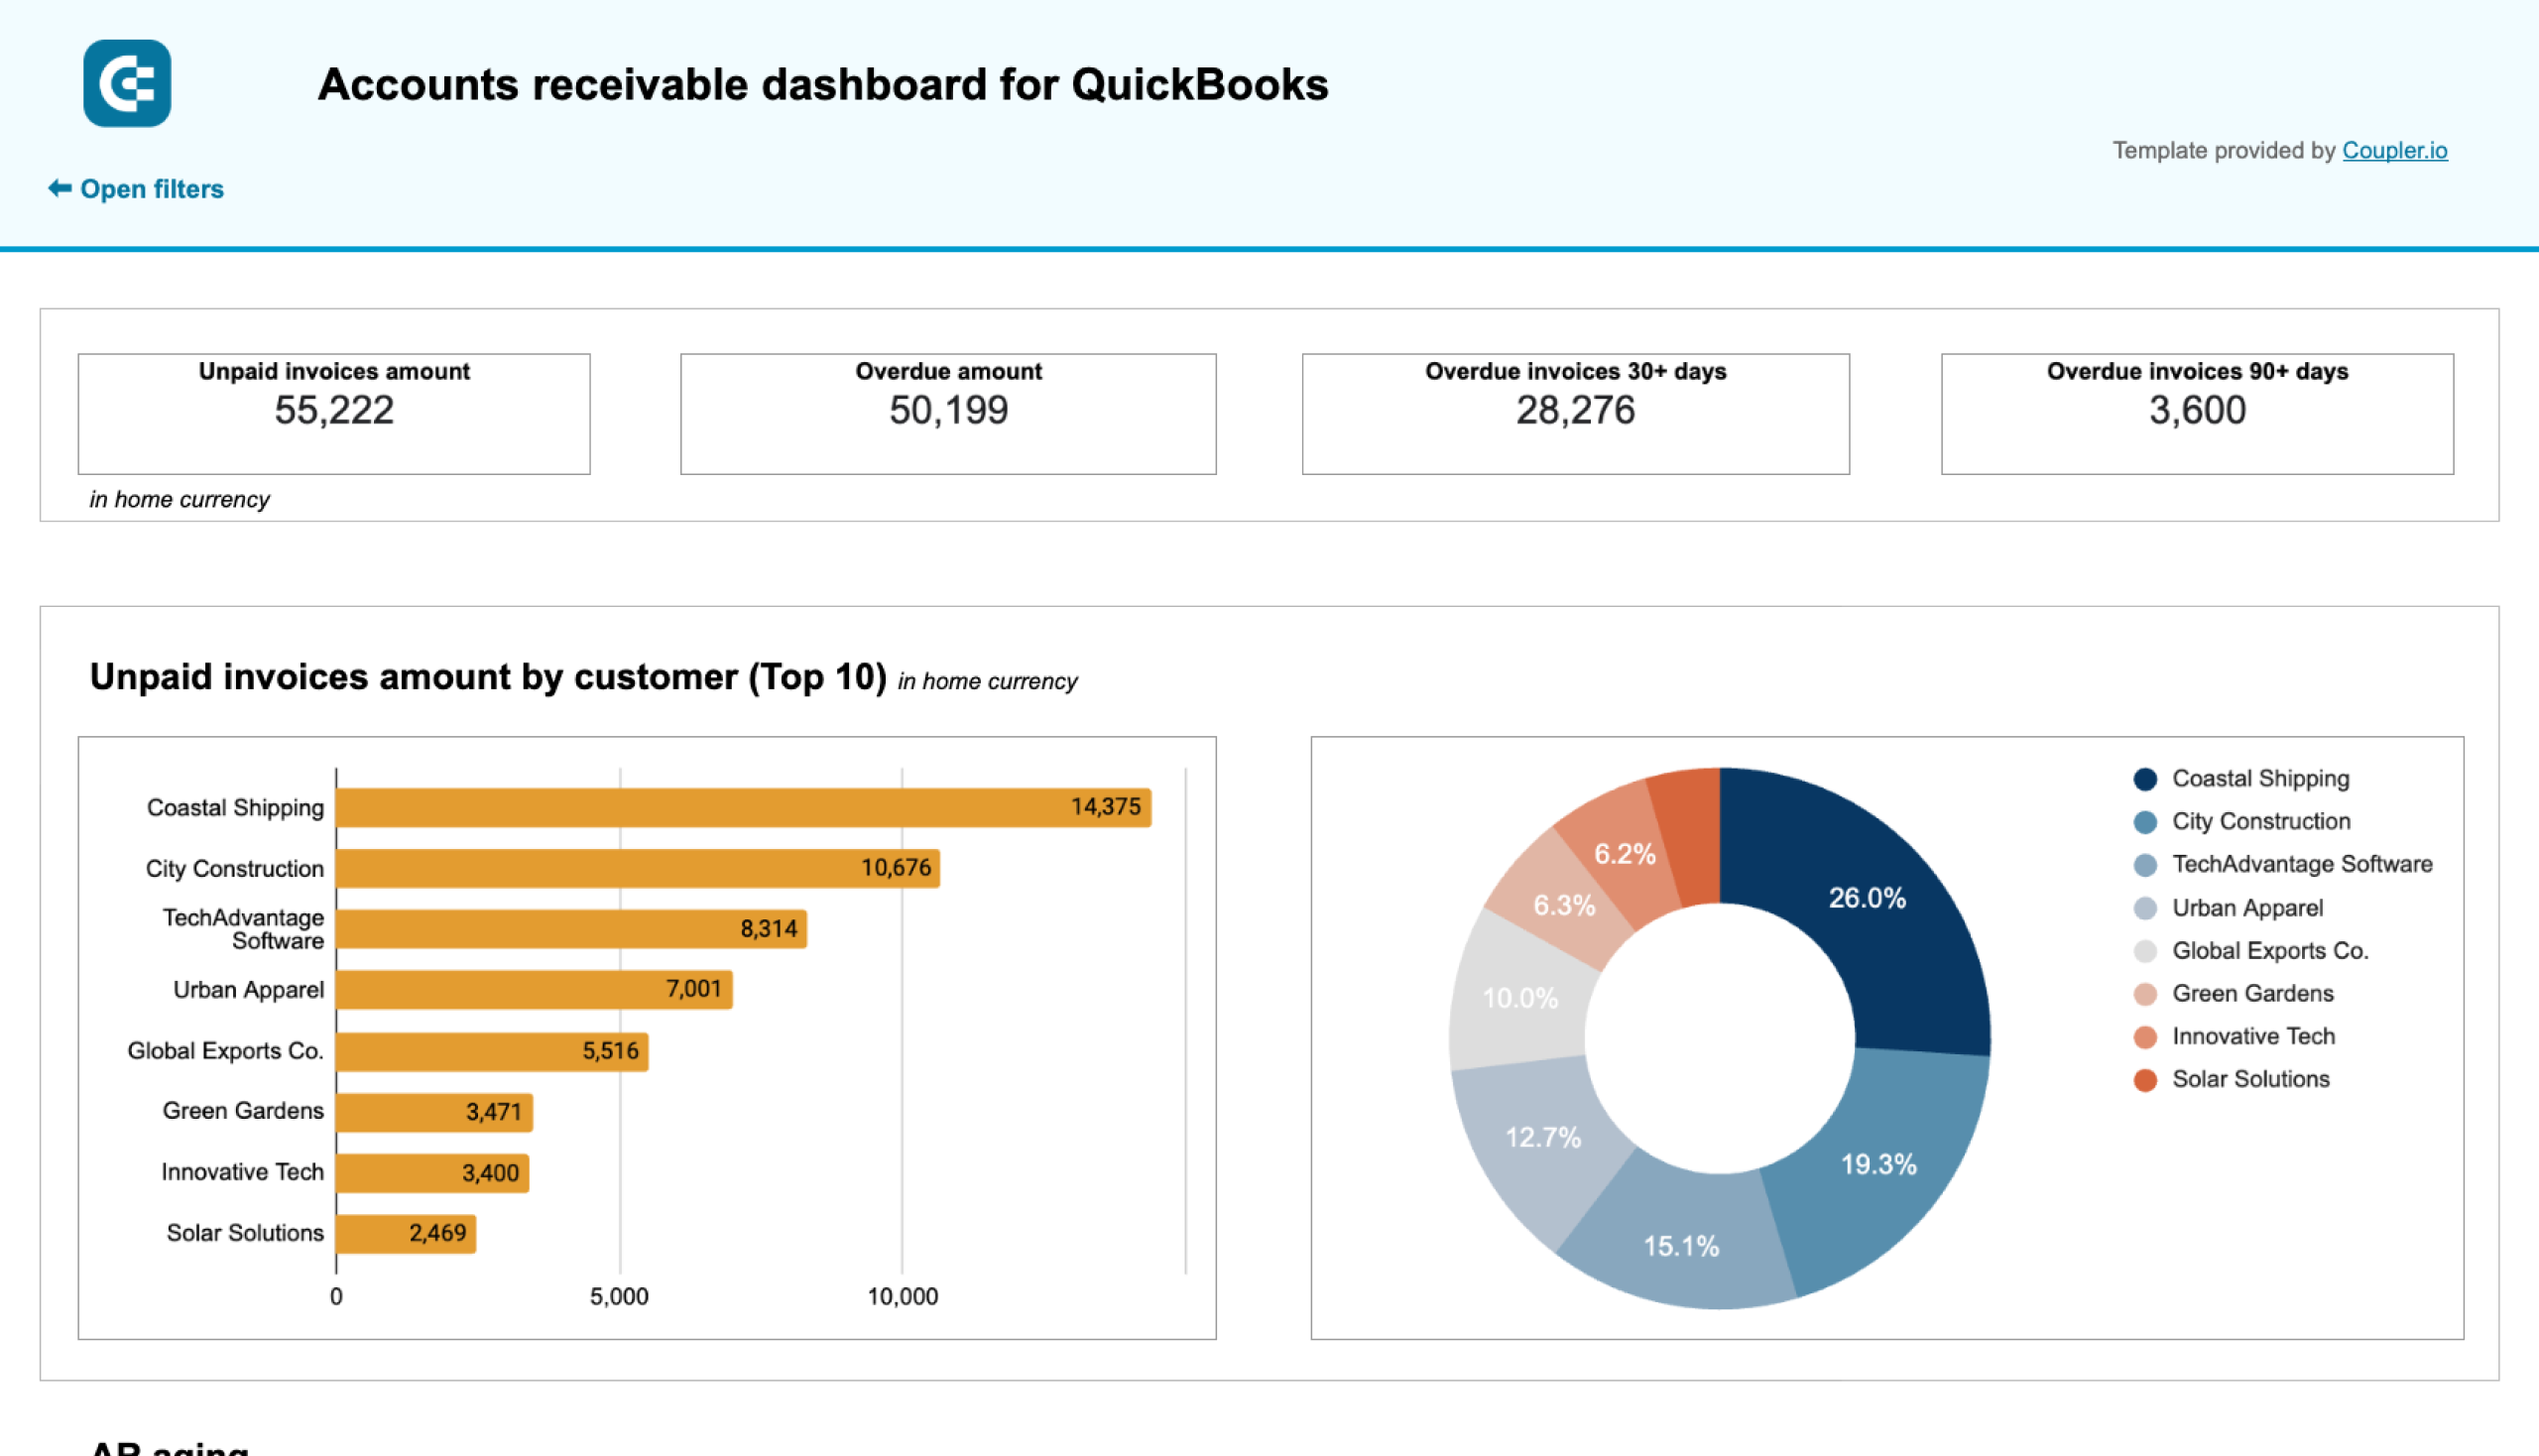
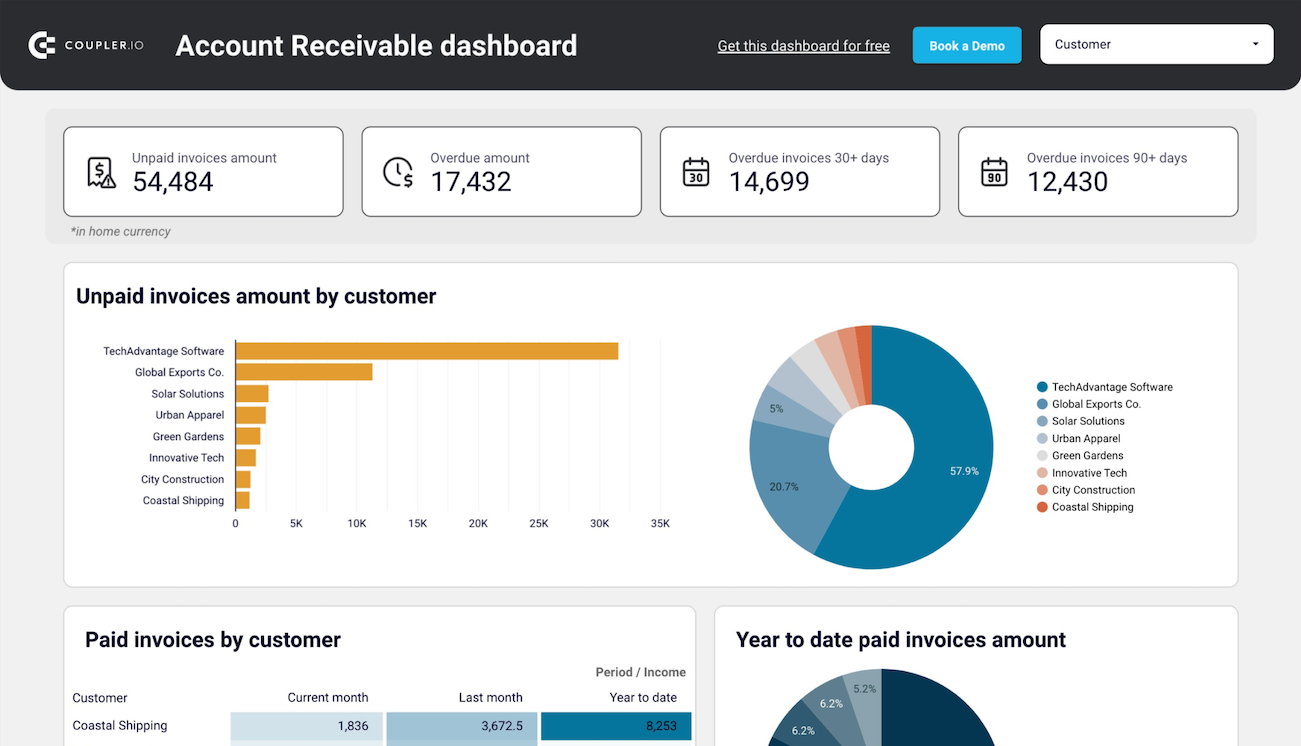
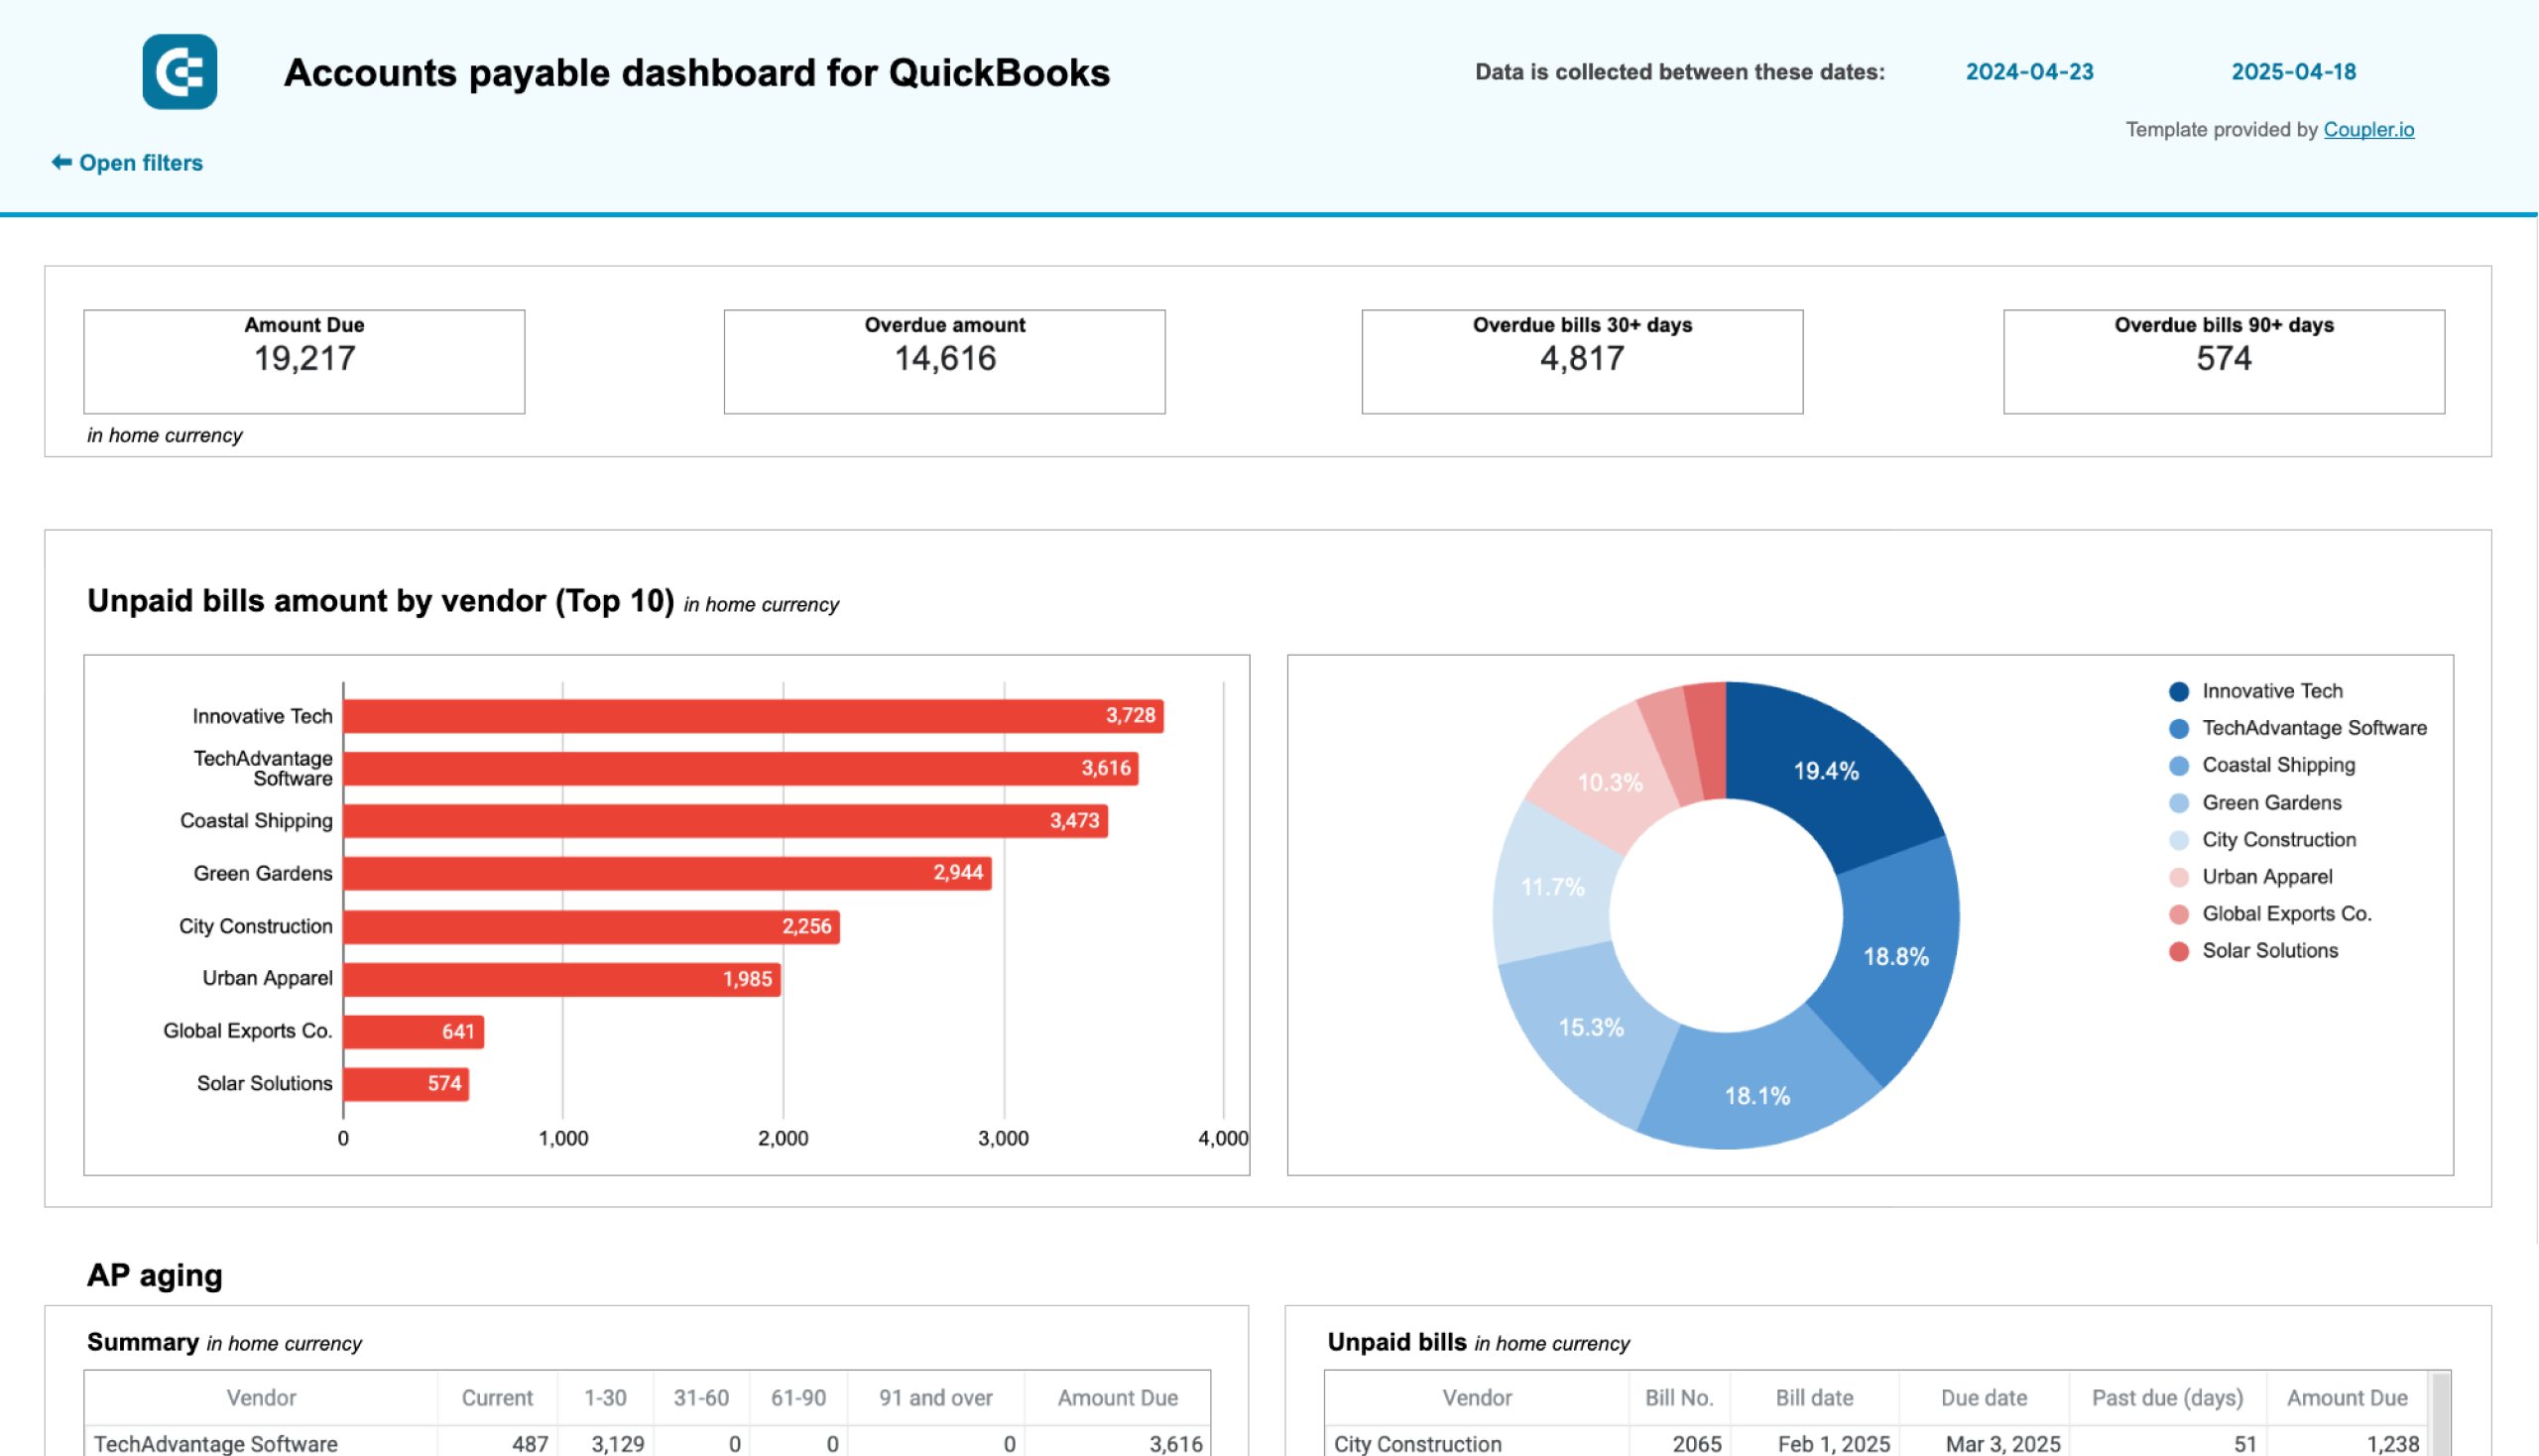
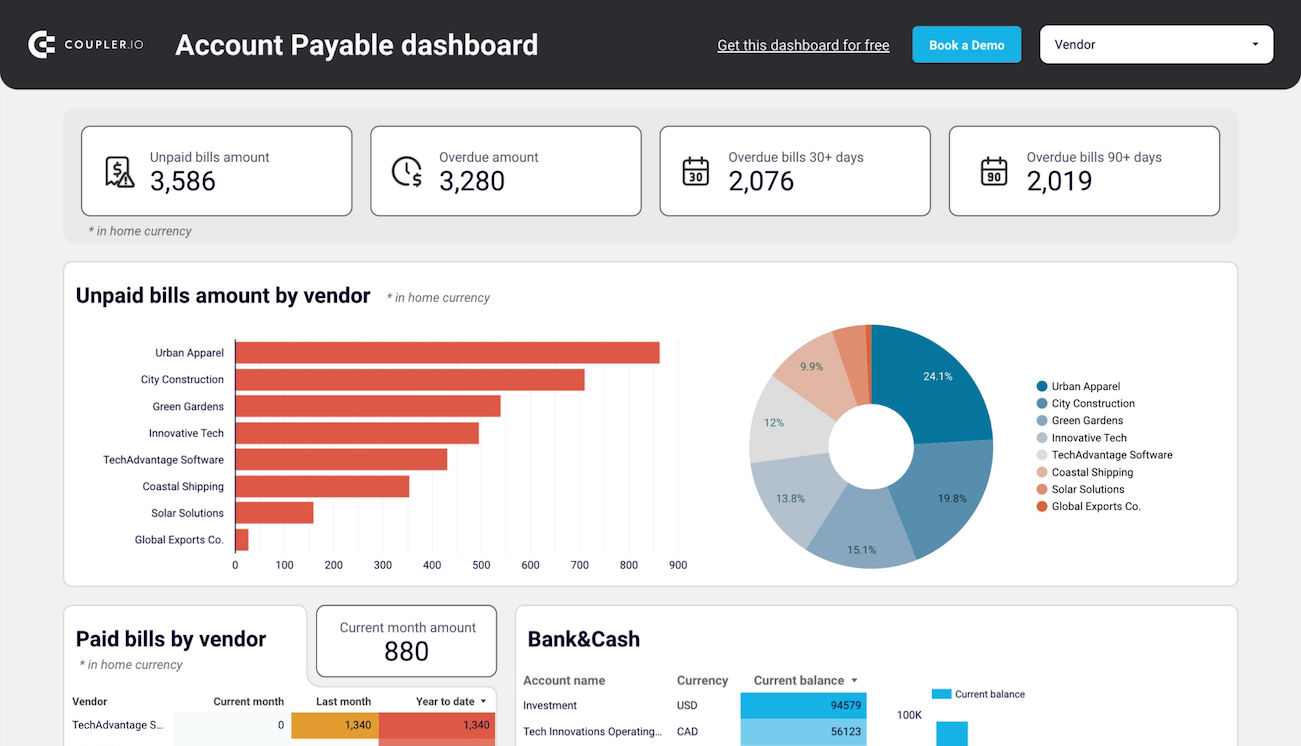
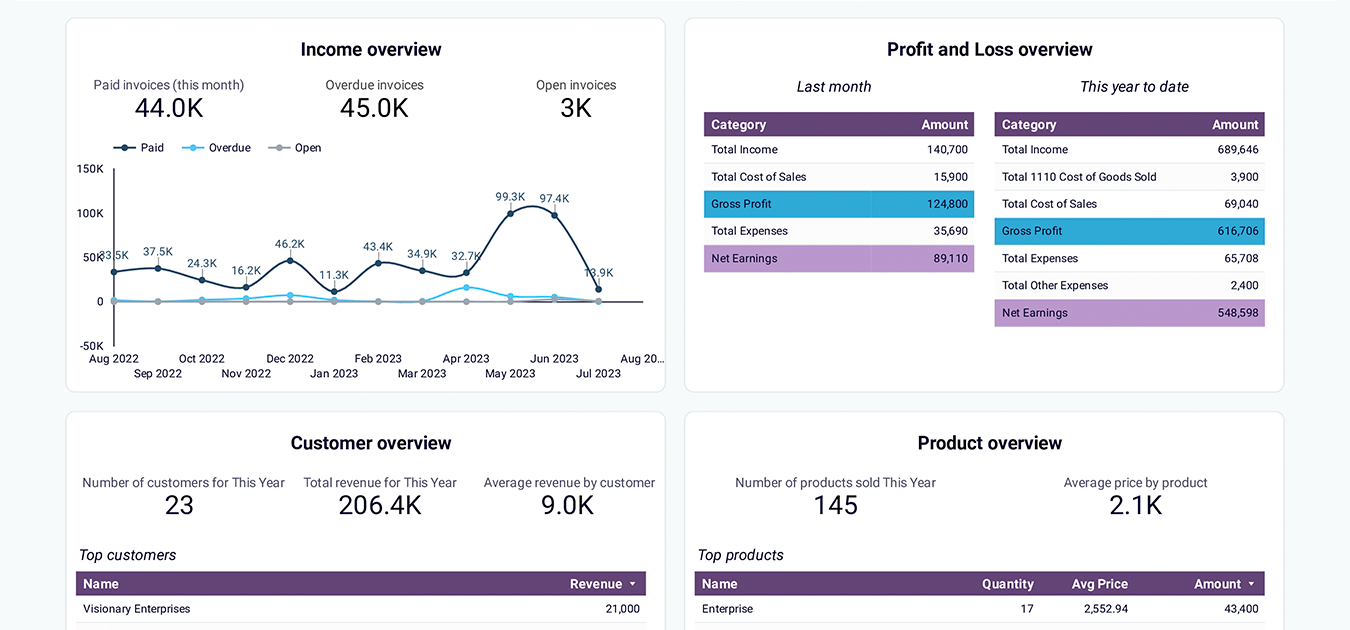
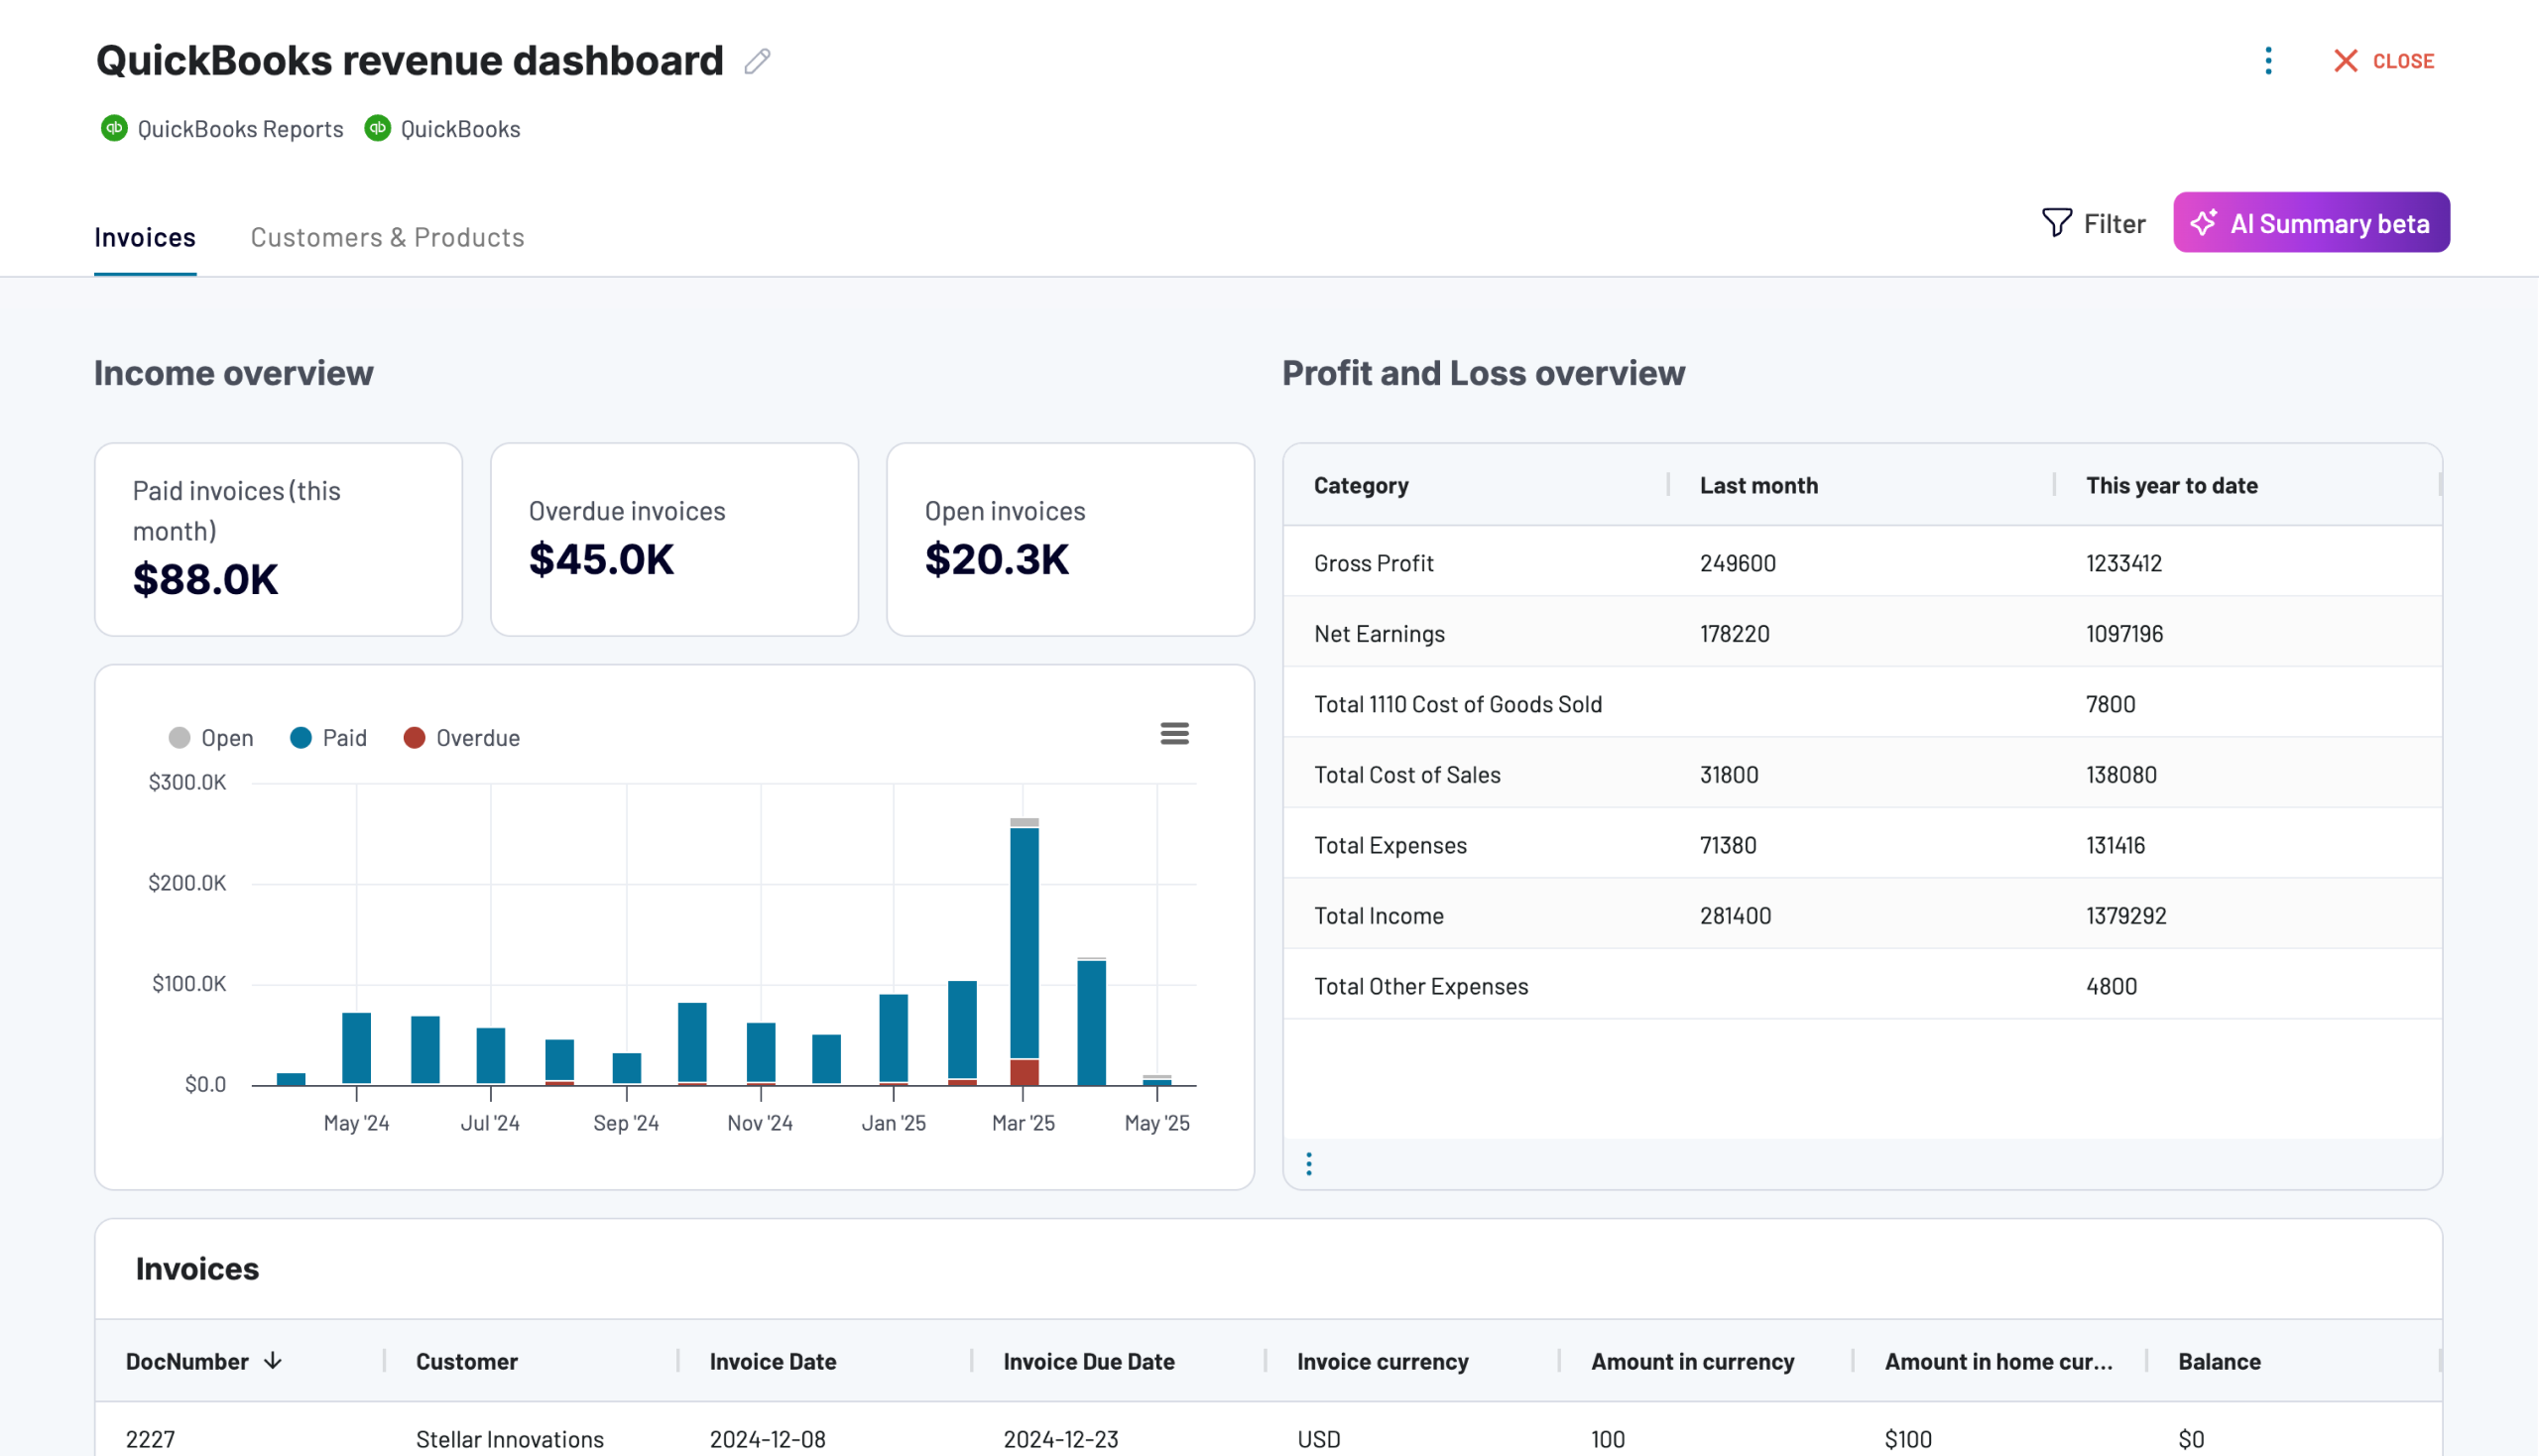
Finance dashboards
Gain a clear understanding of your financial health using our dedicated dashboard templates. They seamlessly integrate with accounting and financial solutions such as Xero, QuickBooks, and Stripe. With our finances dashboard examples, you can track cash flow, expenses, and profit margins. These dashboards also help you manage budgets, forecast trends, and make informed financial decisions.
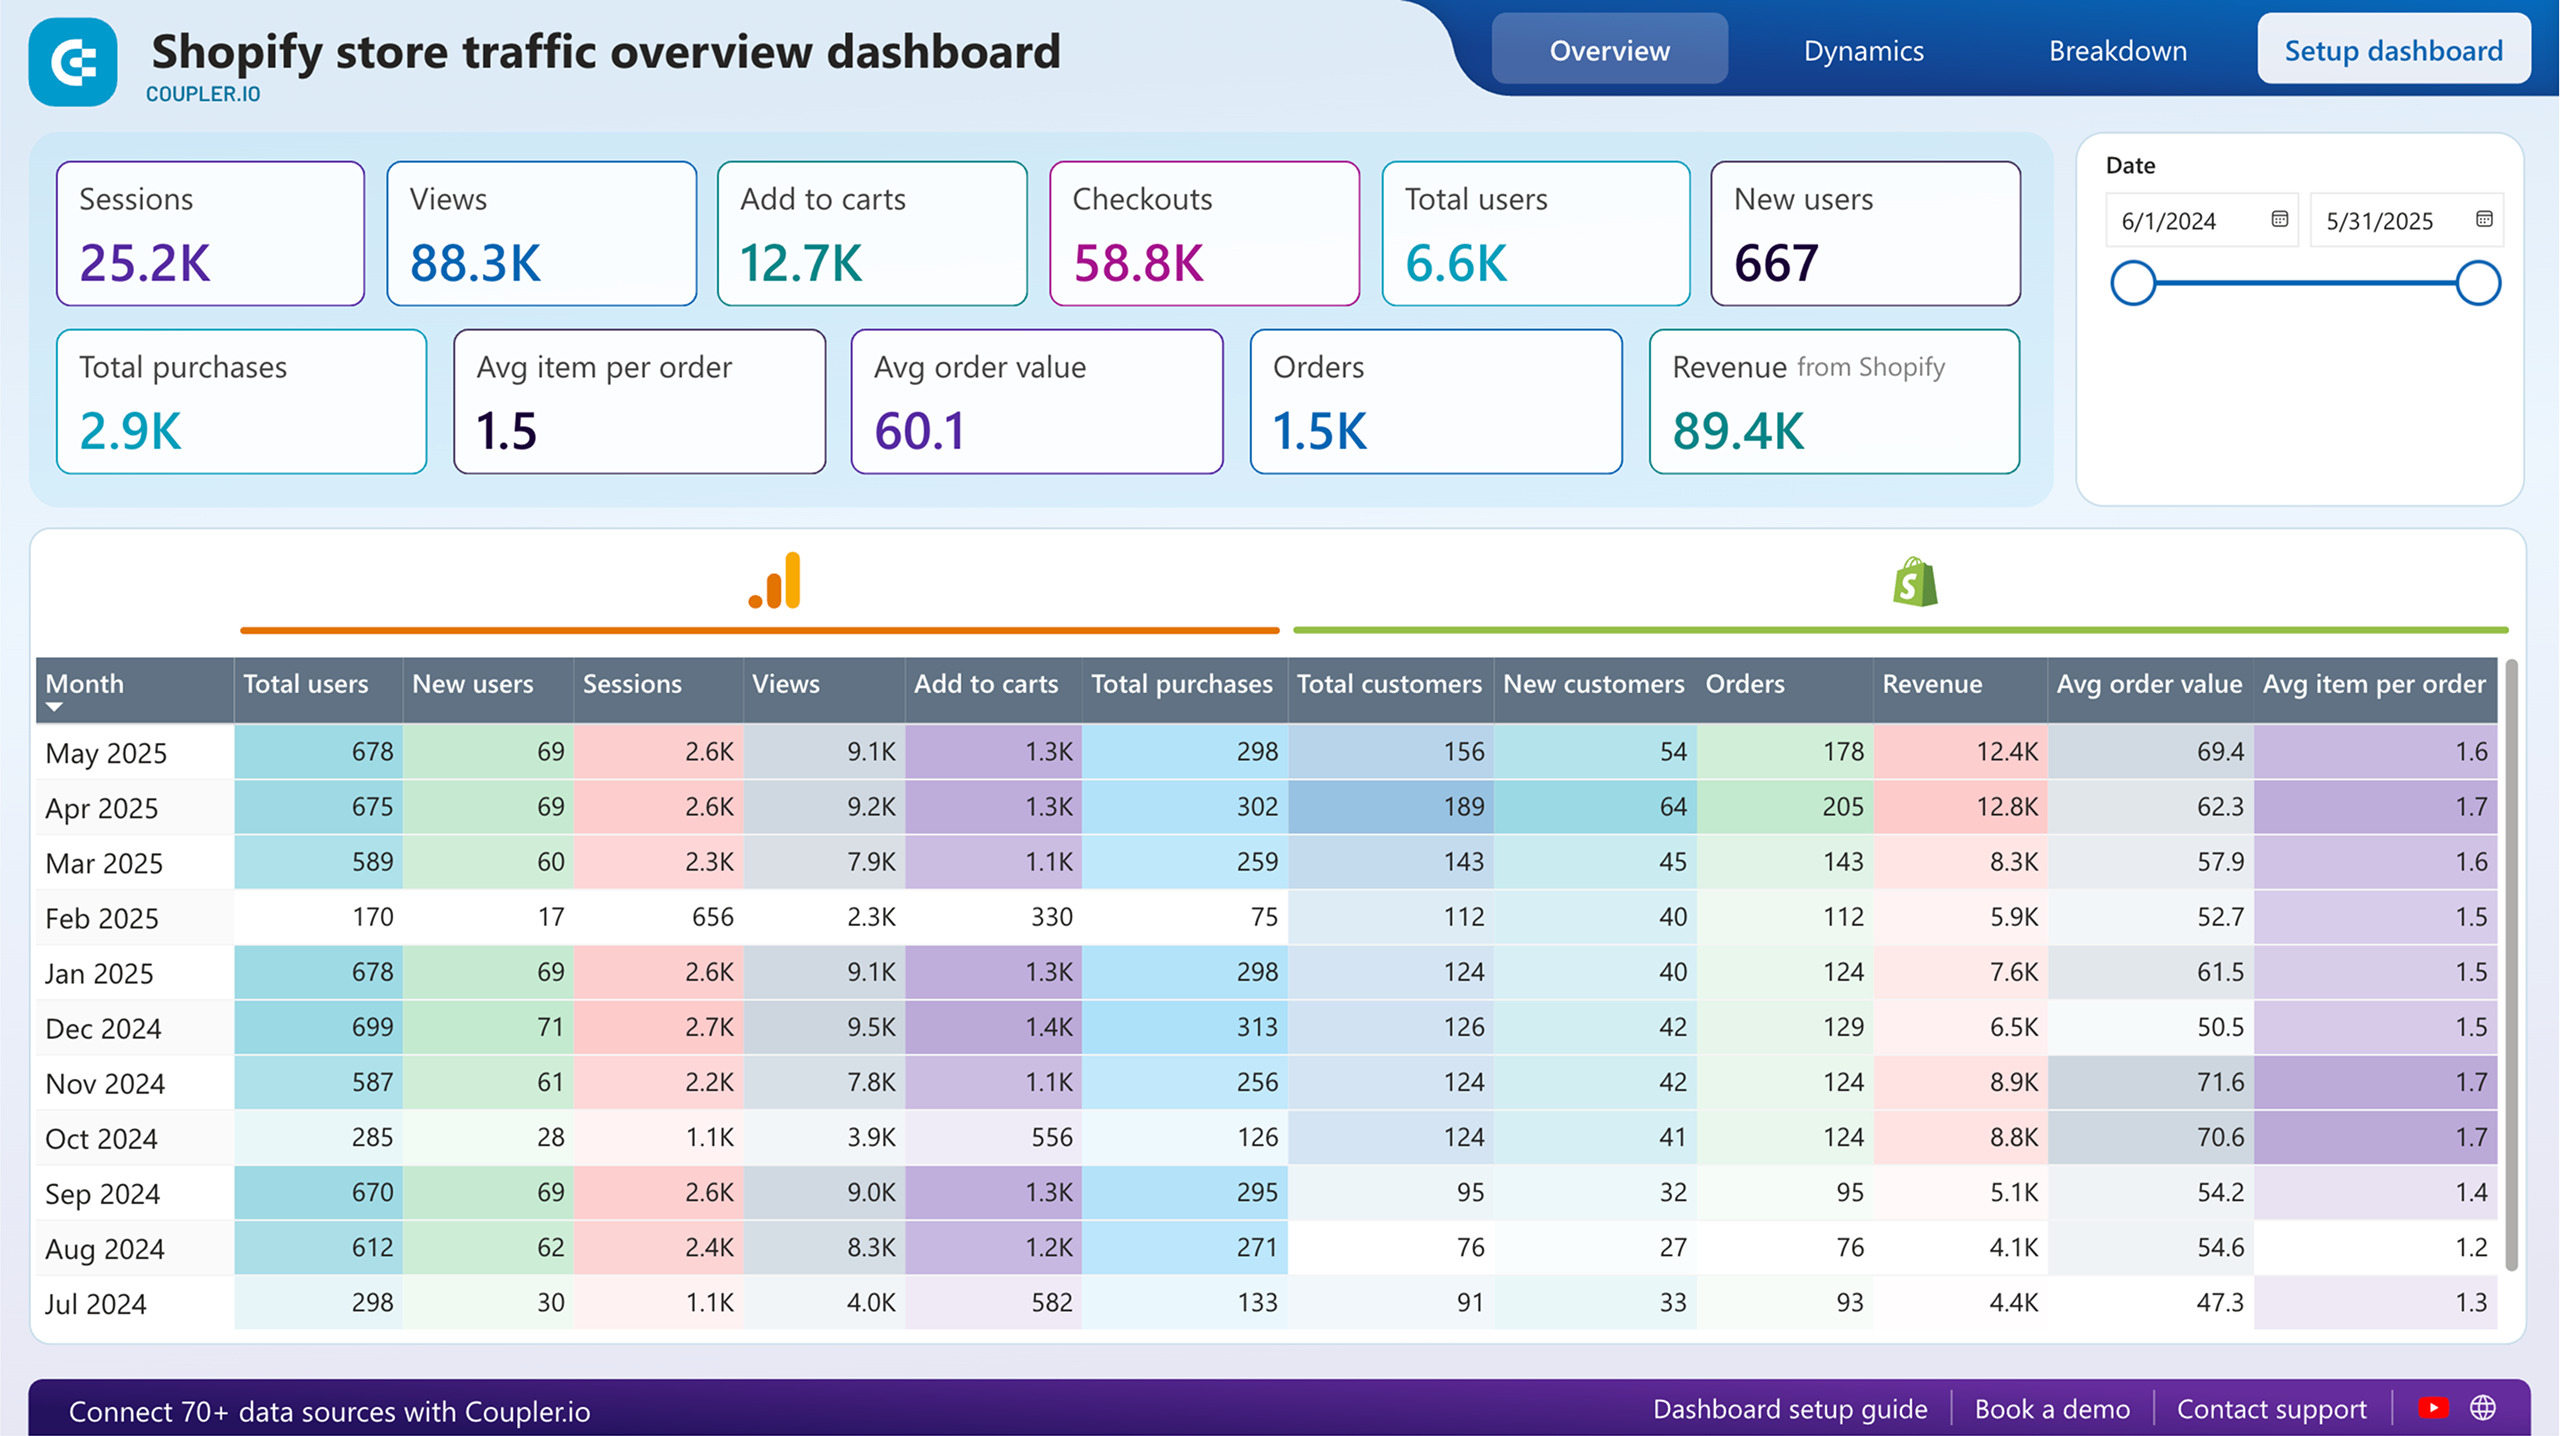
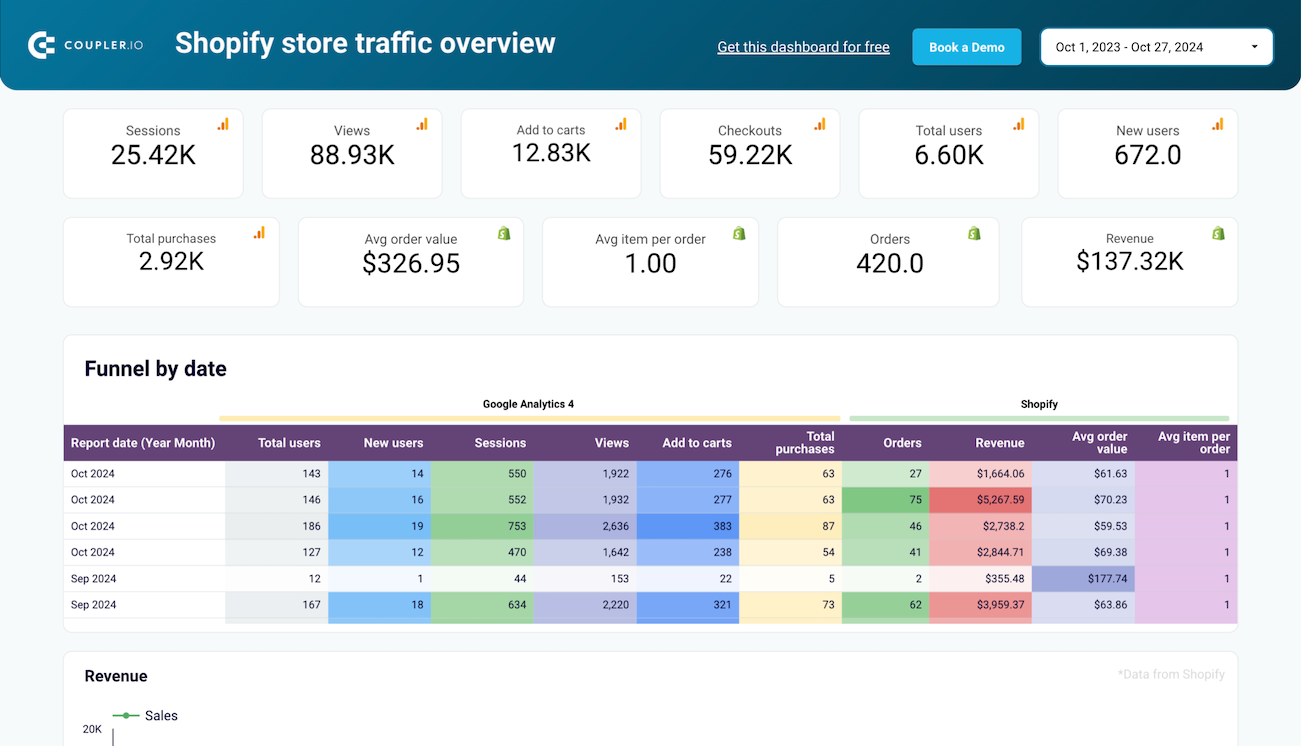
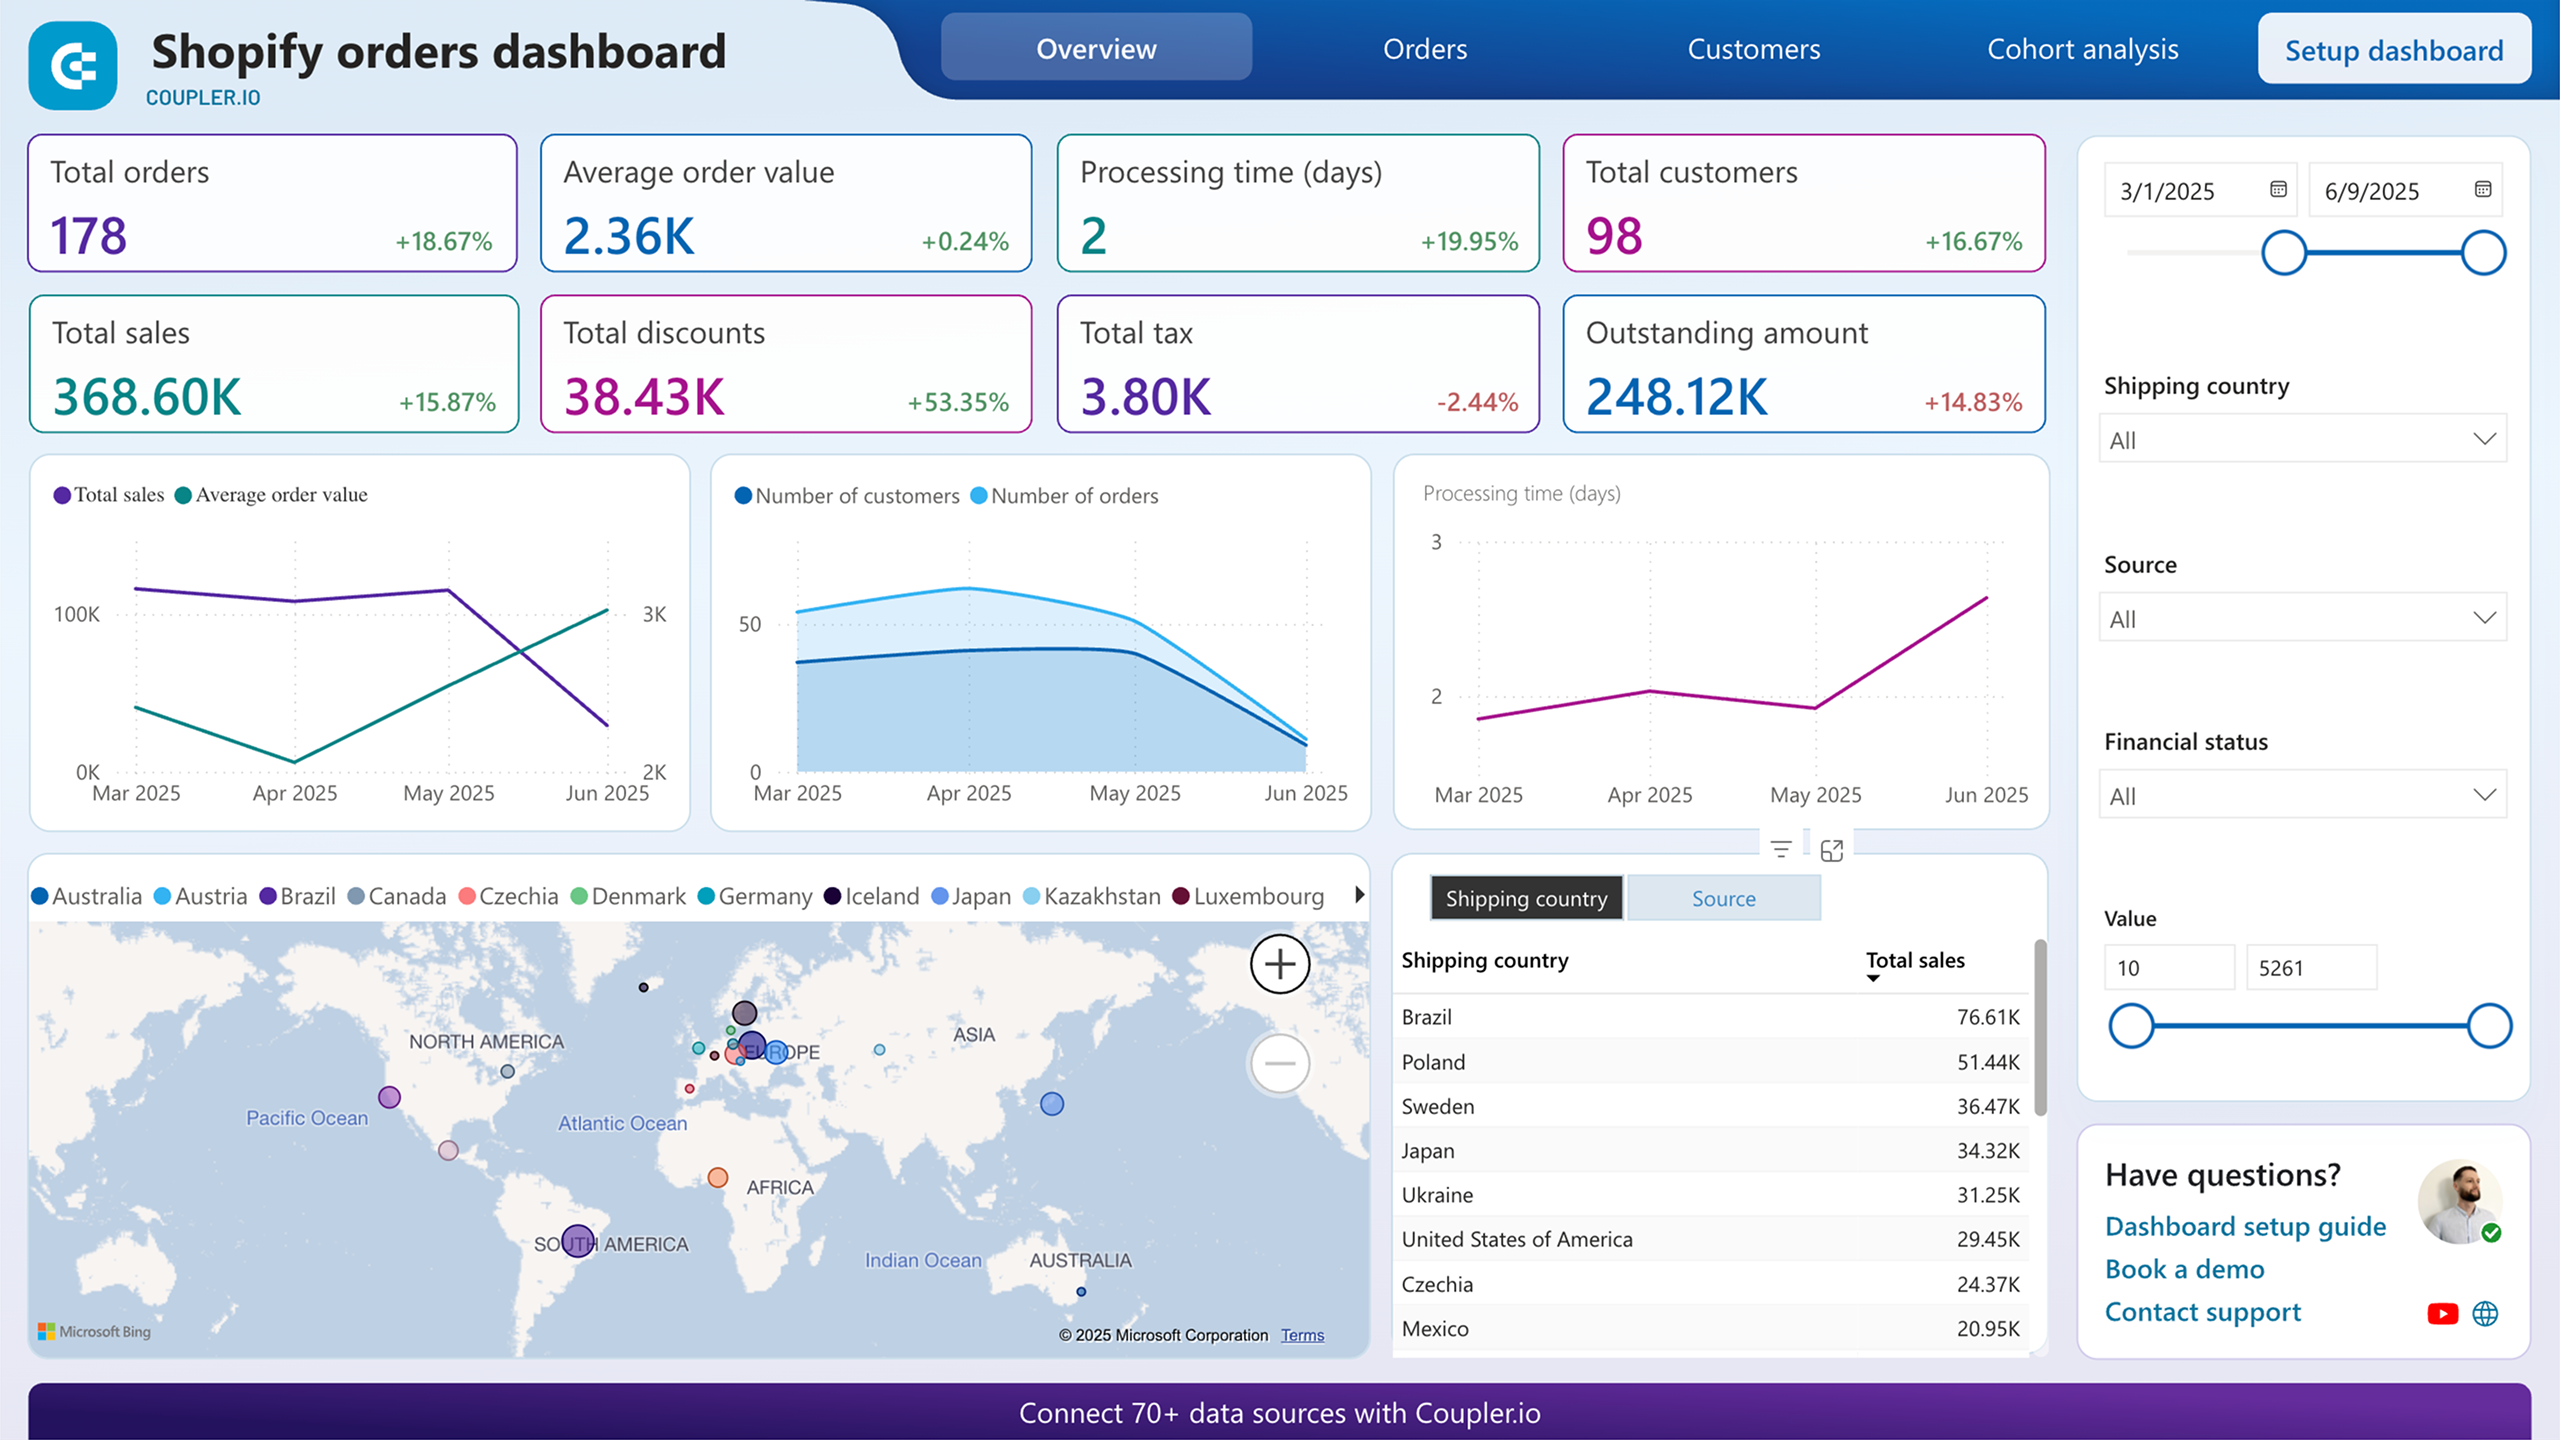
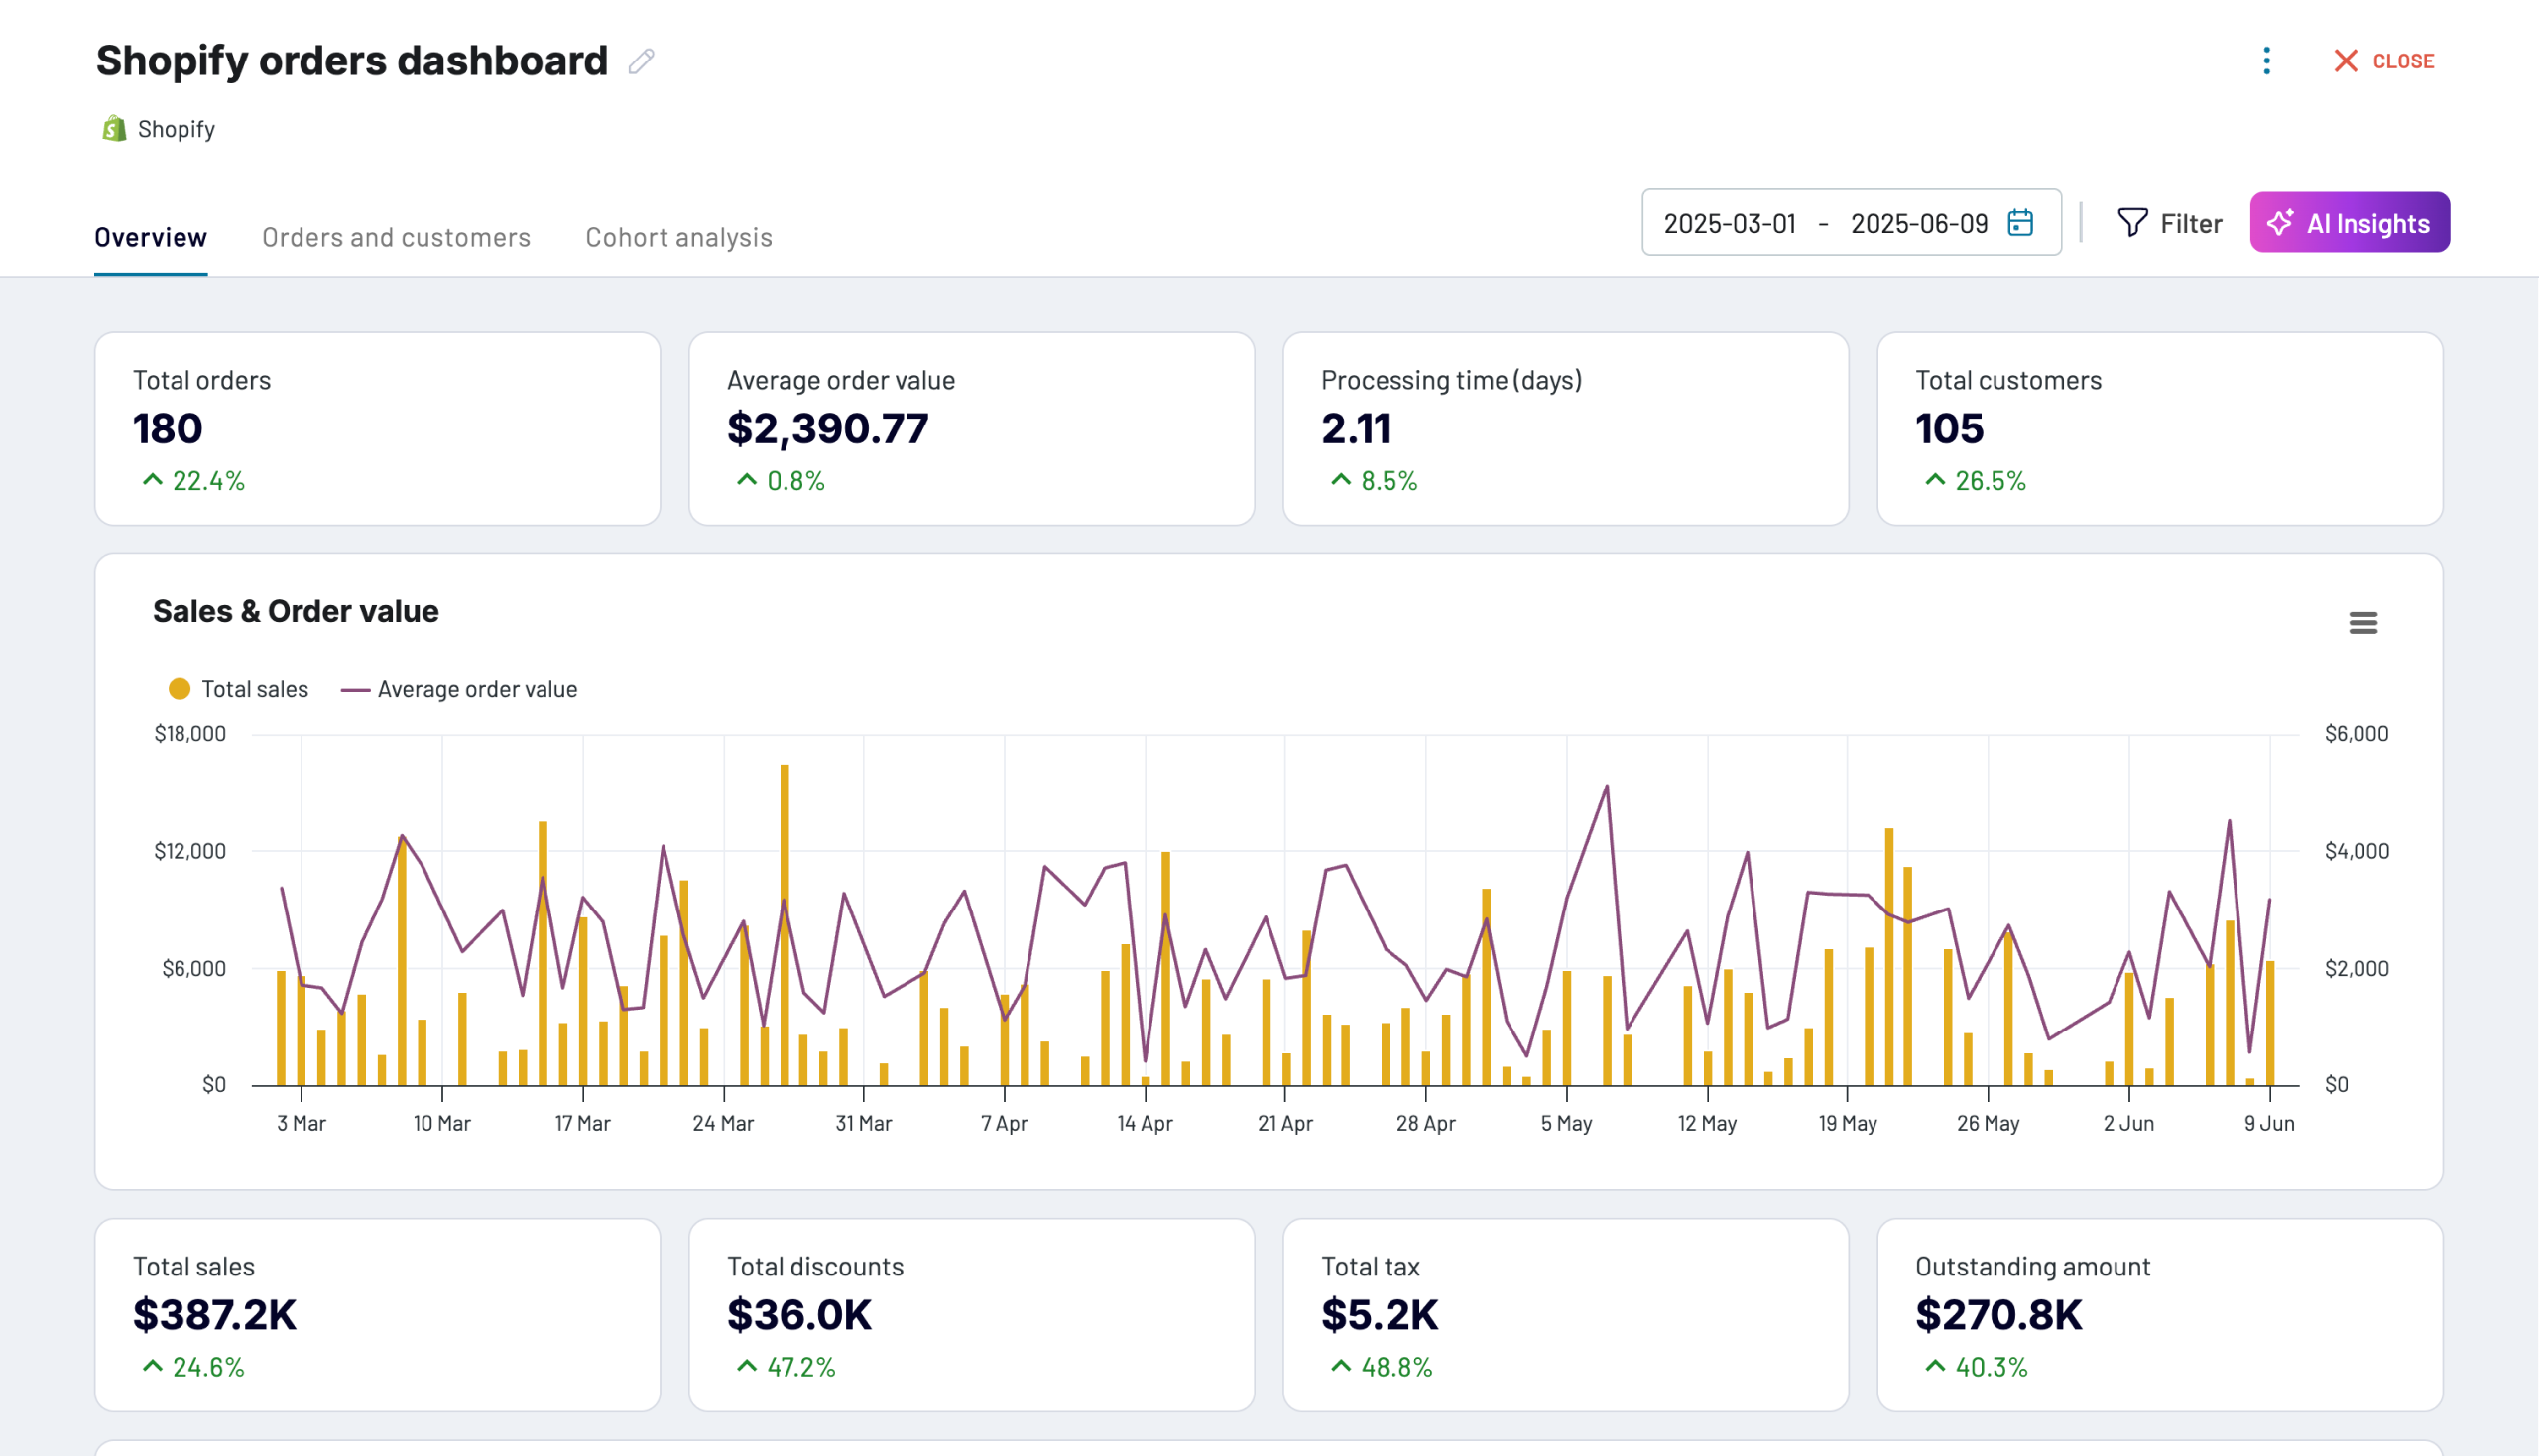
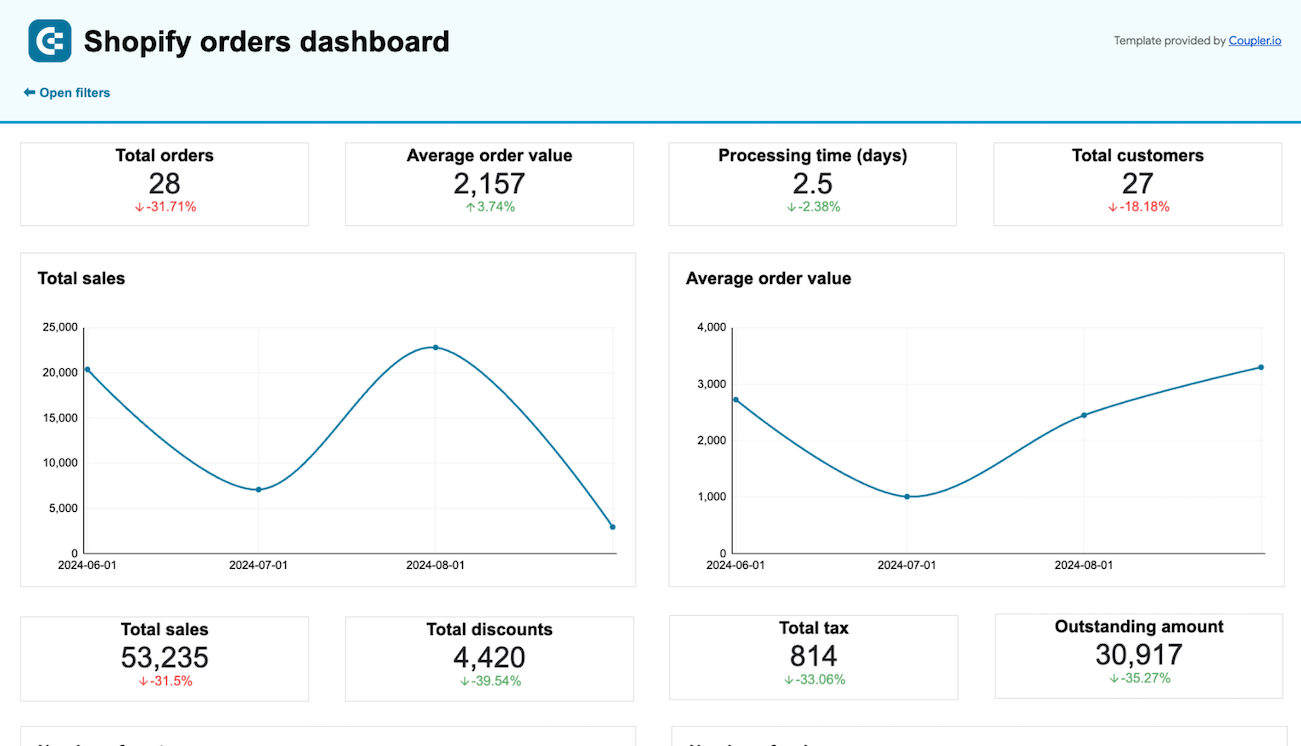
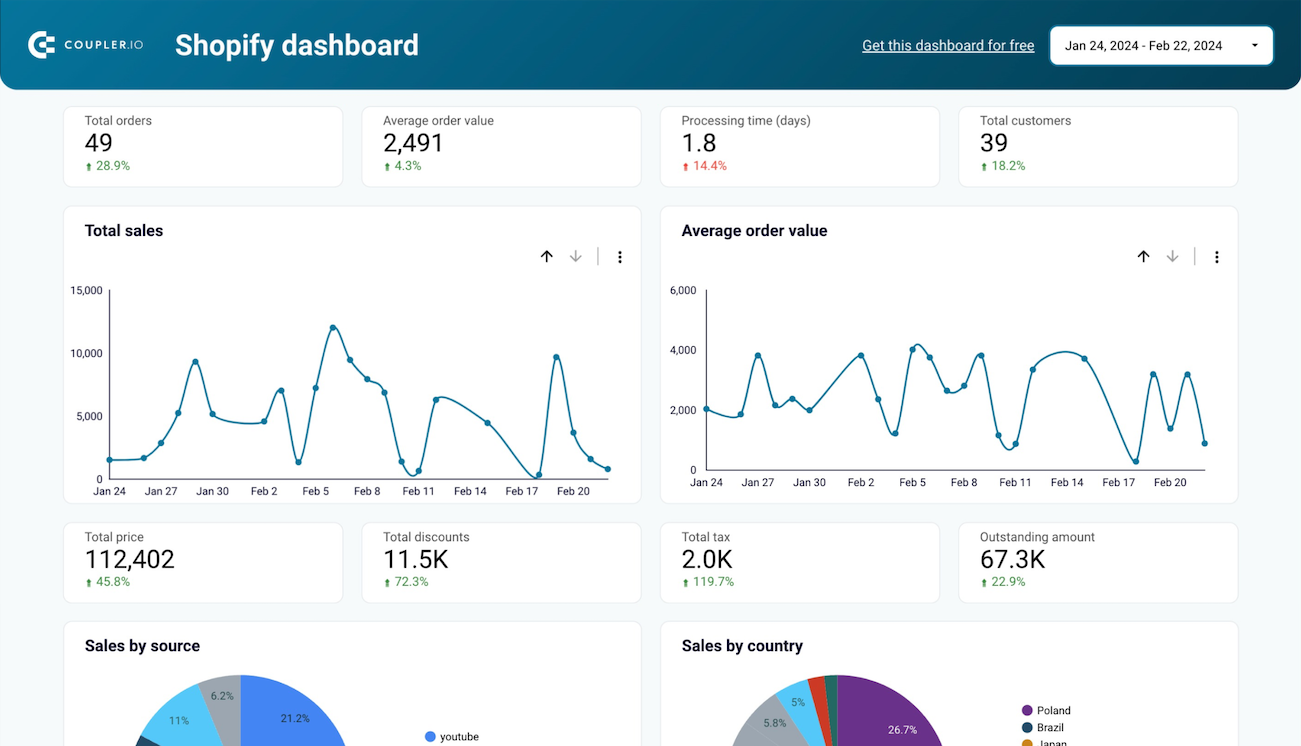
Ecommerce dashboards
Monitor your online store’s performance with ease using our ecommerce dashboard templates. We provide dedicated solutions for platforms like Shopify and WooCommerce to analyze your sales efficiency. Additionally, you can benefit from the dashboard examples for ecommerce marketing performance. They consolidate data from Google Analytics, advertising platforms, and email tools.
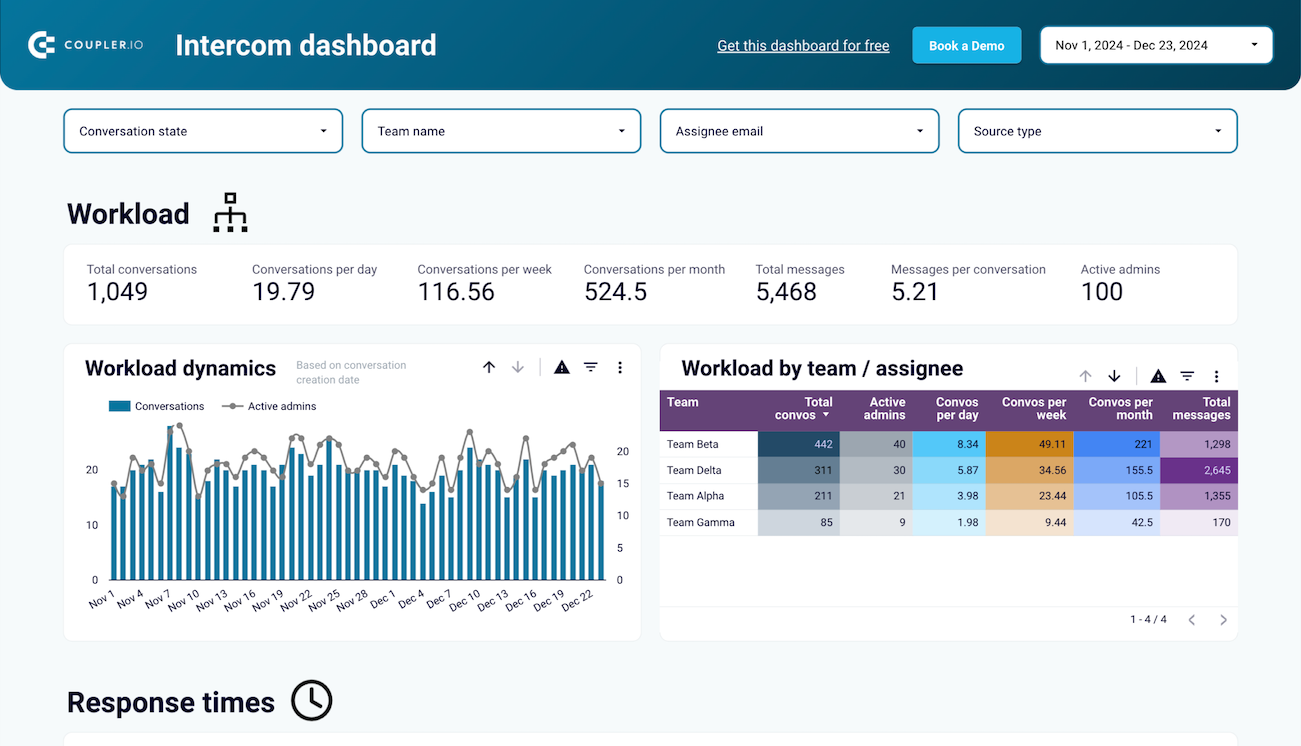
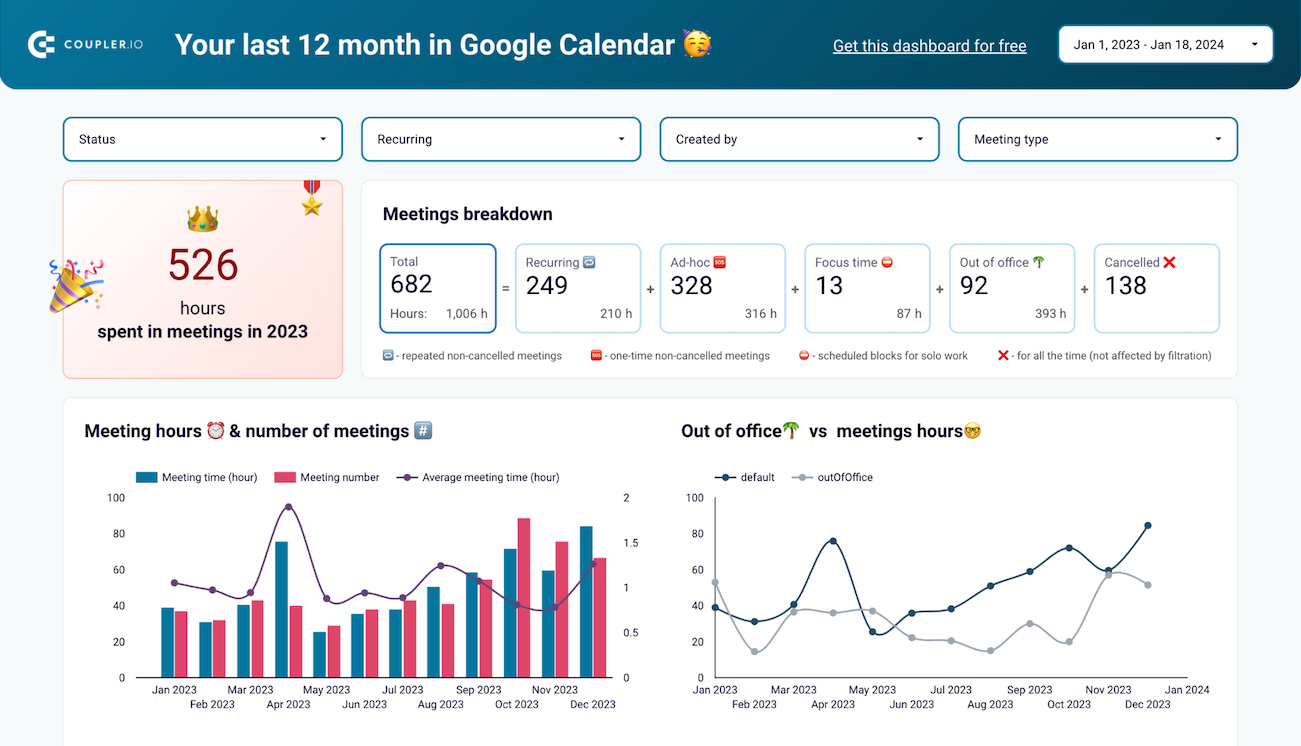
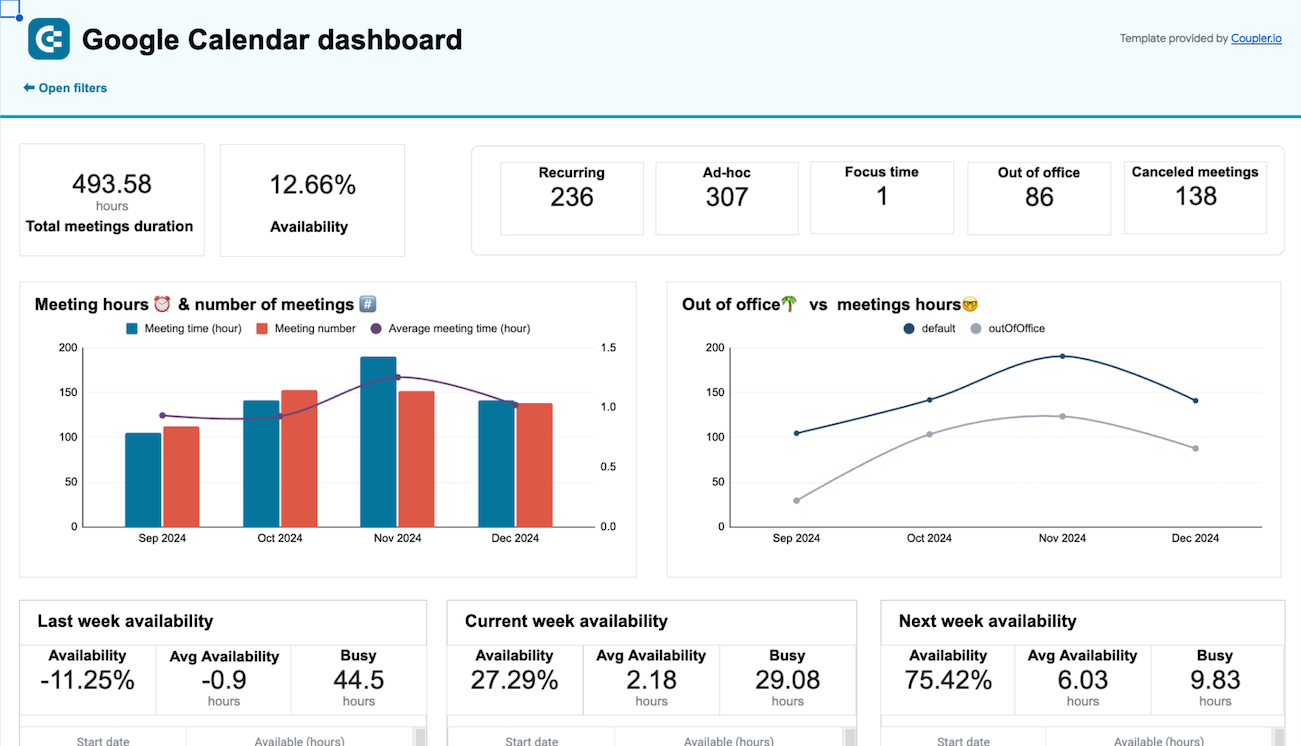
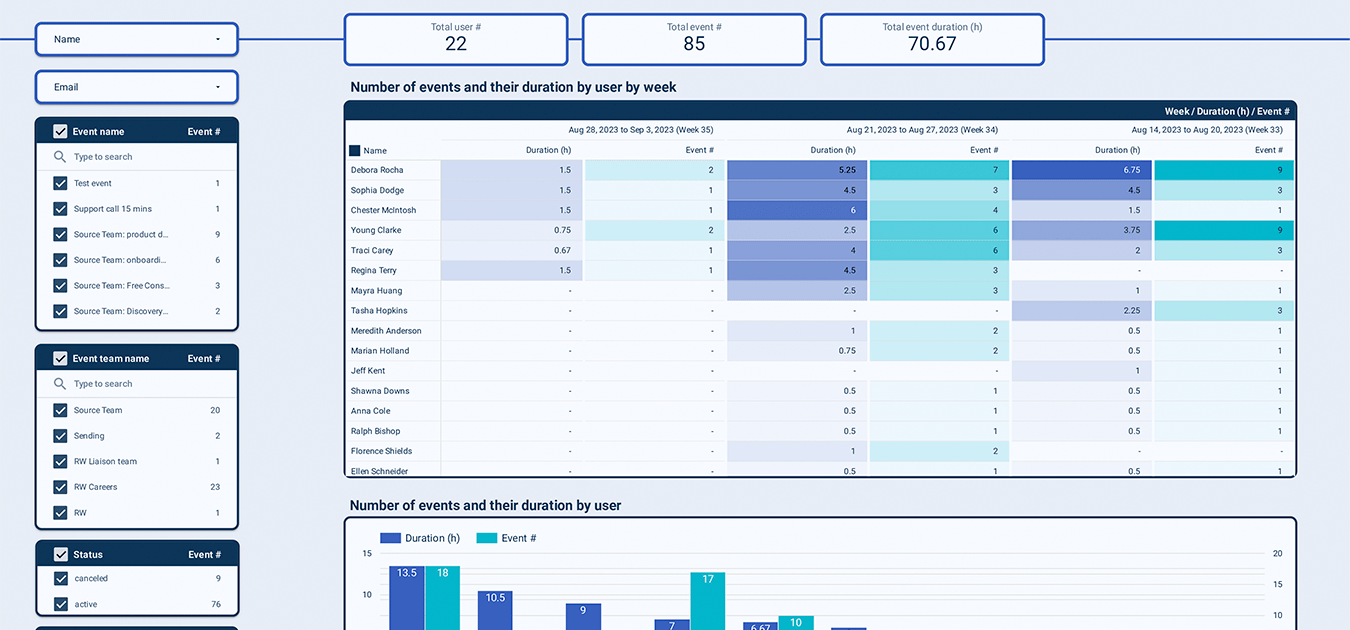
Other dashboards
Optimize your operational efficiency with specialized dashboards for productivity tools. Connect data from Clockify, Harvest, Google Calendar, Intercom, and other sources to track time usage, meeting patterns, and customer support performance. These dashboards help you identify productivity trends, prevent team burnout, balance workloads, and improve response times. Make data-driven decisions to enhance operational workflows and maintain a healthy work-life balance across your organization.
Choose your reporting dashboard template to kick off

Examples of dashboards for every need


about your case. It doesn't cost you a penny 😉
Harness the full potential of dashboard examples
Every report template is designed to save you time and effort. There is no need to export data, transform it, and create visualizations from scratch. All this comes out of the box with the pre-built templates. You only need to connect your data source using Coupler.io, and your dashboard will instantly present visualized insights.
Our reporting dashboard examples are built with analysis in mind. They provide a clear structure to track key metrics and trends. Whether you’re monitoring sales performance, PPC campaigns, or team productivity, each dashboard delivers insights that drive real value. This allows you to make informed decisions faster.
Our experts who contributed to the development of dashboard report templates, focused on delivering clean and intuitive layouts. This approach ensures that data is easy to understand, even at a glance. Visualizations are carefully crafted to highlight what matters most, ensuring stakeholders can quickly grasp insights.